Knowing all the fancy ICT stuff is great
NWOGs, Reaper FVGs, Inverse Breakers, etc... But few can actually use them to build a trading model
So today, I'm going to share the exact trading model I use, with detailed examples and charts
Let's get it 🧵
NWOGs, Reaper FVGs, Inverse Breakers, etc... But few can actually use them to build a trading model
So today, I'm going to share the exact trading model I use, with detailed examples and charts
Let's get it 🧵

First of all, I’d recommend all of you guys to read through The Fundamentals series before reading this thread.
It goes over Liquidity, Market Structure, PD Arrays, Daily Bias and Time & Price
You can find all of them at the "Highlights" tab on my profile. Enjoy!
It goes over Liquidity, Market Structure, PD Arrays, Daily Bias and Time & Price
You can find all of them at the "Highlights" tab on my profile. Enjoy!
For this example, I’m going to use $NQ and give you a breakdown on how you could’ve traded it during the first week of December
(despite everyone saying December is a bad month to trade)
(despite everyone saying December is a bad month to trade)
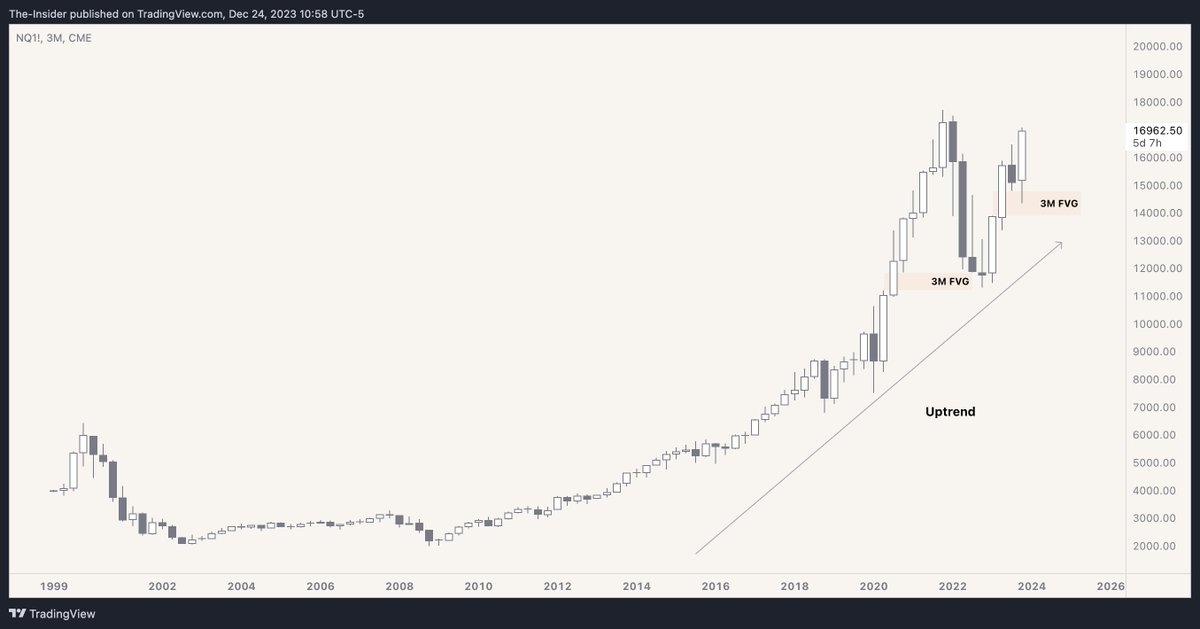
First off, we start on the 3-month chart. We can see that price is on an uptrend.
We can also see price just rebalanced a 3-month FVG and is heading higher.
So our bias is bullish.
We can also see price just rebalanced a 3-month FVG and is heading higher.
So our bias is bullish.
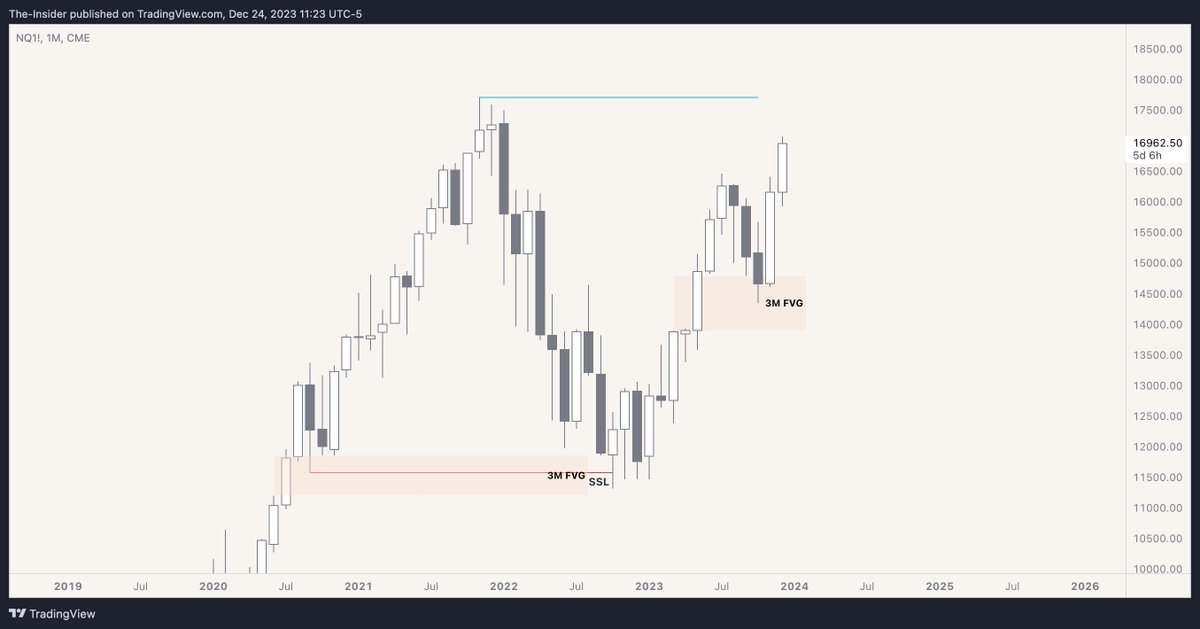
Then we can move down to the 1-month chart.
We can see that price is still bullish, and is expanding higher
Our target is Buyside Liquidity (blue line)
We can see that price is still bullish, and is expanding higher
Our target is Buyside Liquidity (blue line)
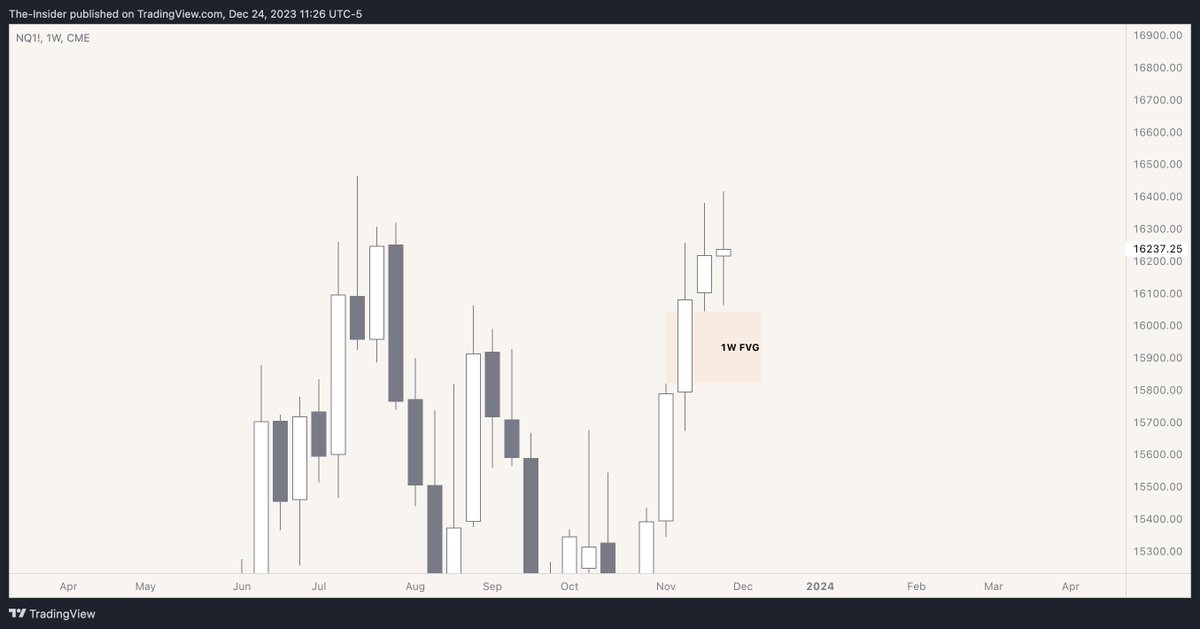
On the Weekly chart, we can see that price formed a Fair Value Gap.
I'll mark it out on the chart if price decides to tap into it
I'll mark it out on the chart if price decides to tap into it
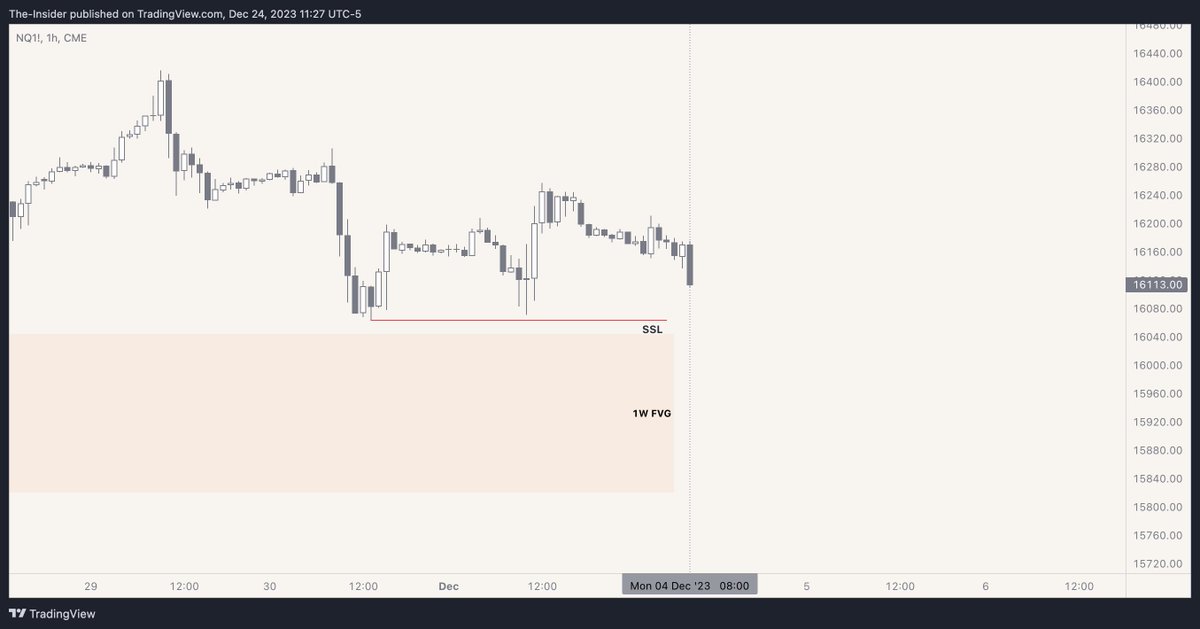
I trade from 8 am EST onwards for indices
As we can see, we have Sellside Liquidity and the Weekly FVG resting below us
I'm expecting price to sweep Sellside Liquidity and tap into the Weekly FVG.
As we can see, we have Sellside Liquidity and the Weekly FVG resting below us
I'm expecting price to sweep Sellside Liquidity and tap into the Weekly FVG.
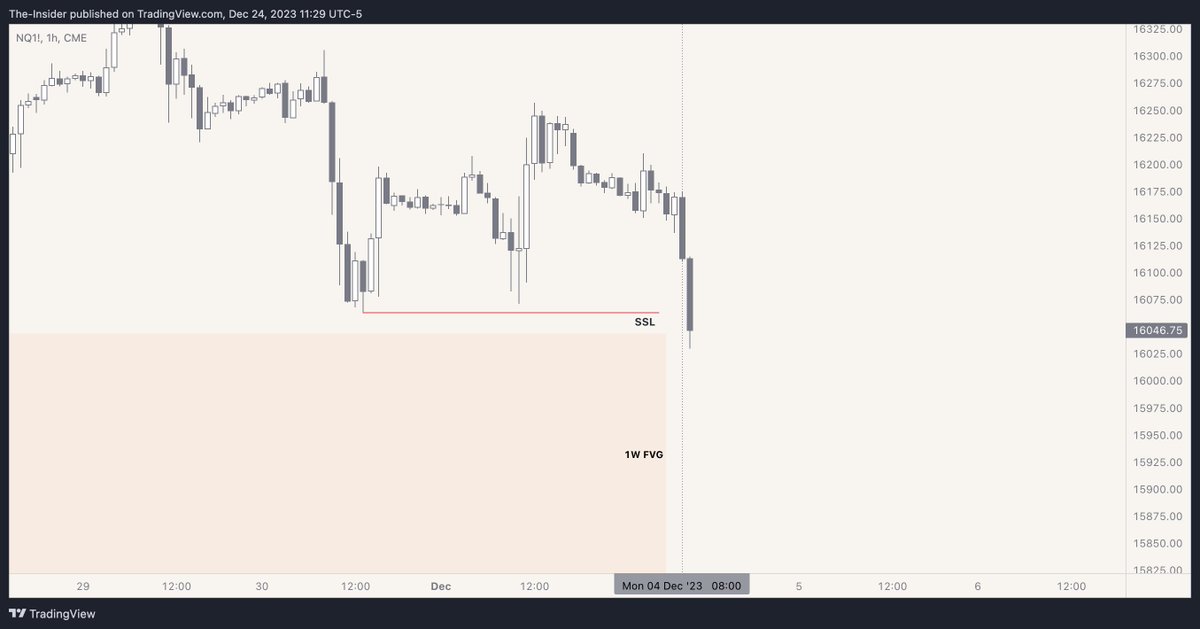
Price tapped into the Weekly FVG and swept Sellside
Now we can head down to the low timeframes to look for an entry
Now we can head down to the low timeframes to look for an entry
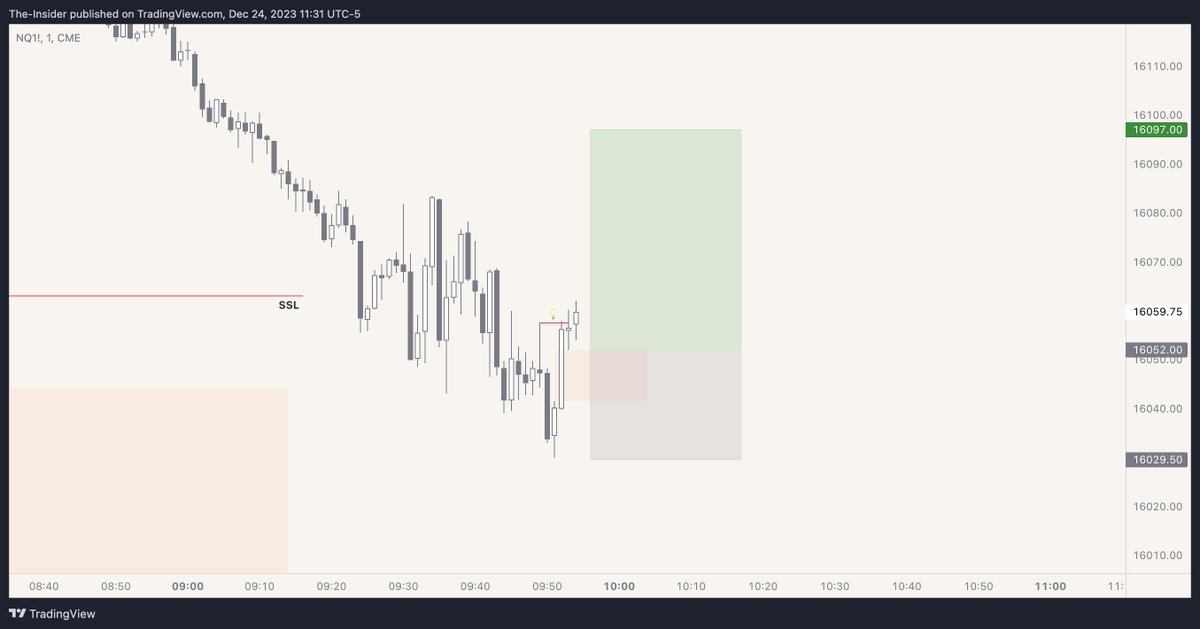
As you can see, price broke structure and there's a FVG that formed
I'll go long at the FVG, and target 2R
SL is 2 ticks below the low
I'll go long at the FVG, and target 2R
SL is 2 ticks below the low
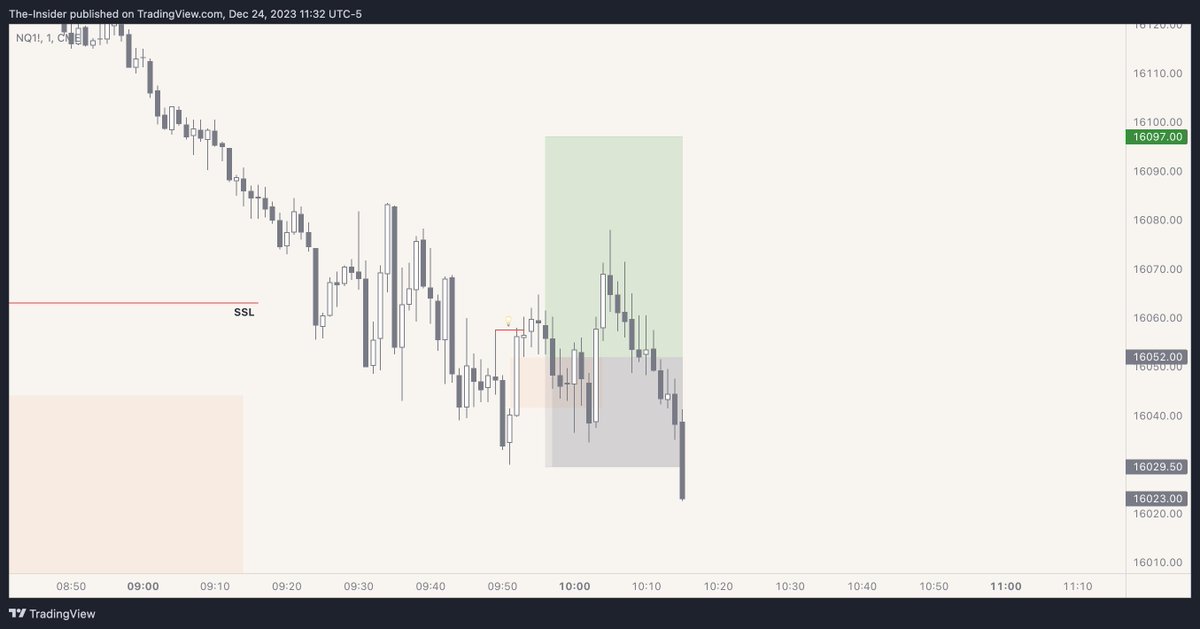
SL hit
-1R
-1R
A rule of thumb I follow is:
- 2 losses or 1 win
Then I'm done trading for the day. Prevents overtrading and helps you secure your profits when you're in the green
- 2 losses or 1 win
Then I'm done trading for the day. Prevents overtrading and helps you secure your profits when you're in the green
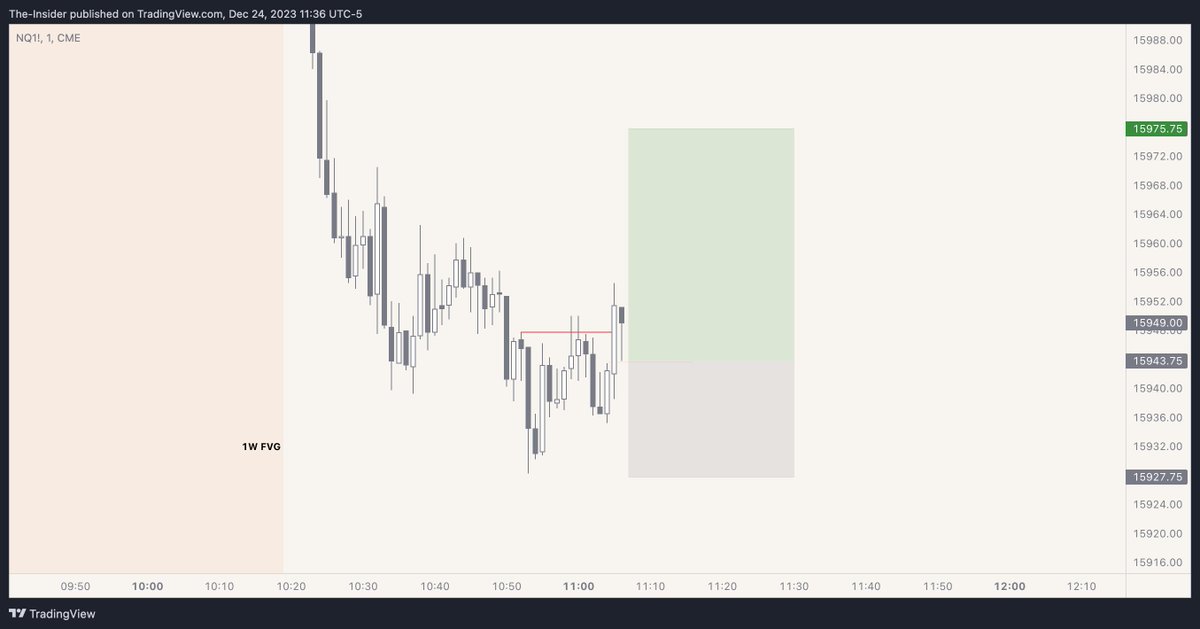
At 11:05 EST, price made a MSS and created a small FVG
I went long at the FVG, stop 2 ticks below the low and my target is 2R
p.s. I don't consider wicks as valid MSS. I always wait for a candle close above a swing high/low
I went long at the FVG, stop 2 ticks below the low and my target is 2R
p.s. I don't consider wicks as valid MSS. I always wait for a candle close above a swing high/low
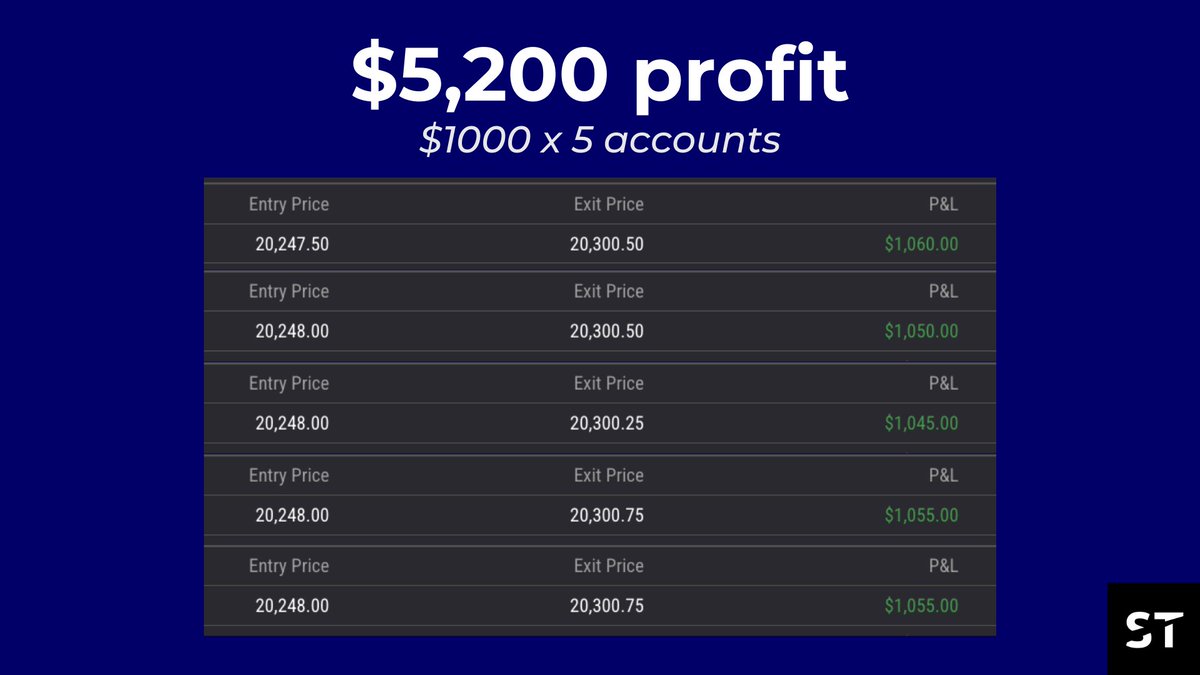
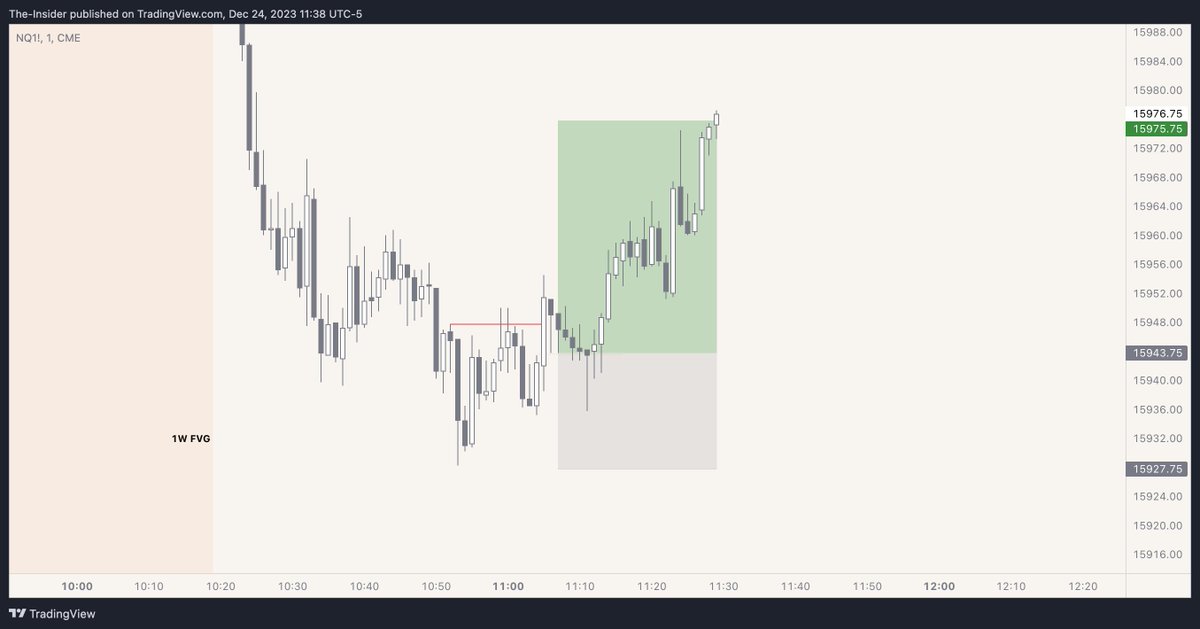
And TP hit!
Up 1R for the day
Up 1R for the day
So in summary, here's what I look for before placing a trade
- Narrative
- Daily Bias
- Time & Price
- HTF PD Array
- LTF MSS
- Target 2R
Time:
Indices - NY AM Session
Forex - London Open Killzone & AM Session
HTF PD Array
FVGs or IFVGs H1 or above
- Narrative
- Daily Bias
- Time & Price
- HTF PD Array
- LTF MSS
- Target 2R
Time:
Indices - NY AM Session
Forex - London Open Killzone & AM Session
HTF PD Array
FVGs or IFVGs H1 or above
This model will usually provide 1-3 setups per week, on each pair
But the key is you must have a clear Bias, else you'll get chopped up on the lower timeframe.
I'd recommend you to backtest this on whichever pair you trade the most, and verify the results yourself
But the key is you must have a clear Bias, else you'll get chopped up on the lower timeframe.
I'd recommend you to backtest this on whichever pair you trade the most, and verify the results yourself
That's a wrap!
If you enjoyed this thread:
Like & RT the tweet below to share with others 🤍
Good luck and good trading!
If you enjoyed this thread:
Like & RT the tweet below to share with others 🤍
Good luck and good trading!
https://twitter.com/1502512803693080581/status/1738971294329176323
• • •
Missing some Tweet in this thread? You can try to
force a refresh