1/
PMC COVID-19 Tracker, Dec 25, 2023 (U.S.)
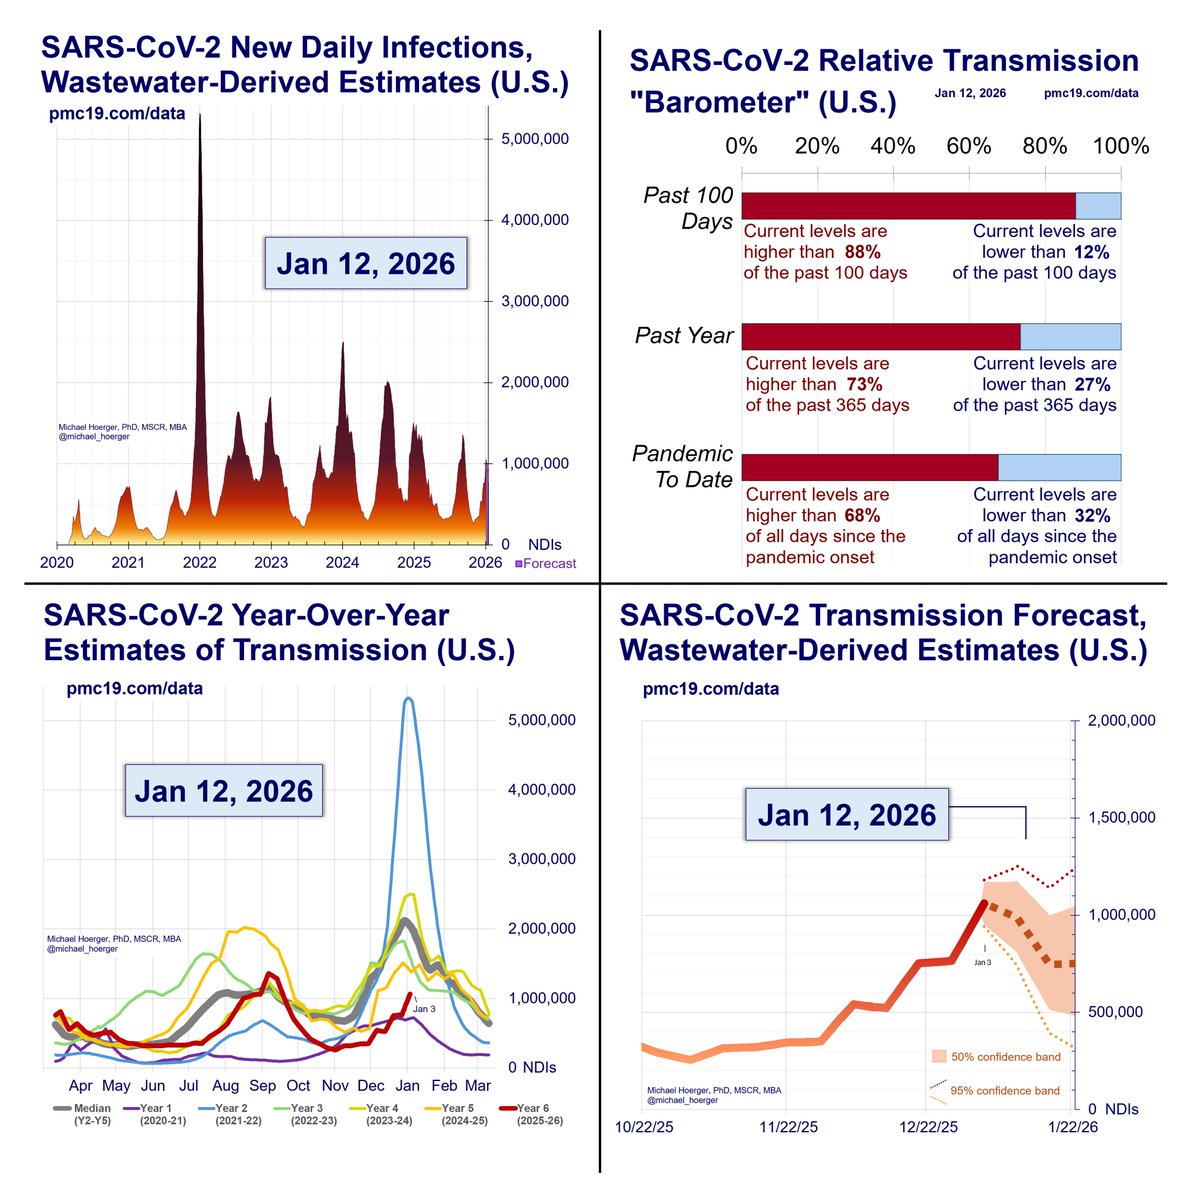
At peak surge, we will have 2 million U.S. #COVID infections/day.
Nearly 1 in 3 Americans will get infected during the peak 2 months of this winter surge. That’s 105 million infections & >5 million resulting #LongCOVID cases.
PMC COVID-19 Tracker, Dec 25, 2023 (U.S.)
At peak surge, we will have 2 million U.S. #COVID infections/day.
Nearly 1 in 3 Americans will get infected during the peak 2 months of this winter surge. That’s 105 million infections & >5 million resulting #LongCOVID cases.

2/
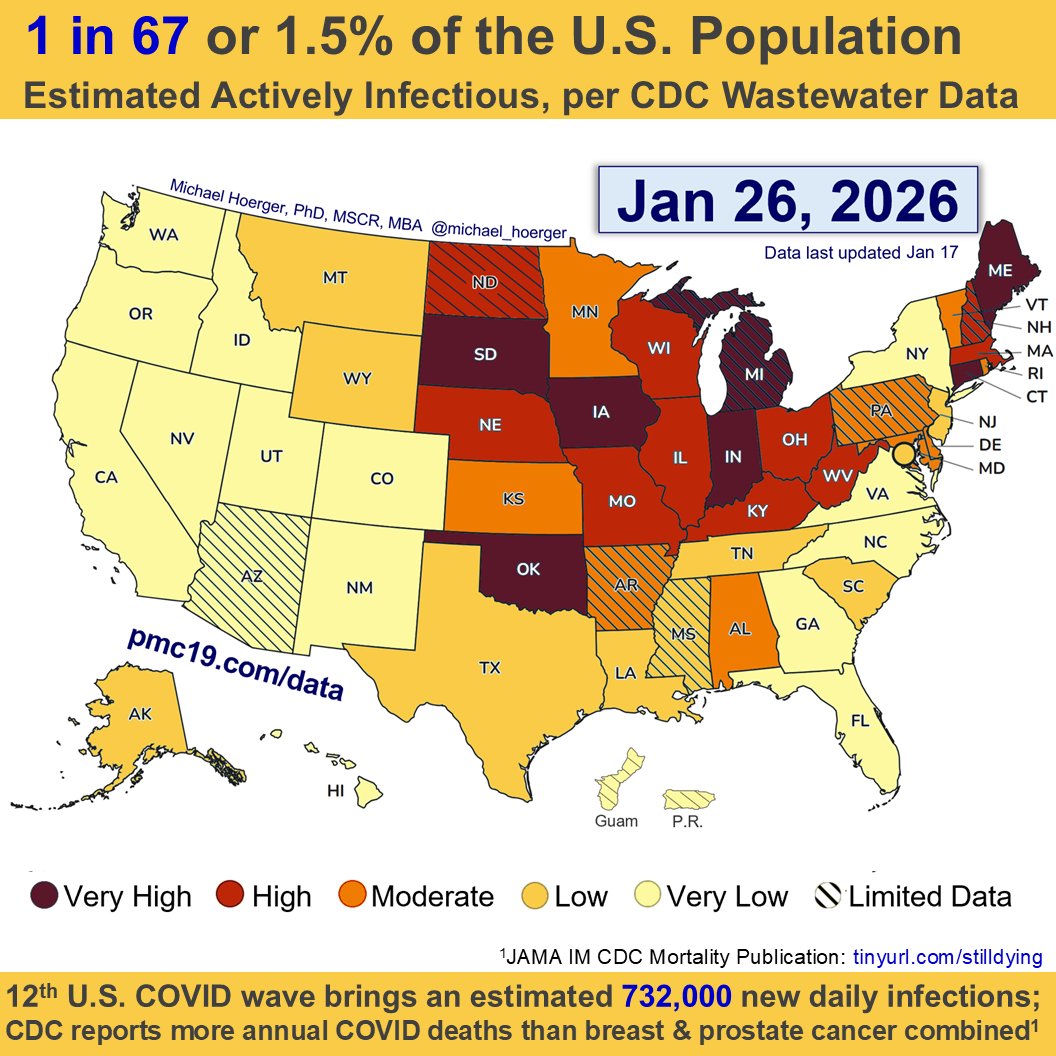
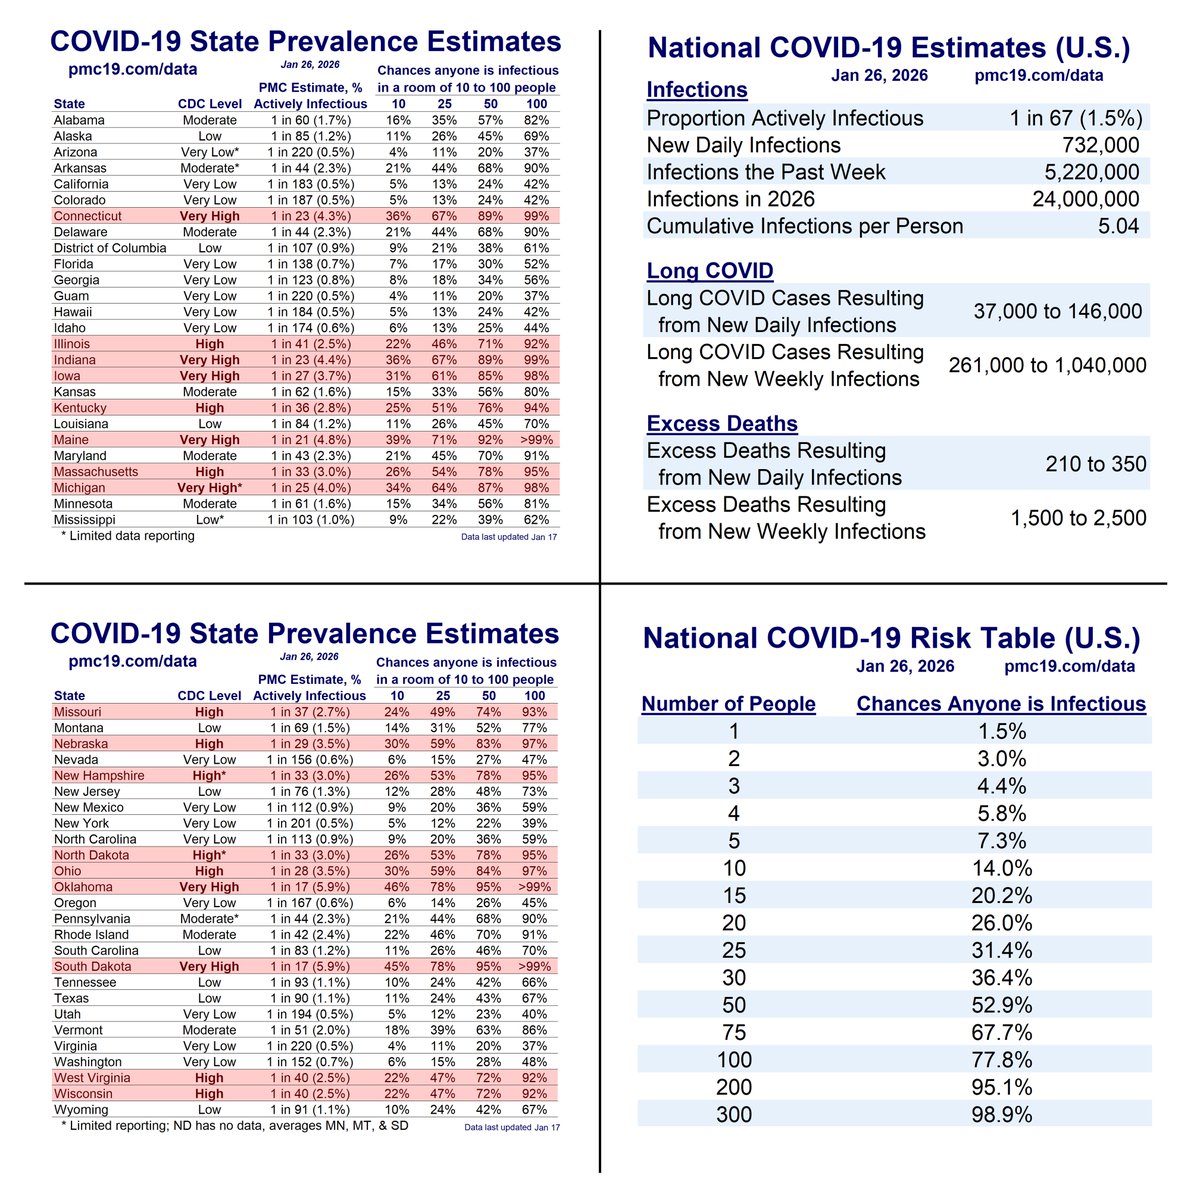
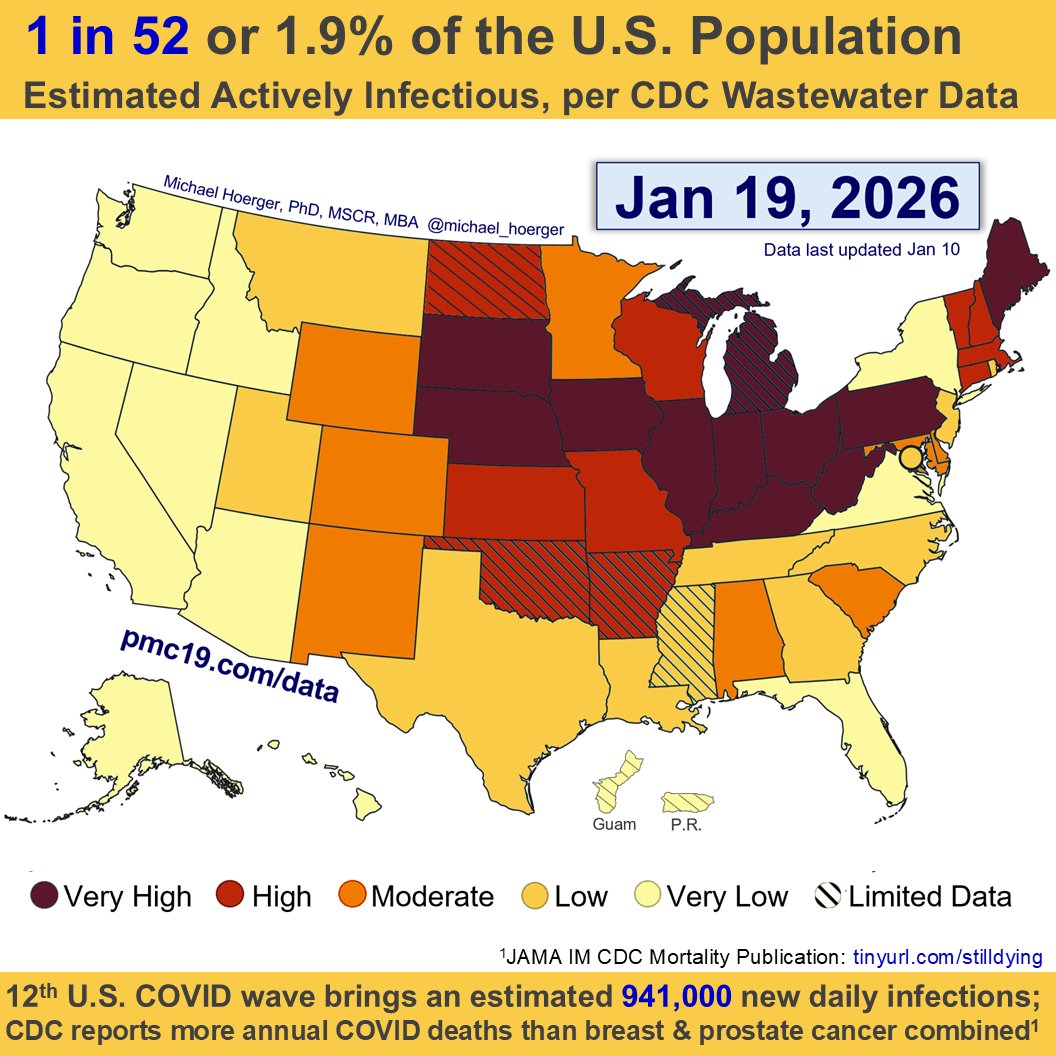
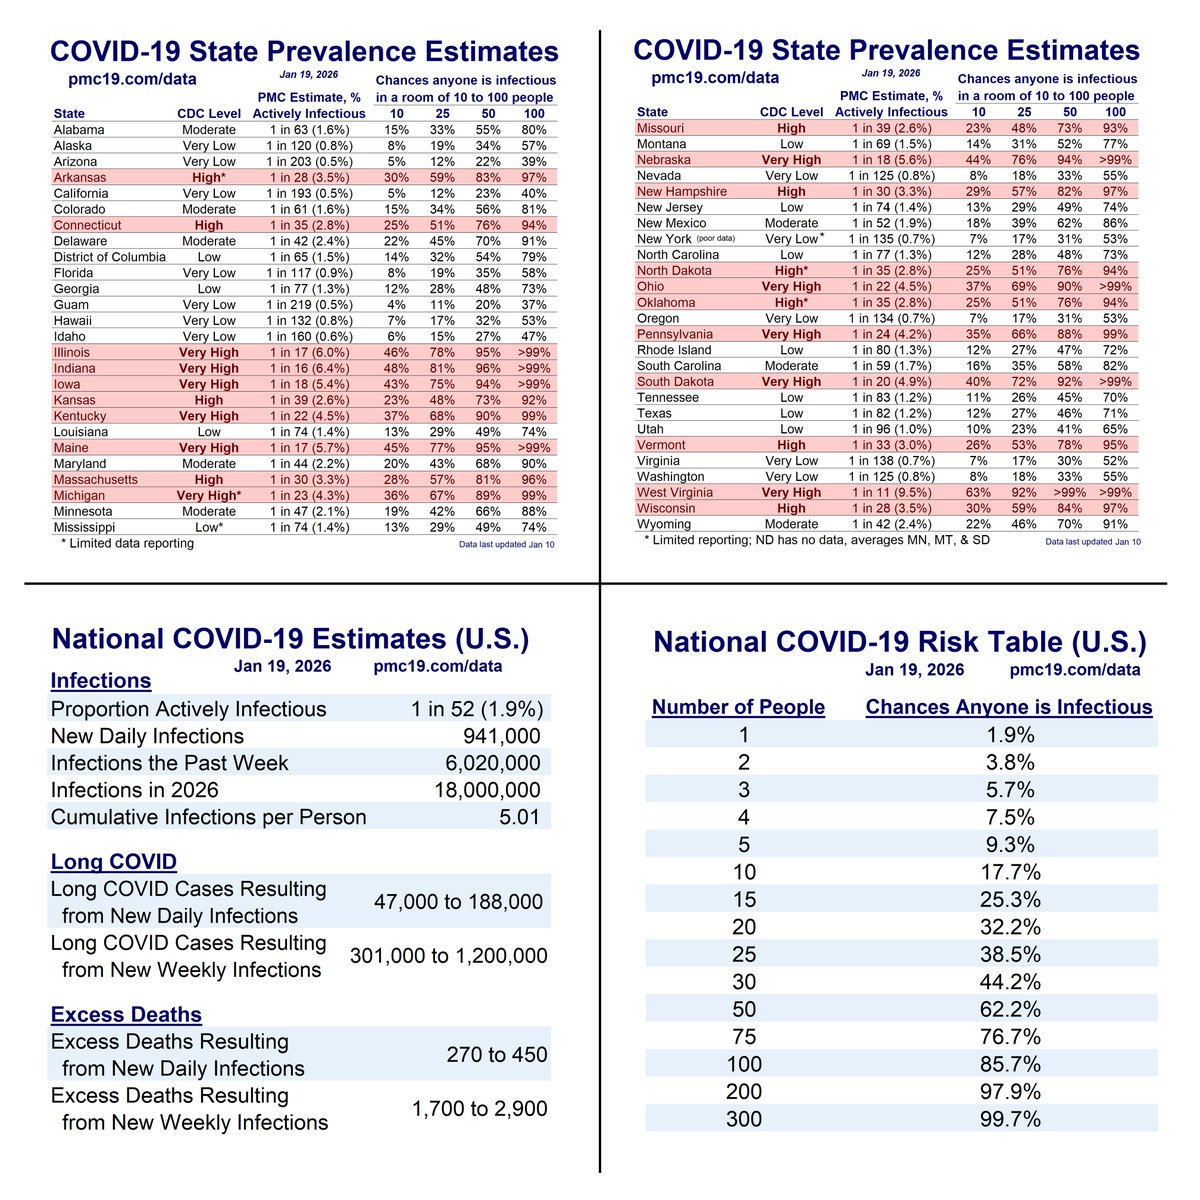
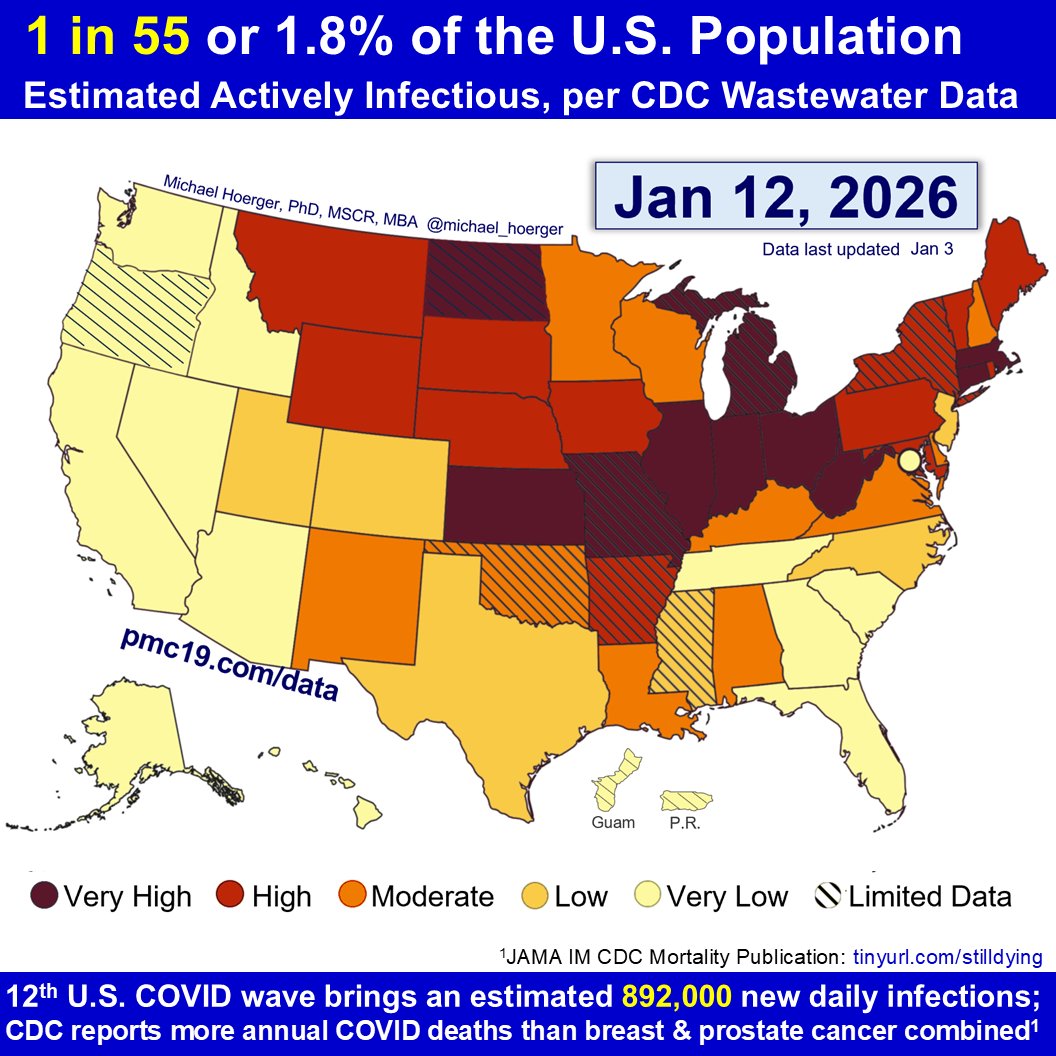
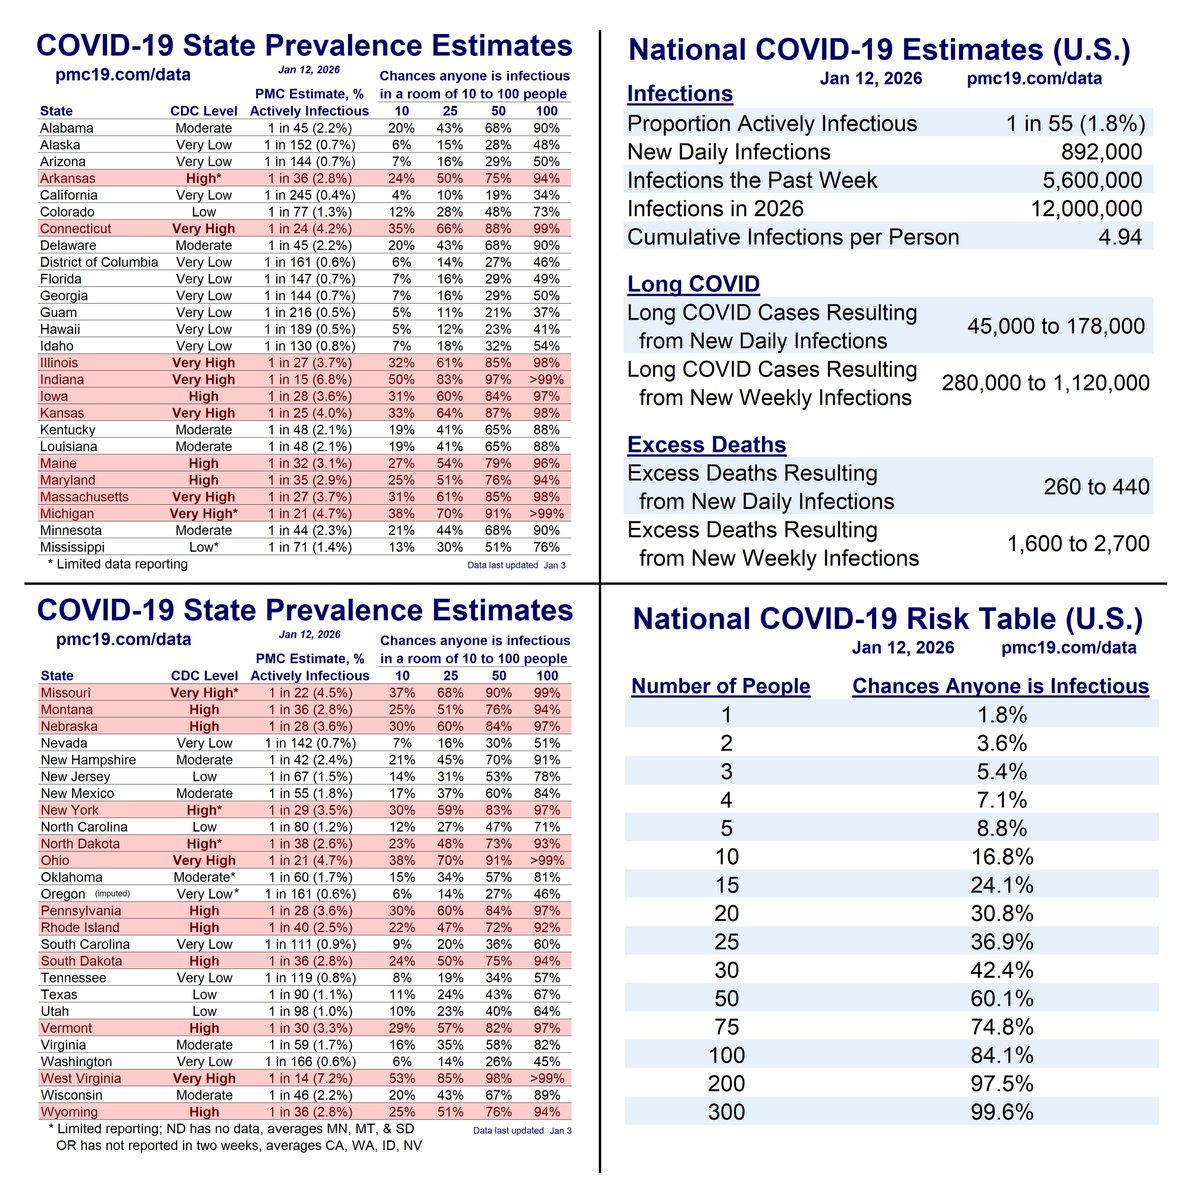
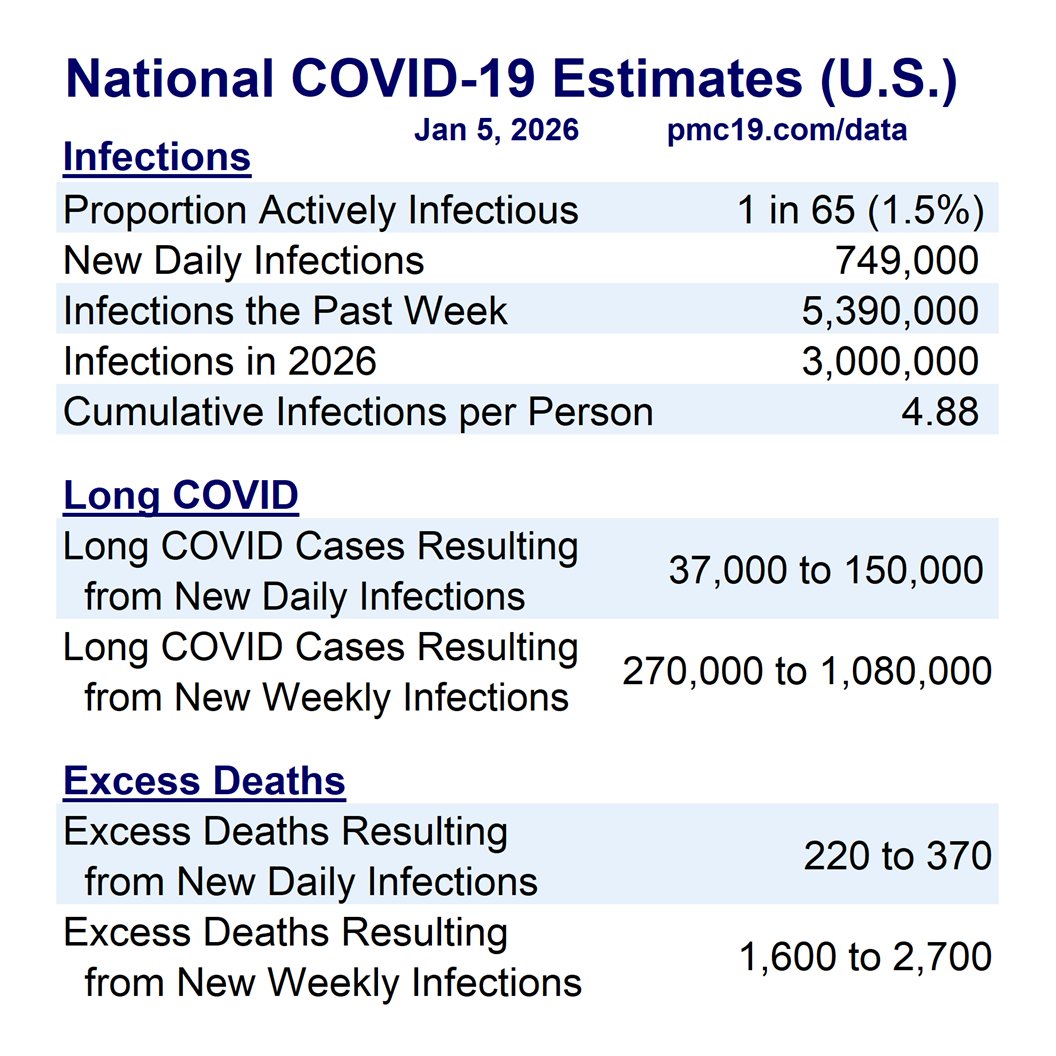
Today on Christmas, 3.5% of the U.S. population (1 in 29) is actively infectious with #COVID & rising toward a Jan 10 peak.
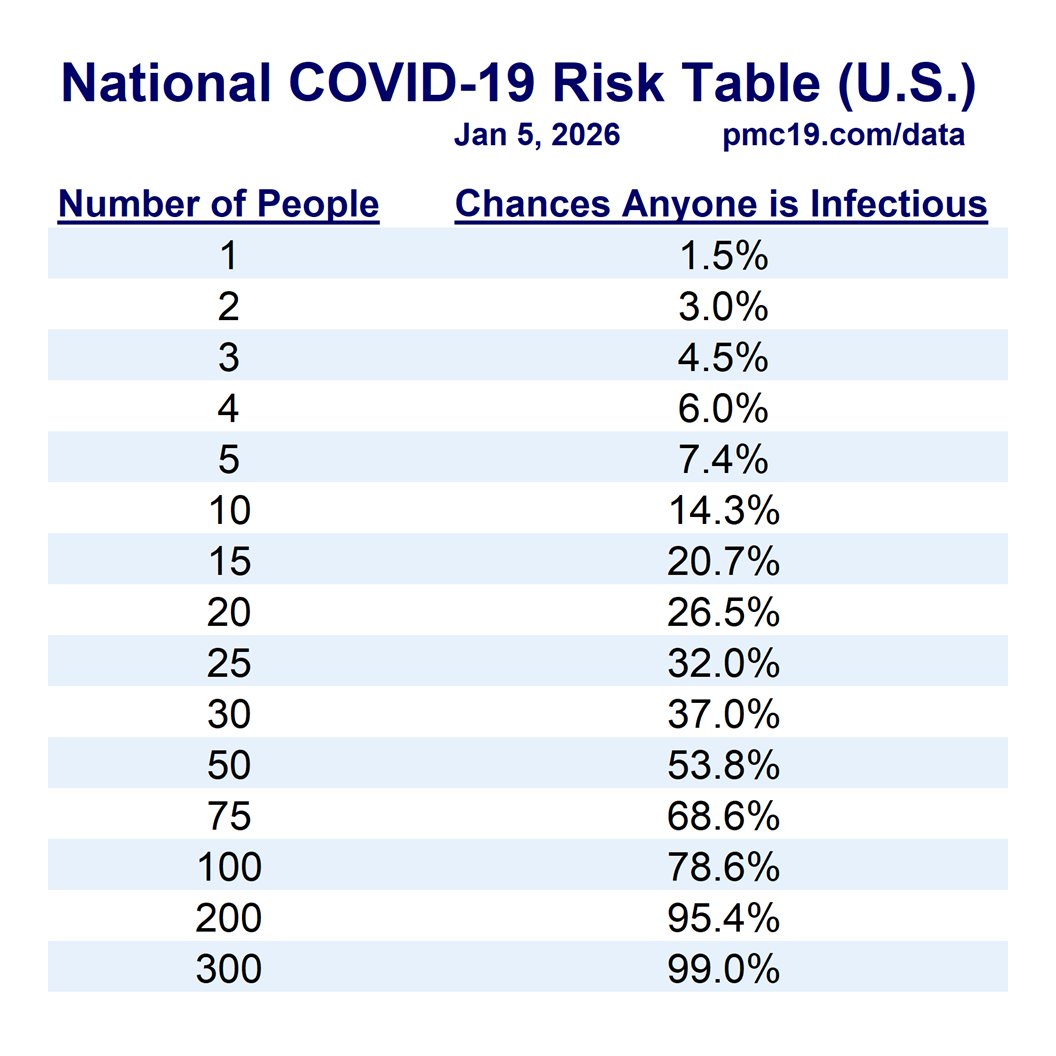
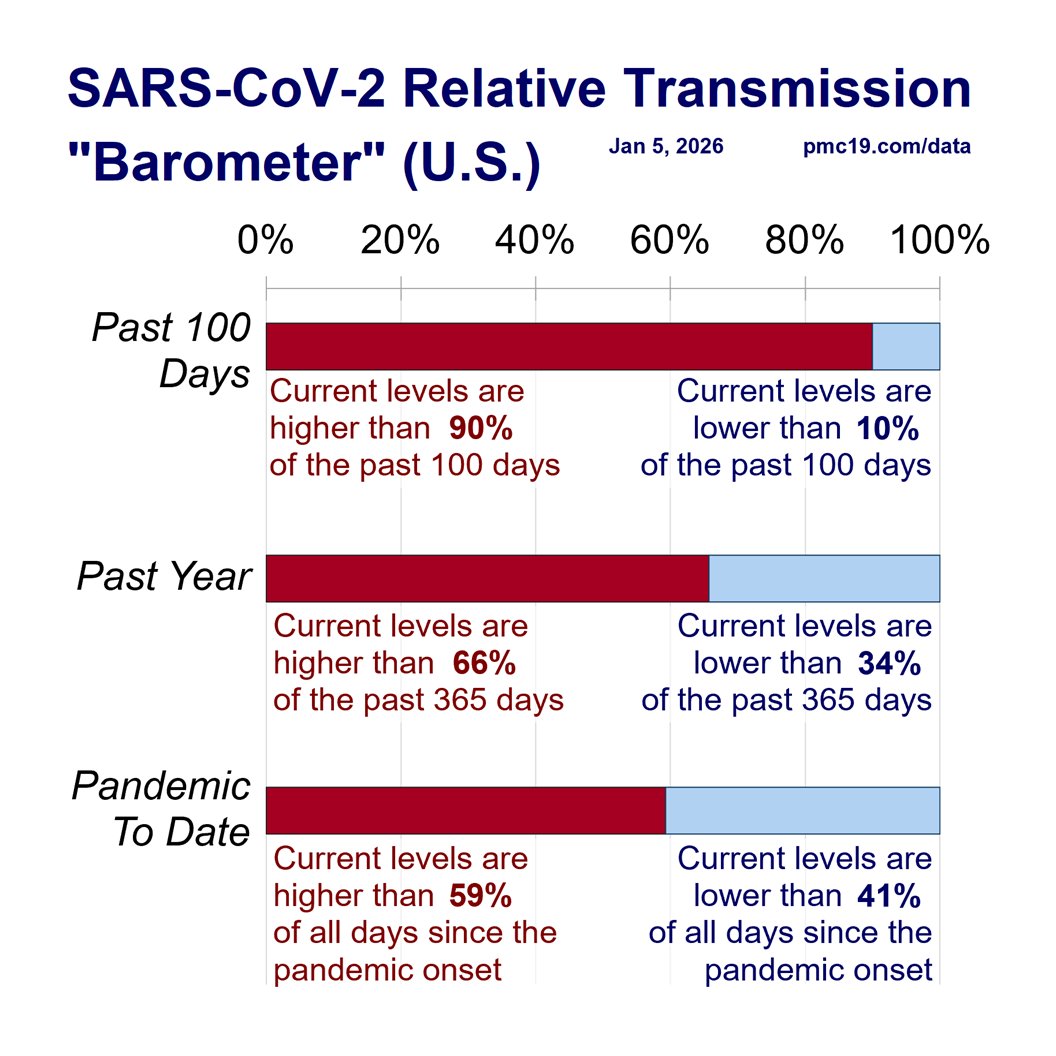
COVID transmission is higher than during 94.7% of the pandemic. There's a 50% chance of a COVID exposure if interacting with 20 people today.
Today on Christmas, 3.5% of the U.S. population (1 in 29) is actively infectious with #COVID & rising toward a Jan 10 peak.
COVID transmission is higher than during 94.7% of the pandemic. There's a 50% chance of a COVID exposure if interacting with 20 people today.

3/
We posted our first “Christmas Risk” table on October 30, and as you can see, it performed exceedingly well.
These tables should lend confidence in the PMC dashboard, and raise concern about public health leadership and the news media.
Being able to accurately predict within a few percentage points the probability of infectiousness in a room of 20 people, for example, 8 weeks out is very helpful for planning. Moreover, many would estimate *today* that the risk in a room of 20 people is <1 percentage point. We’re talking about potentially magnitudes of difference in risk estimation, and this was highly predictable long ago. It’s not something unanticipated due to a new oddly-behaving sub-variant (there will always be a new sub-variant this time of year when no mitigation) or high rates of air travel (also unsurprising). It was highly predictable, and public health officials should not be given an out. The media will try to frame this as an unanticipated surge, and it simply was not, according to those who know how to forecast.
The formal PMC forecast keeps to 4 weeks, but sometimes a more speculative long-term estimate can help with planning, especially surrounding booking travel plans. People might want to take a wait-and-see approach to booking, purchase travel insurance, or cancel entirely. We characterized the table with appropriate caution, and hopefully it was helpful.
Putting out these forecasts requires putting one’s professional reputation as a scientist on the line. It’s very easy for anonymous and fake-name accounts to make speculative forecasts. The information we provide tends to be highly conservative within a much broader set of analyses, sensitivity analyses, and scenarios considered. Know that we are very cautious about what information we share, post considerable detail on the underlying methodology and assumptions in the online report, and carefully describe how estimates may be more precise or more speculative at times. A published peer-reviewed article will ultimately account for the strengths and limitations in the accuracy of the model.

4/
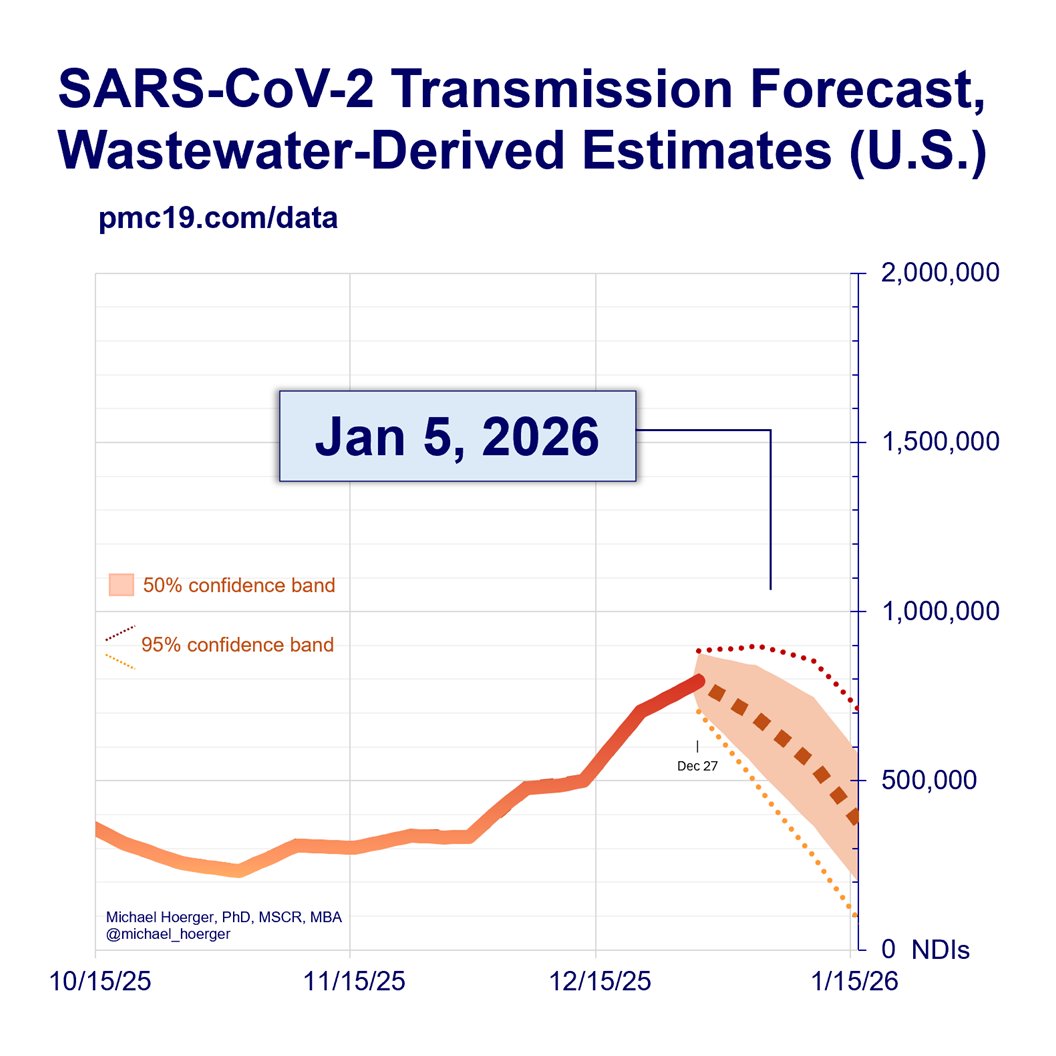
Christmas infections will seed New Year’s Eve/Day infections, leading to a peak around the 10th.
Around New Year’s, interacting with 15-20 people means a 50% chance of a COVID exposure. In a restaurant or plane, the risk jumps to >98%.
Christmas infections will seed New Year’s Eve/Day infections, leading to a peak around the 10th.
Around New Year’s, interacting with 15-20 people means a 50% chance of a COVID exposure. In a restaurant or plane, the risk jumps to >98%.

5/
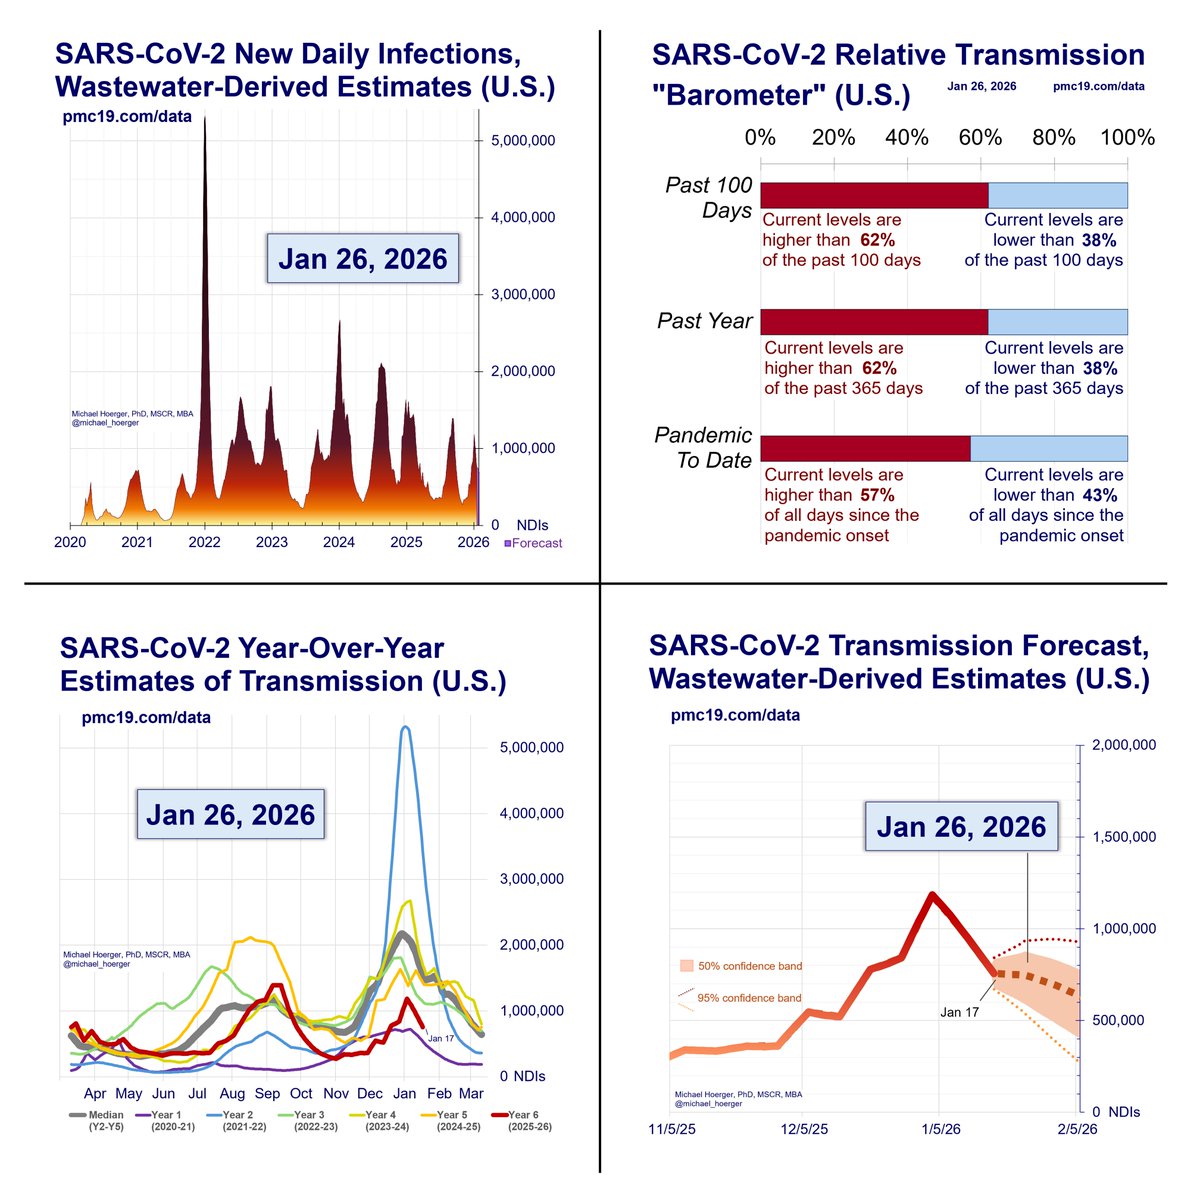
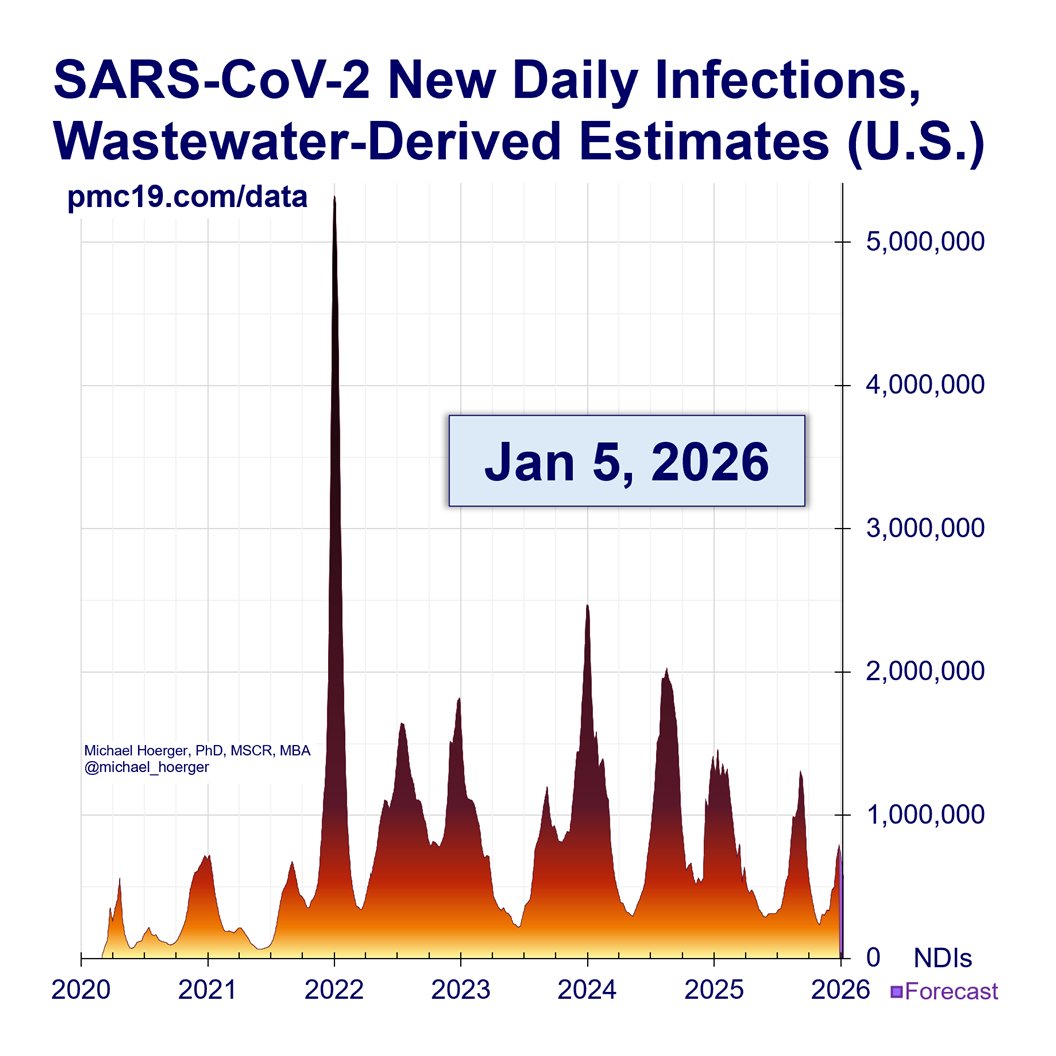
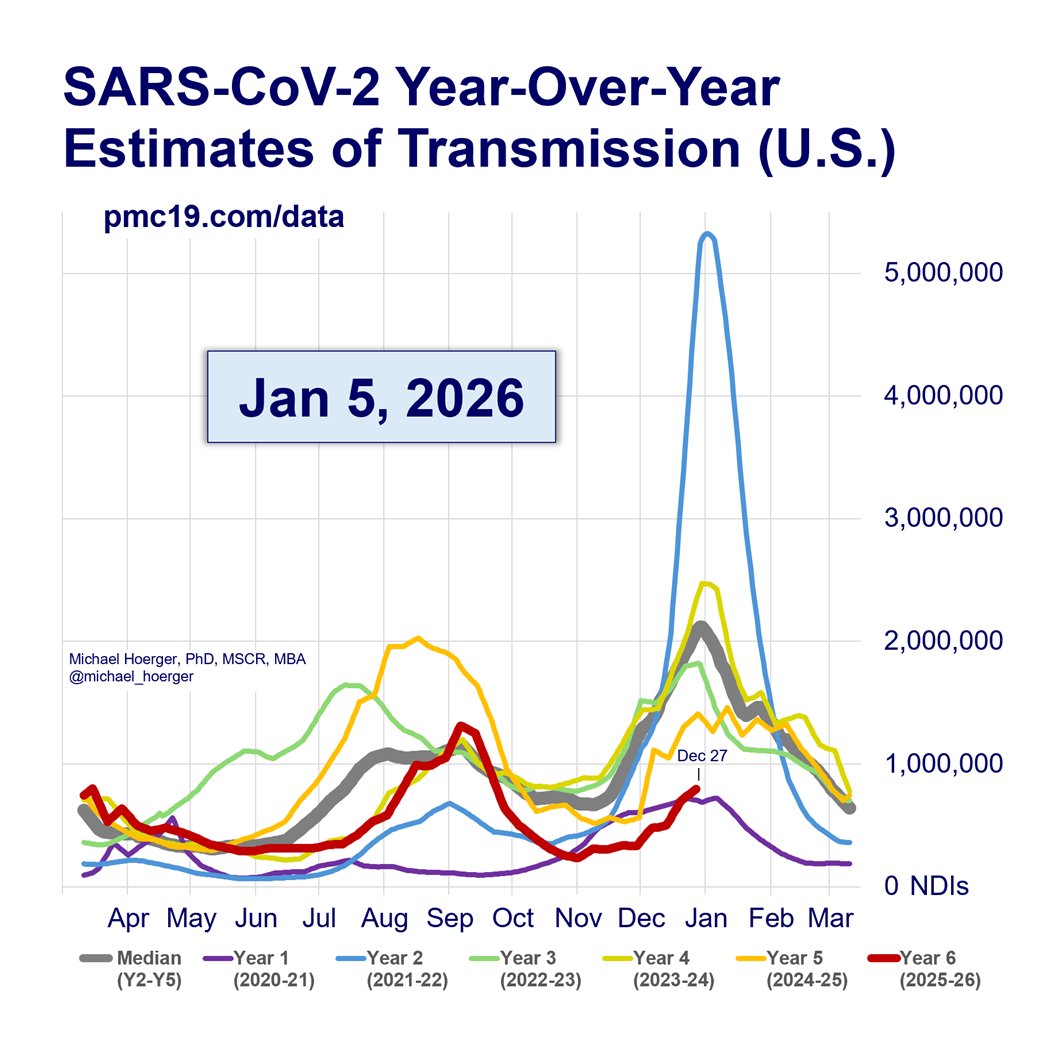
Zooming out to the full pandemic, we are in the 8th U.S. COVID wave & 2nd biggest all-time.
That assumes no major wastewater corrections.
We've surpassed the 1st wave, winter of 2020-21, Delta, & 2023 summer wave. Claims that “COVID is over” are harmful misinformation.
Zooming out to the full pandemic, we are in the 8th U.S. COVID wave & 2nd biggest all-time.
That assumes no major wastewater corrections.
We've surpassed the 1st wave, winter of 2020-21, Delta, & 2023 summer wave. Claims that “COVID is over” are harmful misinformation.

6/
Hospitals & clinicians should require universal masking. Public health officials should warn of the surge & recommend multi-layered mitigation.
Anything less is grounded in politics, short-term revenue, or defensiveness against COVID anxiety.
Hospitals & clinicians should require universal masking. Public health officials should warn of the surge & recommend multi-layered mitigation.
Anything less is grounded in politics, short-term revenue, or defensiveness against COVID anxiety.
https://twitter.com/michael_hoerger/status/1737584599847334066
7/
Here's the full PMC Dashboard for Dec 25 to Jan 22.
You can read the full report here:
Thank you for your continued questions, suggestions, gratitude, infographics, videos, & sharing across other platforms. pmc19.com/data/

Here's the full PMC Dashboard for Dec 25 to Jan 22.
You can read the full report here:
Thank you for your continued questions, suggestions, gratitude, infographics, videos, & sharing across other platforms. pmc19.com/data/

8/
If you're using the PMC dashboard to help others, please post your success stories, infographics, photos, videos, and more in the following Tweet.
We will make awards at the end of the year. The examples are inspirational.
If you're using the PMC dashboard to help others, please post your success stories, infographics, photos, videos, and more in the following Tweet.
We will make awards at the end of the year. The examples are inspirational.
https://twitter.com/michael_hoerger/status/1732517951993979376
• • •
Missing some Tweet in this thread? You can try to
force a refresh


