
Indian Railways looking to acquire new trains worth ₹1 Lakh Cr over next few years
A Thread covering 8 Stocks 🧵
A Thread covering 8 Stocks 🧵

#IRCTC
Accumulate near 760-800 area for best RR
Stoploss near 740
Stage 1 breakout after 2 years consolidation
Accumulate near 760-800 area for best RR
Stoploss near 740
Stage 1 breakout after 2 years consolidation

#TEXMACO
Retest area near 160
Stoploss below 150
HH HL structure Uptrend
Stock is strong and looks good for further uptrend
Retest area near 160
Stoploss below 150
HH HL structure Uptrend
Stock is strong and looks good for further uptrend

#HBL POWER
Stock in clear uptrend in daily time frame
Looks extended in Weekly charrts
Short term hold till above 21 ema
Stock in clear uptrend in daily time frame
Looks extended in Weekly charrts
Short term hold till above 21 ema

#IRCON
Stoploss below 155
Stock in clear uptrend , has some shakeouts
Recent volume on downdays was more hence a concern
Stoploss below 155
Stock in clear uptrend , has some shakeouts
Recent volume on downdays was more hence a concern

#JupiterWagons
Excllent structure
Good volatility contraction pattern seen
Wait for breakout above 350 with sl near 300
Best Stock at cmp and good upside potential
Excllent structure
Good volatility contraction pattern seen
Wait for breakout above 350 with sl near 300
Best Stock at cmp and good upside potential

#Railtel
Continuation breakout seen
Stock above 21 ema
Stoploss below retest area
Continuation breakout seen
Stock above 21 ema
Stoploss below retest area

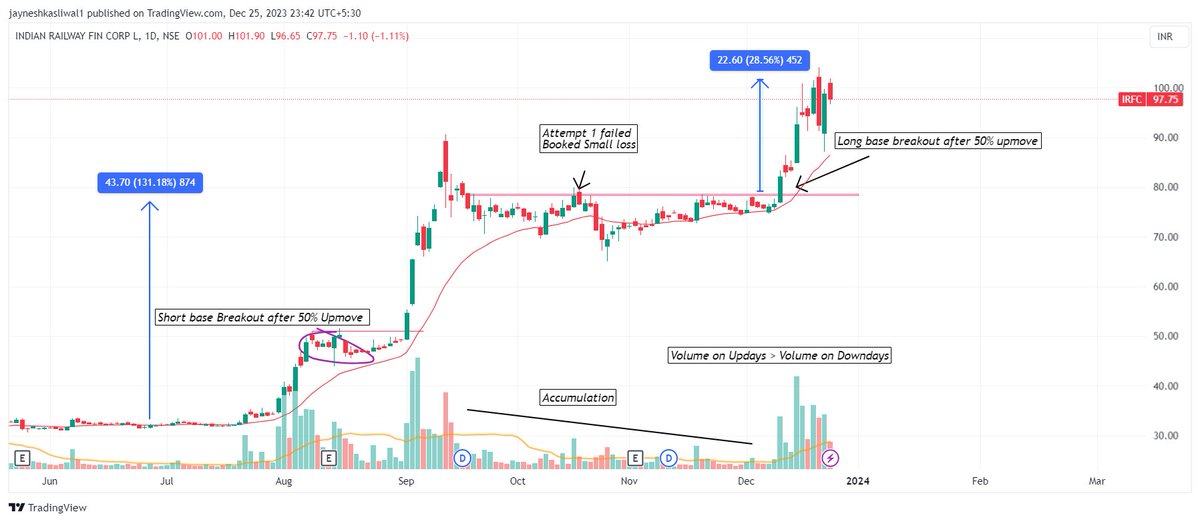
#IRFC
Detailed Analysis Shared before the breakout as well
Excellent consolidarion before breakout
Wait for new base formation for entering again
Detailed Analysis Shared before the breakout as well
Excellent consolidarion before breakout
Wait for new base formation for entering again
#RVNL
After breakout whole market reversed hence some weakness seen
One can keep holding it for further gains if holding from lower levels unless 150 swing breaks
Excllent HH HL structure on weekly as well
After breakout whole market reversed hence some weakness seen
One can keep holding it for further gains if holding from lower levels unless 150 swing breaks
Excllent HH HL structure on weekly as well


Its a wrap !
For more such detailed analysis join telegram channel telegram.me/Techno_charts
For more such detailed analysis join telegram channel telegram.me/Techno_charts
Follow @JayneshKasliwal for weekly stock updates and algo trading tips for making passive income from stock market !
• • •
Missing some Tweet in this thread? You can try to
force a refresh


