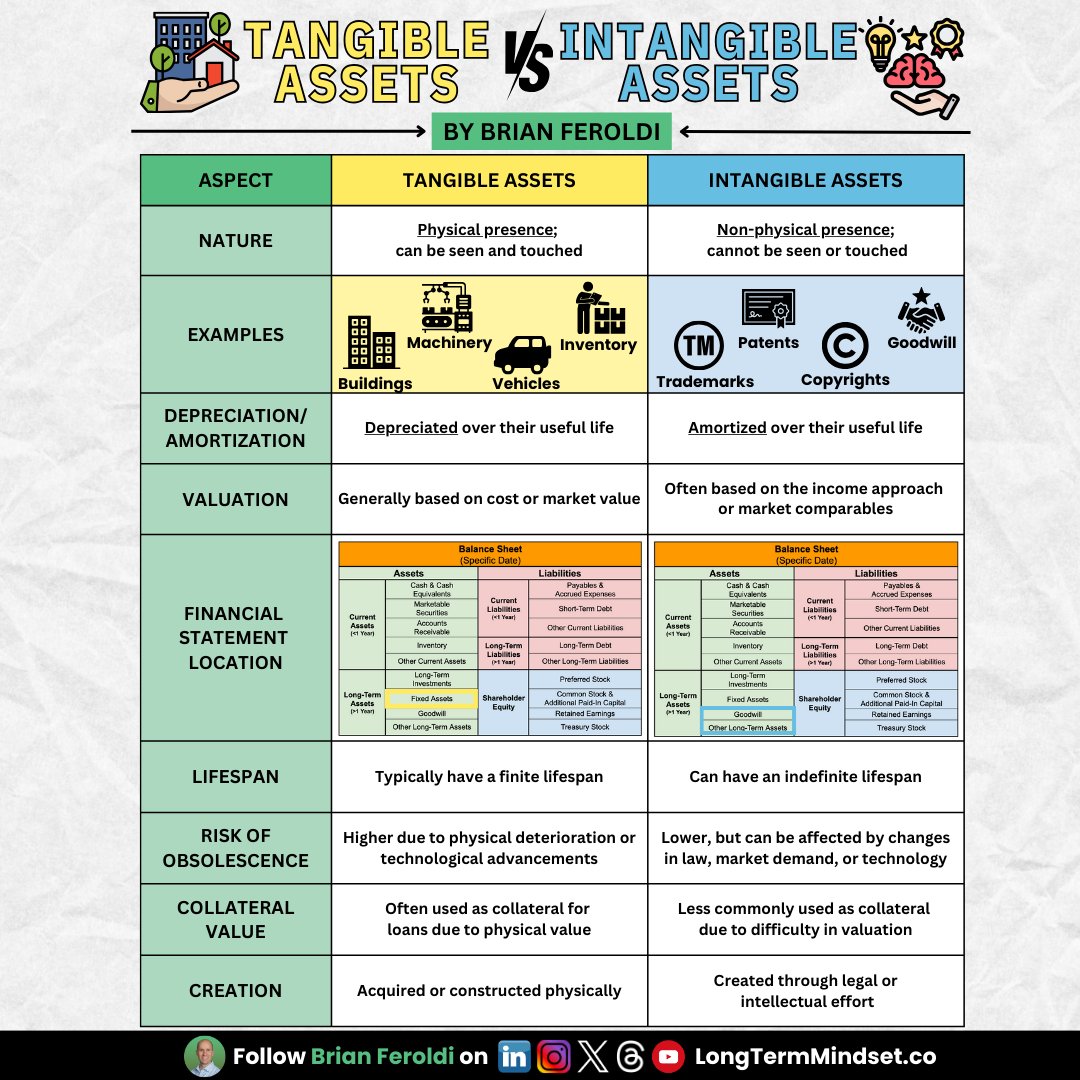
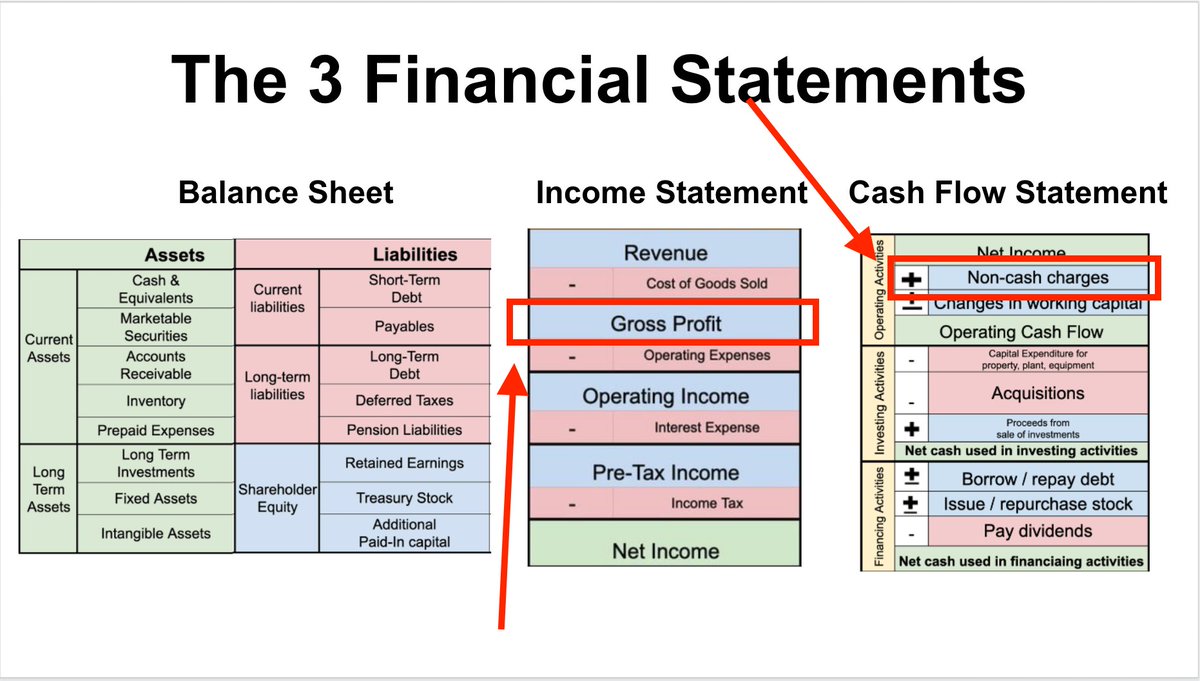
1: Gross Margin
🧮 Equation: Gross Profit / Revenue
👍 Rule of Thumb: 40% or higher
🤔 Buffett's Logic: A consistently high gross margin signals that the company isn’t competing exclusively on price.
🧮 Equation: Gross Profit / Revenue
👍 Rule of Thumb: 40% or higher
🤔 Buffett's Logic: A consistently high gross margin signals that the company isn’t competing exclusively on price.

2: SG&A Margin
🧮 Equation: SG&A Expense / Gross Profit
👍 Rule of Thumb: 30% or lower
🤔 Buffett's Logic: Wide-moat companies don’t need to spend a lot on overhead to operate & convince consumers to buy.
🧮 Equation: SG&A Expense / Gross Profit
👍 Rule of Thumb: 30% or lower
🤔 Buffett's Logic: Wide-moat companies don’t need to spend a lot on overhead to operate & convince consumers to buy.

3: R&D Margin
🧮 Equation: R&D Expense / Gross Profit
👍 Rule of Thumb: 30% or lower
🤔 Buffett's Logic: R&D expenses don't always create value for shareholders. Buffett doesn't want to own companies that need to invent the next great product to do well.
🧮 Equation: R&D Expense / Gross Profit
👍 Rule of Thumb: 30% or lower
🤔 Buffett's Logic: R&D expenses don't always create value for shareholders. Buffett doesn't want to own companies that need to invent the next great product to do well.

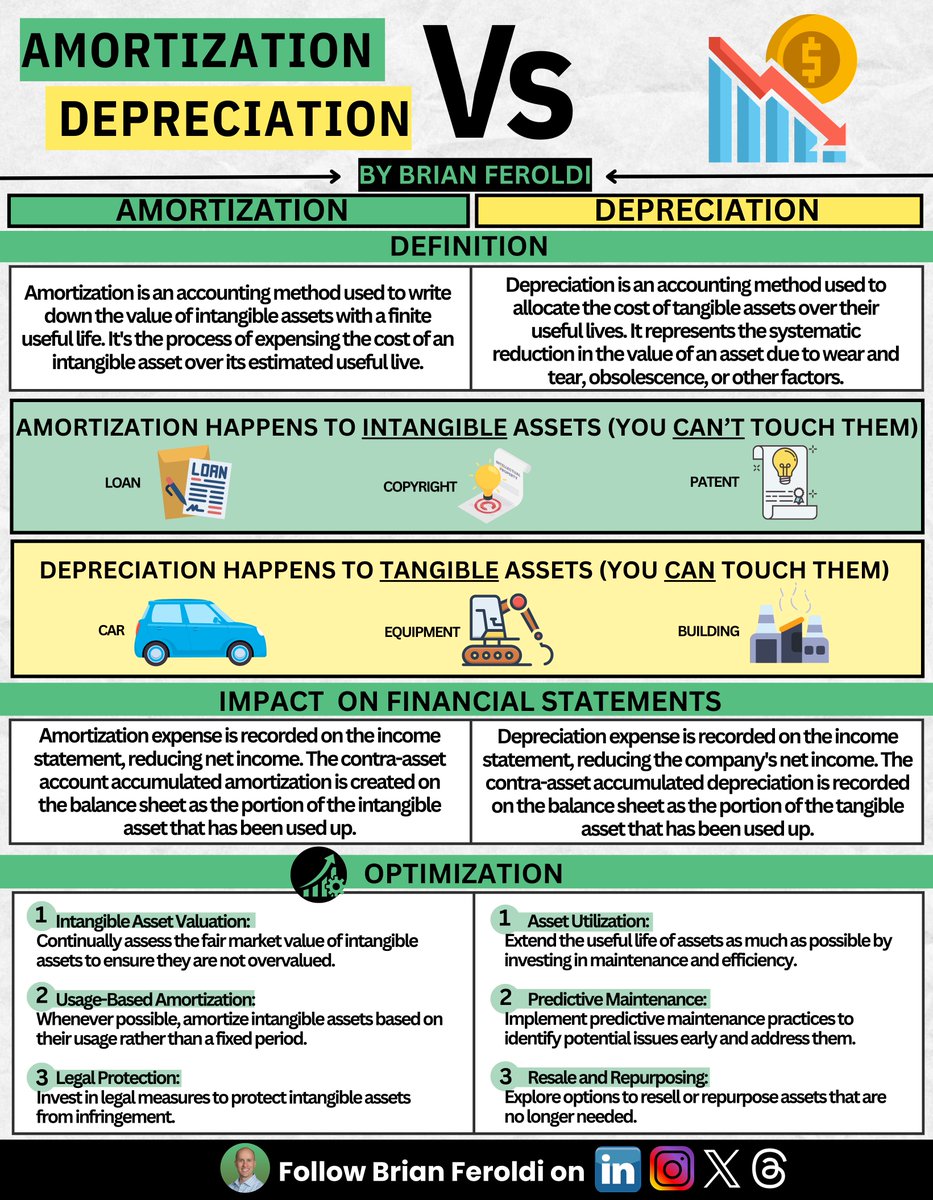
4: Depreciation Margin
🧮 Equation: Depreciation / Gross Profit
👍 Rule of Thumb: 10% or lower
🤔 Buffett's Logic: Buffett doesn't like businesses that constantly need to invest in depreciating assets to maintain their competitive advantage.
🧮 Equation: Depreciation / Gross Profit
👍 Rule of Thumb: 10% or lower
🤔 Buffett's Logic: Buffett doesn't like businesses that constantly need to invest in depreciating assets to maintain their competitive advantage.
5: Interest Expense Margin
🧮 Equation: Interest Expense / Operating Income
👍 Rule of Thumb: 15% or lower
🤔 Buffett's Logic: Great businesses have such incredible economics that they don’t need debt to finance themselves.
🧮 Equation: Interest Expense / Operating Income
👍 Rule of Thumb: 15% or lower
🤔 Buffett's Logic: Great businesses have such incredible economics that they don’t need debt to finance themselves.

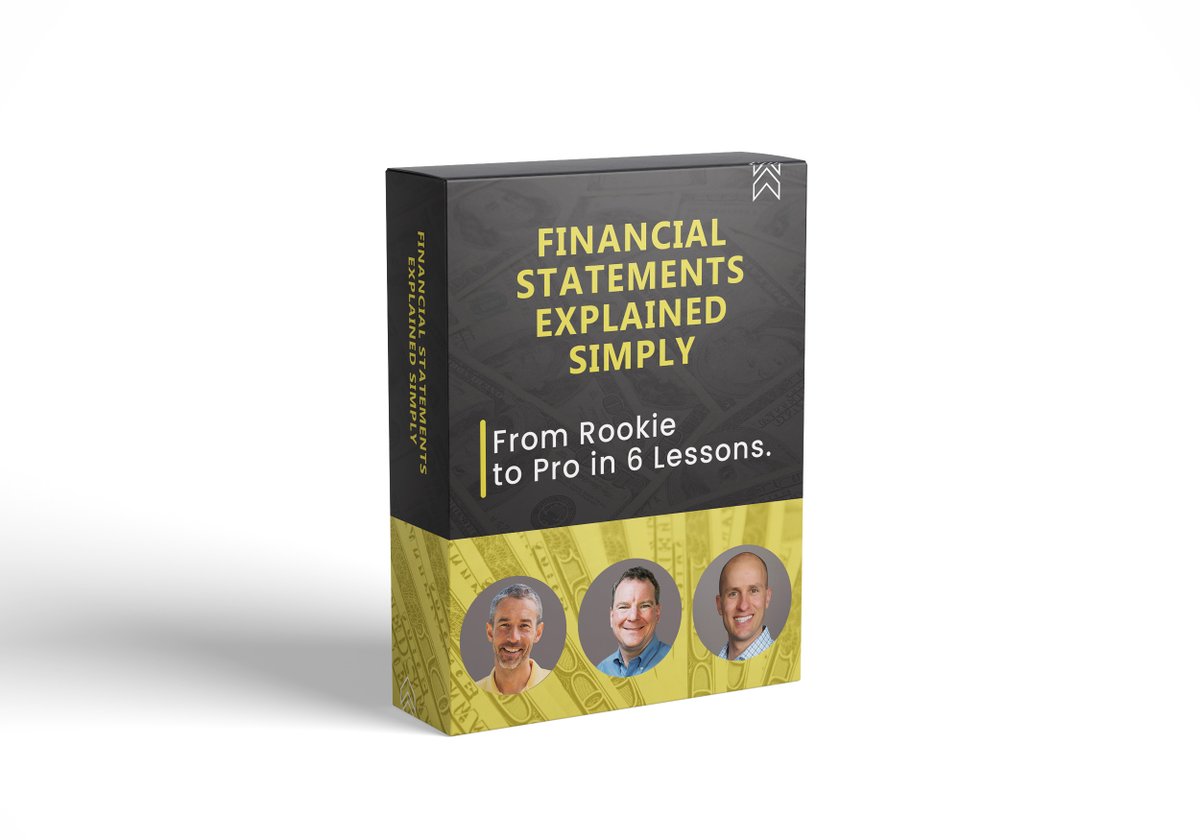
If you're enjoying this thread, you'll love my cohort-based course starting next week, Financial Statements Explained Simply
DM me for a coupon code:
maven.com/brian-feroldi/…

DM me for a coupon code:
maven.com/brian-feroldi/…
6: Income Tax Expenses
🧮 Equation: Taxes Paid / Pre-Tax Income
👍 Rule of Thumb: Current Corporate Tax Rate
🤔 Buffett's Logic: Great businesses make so much money that they are consistently forced to pay their full share of taxes.
🧮 Equation: Taxes Paid / Pre-Tax Income
👍 Rule of Thumb: Current Corporate Tax Rate
🤔 Buffett's Logic: Great businesses make so much money that they are consistently forced to pay their full share of taxes.

7: Net Margin (Profit Margin)
🧮 Equation: Net Income / Sales
👍 Rule of Thumb: 20% or higher
🤔 Buffett's Logic: Companies that consistently convert 20% of their revenue into net income are more likely to have a durable competitive advantage.
🧮 Equation: Net Income / Sales
👍 Rule of Thumb: 20% or higher
🤔 Buffett's Logic: Companies that consistently convert 20% of their revenue into net income are more likely to have a durable competitive advantage.

8: Earnings Per Share Growth
🧮 Equation: Year 2 EPS / Year 1 EPS
👍 Rule of Thumb: Positive & Growing
🤔 Buffett's Logic: Great companies consistently generate profits and increase them every year regardless of the operating environment.
🧮 Equation: Year 2 EPS / Year 1 EPS
👍 Rule of Thumb: Positive & Growing
🤔 Buffett's Logic: Great companies consistently generate profits and increase them every year regardless of the operating environment.
Caveats:
1: These “rules of thumb” are only useful when a company is mature and fully optimized for profits (stage 4/5).
2: CONSISTENCY is key.
3: There are PLENTY of exceptions & nuances to these rules.
1: These “rules of thumb” are only useful when a company is mature and fully optimized for profits (stage 4/5).
2: CONSISTENCY is key.
3: There are PLENTY of exceptions & nuances to these rules.

Want to dive deeper into financial statements?
Send me a DM if you're interested in a coupon code for Financial Statements Explained Simply:
twitter.com/messages/compo…
Send me a DM if you're interested in a coupon code for Financial Statements Explained Simply:
twitter.com/messages/compo…
Follow me @BrianFeroldi for more content like this.
I demystify finance with 1-2 threads each week.
Want to share? Retweet the first tweet below:
I demystify finance with 1-2 threads each week.
Want to share? Retweet the first tweet below:
https://twitter.com/61558281/status/1743246785705852944
• • •
Missing some Tweet in this thread? You can try to
force a refresh


