Jeff Gilchrist Profile picture
Jan 6 22 tweets 7 min read Read on X
#Variant update for #Ontario, #Canada (to Dec. 26, 2023)

The BA.2.86.* #Pirola clan of variants is now the majority of sequences at 56%. JN.1 Pirola has taken 1st place at 38% with HV.1 "Eris" down to 18%. The next closest is JG.3.2 "Eris" at 7%. Graph tools by @Mike_Honey_🧵1/

Sankey graph (height of each bar is # of sequences for that variant) showing top variants and their lineages over the past couple of months from PCR test genomic sequencing in Ontario, Canada. Visualization tool was created by @Mike_Honey_ ( https://app.powerbi.com/view?r=eyJrIjoiNzE5YzczODItMDQzMS00M2EzLWFjNWYtMjg3OTY3NTNhZDM3IiwidCI6ImRjMWYwNGY1LWMxZTUtNDQyOS1hODEyLTU3OTNiZTQ1YmY5ZCIsImMiOjEwfQ%3D%3D&pageName=ReportSection32240d6b62ba73667e98 )
Graph of top 7 COVID variant clans from PCR test genomic sequencing in Ontario, Canada. Visualization tool was created by @Mike_Honey_ ( https://app.powerbi.com/view?r=eyJrIjoiNzE5YzczODItMDQzMS00M2EzLWFjNWYtMjg3OTY3NTNhZDM3IiwidCI6ImRjMWYwNGY1LWMxZTUtNDQyOS1hODEyLTU3OTNiZTQ1YmY5ZCIsImMiOjEwfQ%3D%3D
Graph of top 7 COVID variants (JN.1, HV.1, JG.3.2, HV.1.6.1, HK.3, JD.1.1.1, JD.1.1) from PCR test genomic sequencing in Ontario, Canada. Visualization tool was created by @Mike_Honey_ ( https://app.powerbi.com/view?r=eyJrIjoiNzE5YzczODItMDQzMS00M2EzLWFjNWYtMjg3OTY3NTNhZDM3IiwidCI6ImRjMWYwNGY1LWMxZTUtNDQyOS1hODEyLTU3OTNiZTQ1YmY5ZCIsImMiOjEwfQ%3D%3D )
You can find weekly Ontario stats including variants at ( ) and ( ). 2/covid.gilchrist.ca/Ontario.html
gilchrist.great-site.net/jeff/COVID-19/…
Public Health Ontario got rid of their COVID data tool and replaced it with a respiratory virus tool making some of the previously reported data no longer available. 3/
They are now using the "viral season" calendar instead of year and only producing hospitalization rates by age group for entire viral seasons. I finally got around to making these stats (along with death rate). 4/
You can see that ever since the first Omicron BA.1 variant arrived in January 2022 that hospitalization rates for our youngest children (< 1) are higher or similar to older adults 60-79. 5/ Graph of % Share of Hospitalizations per 100,000 population for COVID-19 in Ontario by Age group from 2019-20 to 2023-24. Image from: http://covid.gilchrist.ca/Ontario.html
This viral season to date children < 1 years old are being hospitalized for COVID at a rate of 50.8 per 100,000 population, almost the same as adults 60-79 are 52.8 per 100k population. 6/ Graph of # of Hospitalizations per 100,000 population for COVID-19 in Ontario by Age group for 2023-24. Image from: http://covid.gilchrist.ca/Ontario.html
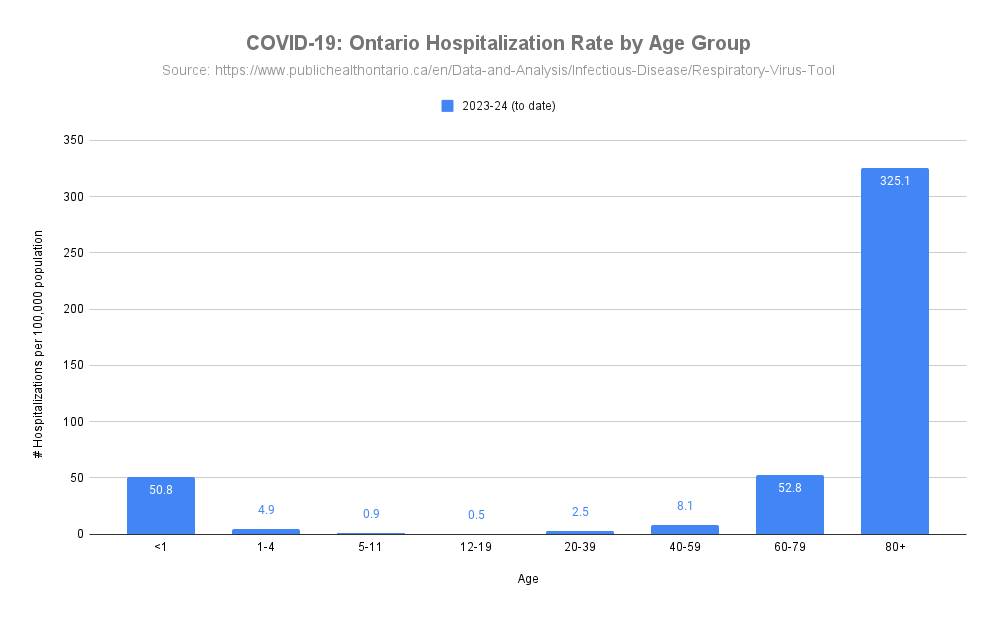
Adults 80+ are being hospitalized 6x more than those aged 60-79 and children aged 1-4 are being hospitalized almost 10x more than teens 12-19. 7/
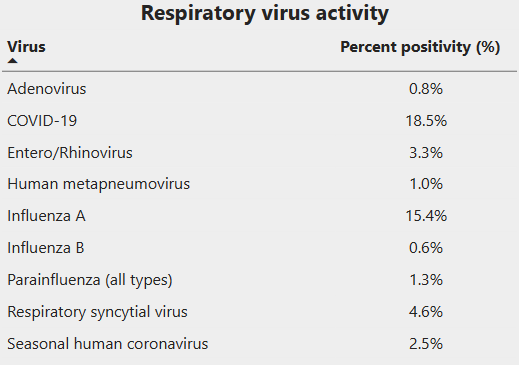
Now that PHO is updating their data again after the holidays, we can see that RSV positivity has gone down a lot (4.6%) while Flu A has increased significantly (15.4%) but COVID-19 remains in the lead (18.5%) ( ). 8/ publichealthontario.ca/en/Data-and-An…
Table showing percentage positivity of respiratory virus activity in Ontario with COVID-19 at 18.5% positivity, Influenza at 15.4% (A) & 0.6% (B) positivity, with RSV in third at 4.6% positivity. Table from: https://www.publichealthontario.ca/en/Data-and-Analysis/Infectious-Disease/Respiratory-Virus-Tool
There are a lot of people who are sick right now, and with multiple viruses circulating if you get a negative result on a rapid test (RAT) it might be tempting to think you only have a cold. 9/
It is important to remember a recent study found that half of people's COVID-19 viral loads peaked on day 4 of symptoms so you may not test positive on a rapid test in the first few days ( ). 10/cidrap.umn.edu/covid-19/evolv…
Recall that rapid tests do not amplify the virus like PCR tests so they will only test positive after you have a high viral load which may take several days to get to while your symptoms are from your immune response which can start right away even when viral loads are low. 11/
When a rapid test is positive it is almost always correct so assume you have COVID-19, but if it is negative there are many ways to get a false negative so RATs cannot be used to rule out a virus infection ( ). 12/
If you do test positive for COVID-19 or suspect you might be infected, the Salisbury Hospital advises that mouth/oral care is very important as research has demonstrated the mouth is a reservoir for the virus and a site where it replicates. 13/ Salisbury Hospital COVID-19 Mouth Care Guidance recommending to drink plenty of fluids throughout the day, do not allow your mouth to dry out, keep your mouth healthy and clean, brush your teeth last thing at night, spit don't rinse, use mouthwash at a different time from brushing, wait 30 minutes after using mouthwash before eating or drinking. Image from: https://patientinfo.microguide.global/SALIS/PIL1#content,1f6fad6a-c374-4517-9c58-6256ef6a99e9
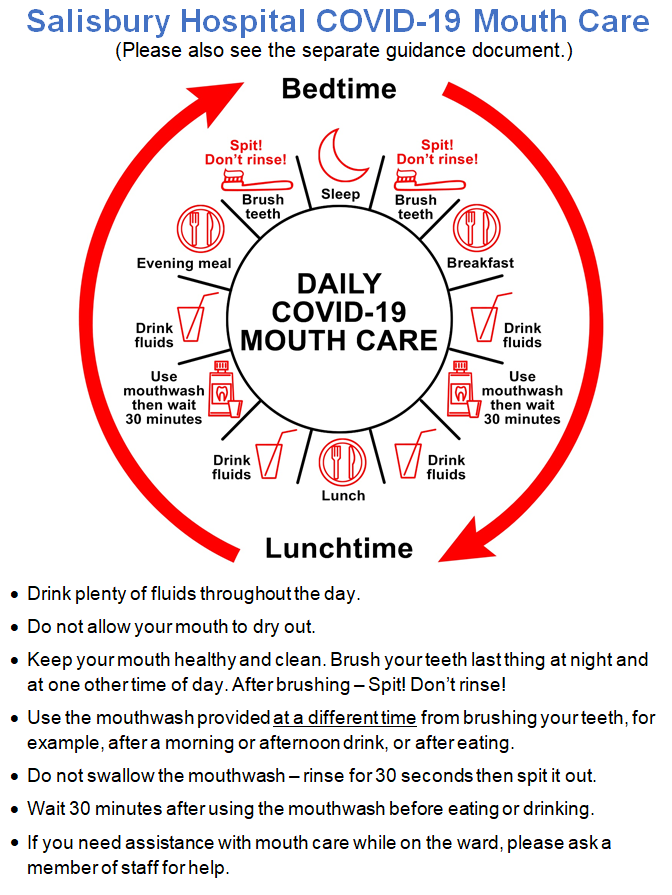
Research also suggests the virus could pass from saliva into the blood vessels of the mouth and travel to the lungs or heart via the bloodstream. The COVID-19 mouth care guide available from Salisbury Hospital here ( ). 14/patientinfo.microguide.global/SALIS/PIL1#con…
People need to be careful to understand what kind of statistics are being made available by their governments and their context. It seems Alberta is now using different criteria for reporting their COVID and RSV/Flu hospitalization and ICU rates ( ). 15/
Alberta only reports COVID numbers if it was the primary or contributing cause while influenza and RSV numbers include incidental hospitalizations which means that numbers will be much higher than if they used the same criteria as COVID and are not directly comparable. 16/
The visualization tool for variants was created by @Mike_Honey_ ( ). 17/app.powerbi.com/view?r=eyJrIjo…
To learn how to see what variants are circulating in your area, please read this guide ( ). 18/
@threadreaderapp please unroll
@BarryHunt008 so Pirola clan is more than 50% in Ontario now, and just JN.1 is in top place at 38% on Dec. 26, 2023.
I forgot to include the link to the latest mouth guide here ( ) and here is the thread discussing the importance of mouth care ( ). 19/salisbury.nhs.uk/coronavirus/co…
Also additional details about the Oral-Vascular-Pulmonary Infection Route: a Pathogenic Mechanism Linking Oral Health Status to Acute and Post-Acute COVID-19 ( ). 20/

• • •

Missing some Tweet in this thread? You can try to force a refresh
 

Keep Current with Jeff Gilchrist

Jeff Gilchrist Profile picture

Stay in touch and get notified when new unrolls are available from this author!

Read all threads

This Thread may be Removed Anytime!

PDF

Twitter may remove this content at anytime! Save it as PDF for later use!

Try unrolling a thread yourself!

how to unroll video
  1. Follow @ThreadReaderApp to mention us!

  2. From a Twitter thread mention us with a keyword "unroll"
@threadreaderapp unroll

Practice here first or read more on our help page!

More from @jeffgilchrist

Jan 8
#Virus update for Ottawa, #Canada (Jan 8, 2024)

#Wastewater levels in #Ottawa are extremely high and rising again with the JN.1 #Pirola variant now the most prevalent. #Hospitalization *for* #COVID-19 started declining just before the holidays but is increasing again.🧵1/
Graph of wastewater levels in Ottawa, Ontario. Weekly stats available at ( http://covid.gilchrist.ca/Ottawa.html )
Graph of # of people currently hospitalized *for* COVID-19 in Ottawa, Ontario. Weekly stats available at ( http://covid.gilchrist.ca/Ottawa.html )
Our young children are especially vulnerable to respiratory virus infections. In Ottawa, despite children age 0-11 only making up 11% of the population, they accounted for 46% of respiratory related Emergency Department visits the week of Dec. 24 ( ). 2/ ottawapublichealth.ca/en/reports-res…
Graph showing % of total respiratory related ED visits by week in Ottawa, Ontario with children <12 making up almost 50% of all visits despite being only 11% of the population. Weekly stats available at ( http://covid.gilchrist.ca/Ottawa.html )
RSV levels in Ottawa wastewater were declining but now seeing another increase, but Influenza A levels increased quickly and are now twice the peak of last year already. Influenza B is now being detected in very small amounts. 3/ Graph showing RSV levels decreased, Influenza A levels very high and low Influenza B wastewater levels in Ottawa, Ontario. Weekly stats available at ( http://covid.gilchrist.ca/Ottawa.html )
Read 12 tweets
Jan 3
Particulate Matter (PM) pollution event happening in Ontario and Quebec right now!

It seems PM levels have risen a lot overnight and whatever this event is stretches from southern Ontario (Toronto) to Ottawa to Montreal. Read more about the Model X and how I measured this below.
Graph from co2.click portal showing the last 24 hours of particulate matter (PM) 1.0, 2.5, 4.0, and 10 levels in Ottawa measured with a Model X outdoor air quality monitor. More info at: https://co2.click/
Table of Contents and link to unrolled version of outdoor particulate matter (PM) air quality monitoring here ( ).
It is not just outside pollution you need to worry about, cooking inside can also generate PM pollution which you can see some examples here ( ).
Read 8 tweets
Dec 31, 2023
2023 in Review

In case you missed them the first time, I'm looking back at what I thought were the most educational threads that I wrote over the past year starting with the oldest. 🧵1/ Image of person turning wooden 2023 blocks over to 2024. Image from: https://pixevety.com/2023-a-year-in-review-navigating-challenges-embracing-innovation-and-shaping-the-future/
Why do people get (re)infected over and over again? COVID actively evades your immune system by suppressing parts of it to become invisible. Part 1 ( ) and Part 2 ( ). 2/
What actually happens inside your body when you are sick? It is important to understand your body and immune system. Part 1 ( ) and Part 2 ( ). 3/
Read 10 tweets
Dec 31, 2023
Outdoor Particulate Matter (#PM) Air Quality Monitoring

This thread explores the new Model X #outdoor PM air quality monitor made by #Canadian @IndianaTux at , what it does, costs, and examples showing the information it provides. #AQ #AirQuality 🧵1/ co2.click


Side profile photo of co2.click Model X outdoor air quality (AQ) monitor in weather resistant casing, along with a clip to help mount it to various locations. More info at: https://co2.click/
Graph from co2.click portal showing the last 48 hours of particulate matter (PM) 1.0, 2.5, 4.0, and 10 levels.
Graph of co2.click public view showing temperature, humidity, barometric pressure, and supported PM levels with 24 hour history graph. More info at: https://co2.click/
Screenshot of air quality map displaying results from co2.click monitors around the world. More info at: https://co2.click/
An unrolled one-page web view for this long thread that may be easier to read or share can be found here ( ). 2/
After all the major wildfire smoke events this past summer, I wanted to get an air quality monitor that was suitable for outdoors so I would be better informed what the PM levels were in my neighbourhood. 3/
Read 60 tweets
Dec 29, 2023
#Variant update for #Ontario, #Canada

The EG.5.* "Eris" clan of variants is close to going under 50% of sequences. JN.1 "Pirola" has taken 1st place at 27% with HV.1 "Eris" down to 20%. The next closest is JG.3.2 "Eris" at 10%. Graph tools by @Mike_Honey_ 🧵1/

Sankey graph (height of each bar is # of sequences for that variant) showing top variants and their lineages over the past couple of months from PCR test genomic sequencing in Ontario, Canada. Visualization tool was created by @Mike_Honey_ ( https://app.powerbi.com/view?r=eyJrIjoiNzE5YzczODItMDQzMS00M2EzLWFjNWYtMjg3OTY3NTNhZDM3IiwidCI6ImRjMWYwNGY1LWMxZTUtNDQyOS1hODEyLTU3OTNiZTQ1YmY5ZCIsImMiOjEwfQ%3D%3D&pageName=ReportSection32240d6b62ba73667e98 )
Graph of top 7 COVID variants (JN.1, HV.1, JG.3.2, HV.1.6.1, HK.3, JD.1.1.1, JD.1.1) from PCR test genomic sequencing in Ontario, Canada. Visualization tool was created by @Mike_Honey_ ( https://app.powerbi.com/view?r=eyJrIjoiNzE5YzczODItMDQzMS00M2EzLWFjNWYtMjg3OTY3NTNhZDM3IiwidCI6ImRjMWYwNGY1LWMxZTUtNDQyOS1hODEyLTU3OTNiZTQ1YmY5ZCIsImMiOjEwfQ%3D%3D )
Graph of BA.2.86.* Pirola clan with JN.1 variant taking off from PCR test genomic sequencing in Ontario, Canada. Visualization tool was created by @Mike_Honey_ ( https://app.powerbi.com/view?r=eyJrIjoiNzE5YzczODItMDQzMS00M2EzLWFjNWYtMjg3OTY3NTNhZDM3IiwidCI6ImRjMWYwNGY1LWMxZTUtNDQyOS1hODEyLTU3OTNiZTQ1YmY5ZCIsImMiOjEwfQ%3D%3D
While most government agencies are not updating any public health data this week, thankfully scientists, lab techs, and @Mike_Honey_ are still working hard to provide new PCR sequencing data so we have a better understanding of variants circulating. 2/
You can find weekly Ontario stats including variants at ( ).

The visualization tool for variants was created by @Mike_Honey_ ( ). 3/covid.gilchrist.ca/Ontario.html
app.powerbi.com/view?r=eyJrIjo…
Read 5 tweets
Dec 21, 2023
#Variant update for #Ontario, #Canada

The EG.5.* "Eris" clan of variants is still most prevalent but declining. HV.1 "Eris" is still 1st with 22% but dropping rapidly while JN.1 "Pirola" is 2nd at almost 15% and JG.3.2 "Eris" at 11%. Graph tools by @Mike_Honey_ 🧵1/

Sankey graph (height of each bar is # of sequences for that variant) showing top variants and their lineages over the past couple of months from PCR test genomic sequencing in Ontario, Canada. Visualization tool was created by @Mike_Honey_ ( https://app.powerbi.com/view?r=eyJrIjoiNzE5YzczODItMDQzMS00M2EzLWFjNWYtMjg3OTY3NTNhZDM3IiwidCI6ImRjMWYwNGY1LWMxZTUtNDQyOS1hODEyLTU3OTNiZTQ1YmY5ZCIsImMiOjEwfQ%3D%3D&pageName=ReportSection32240d6b62ba73667e98
Graph of top 7 COVID variants (HV.1, JN.1, JG.3.2, HK.3, JD.1.1.1, JD.1.1, JG.3) from PCR test genomic sequencing in Ontario, Canada. Visualization tool was created by @Mike_Honey_ ( https://app.powerbi.com/view?r=eyJrIjoiNzE5YzczODItMDQzMS00M2EzLWFjNWYtMjg3OTY3NTNhZDM3IiwidCI6ImRjMWYwNGY1LWMxZTUtNDQyOS1hODEyLTU3OTNiZTQ1YmY5ZCIsImMiOjEwfQ%3D%3D )
Graph of BA.2.86.* Pirola clan with JN.1 variant taking off from PCR test genomic sequencing in Ontario, Canada. Visualization tool was created by @Mike_Honey_ ( https://app.powerbi.com/view?r=eyJrIjoiNzE5YzczODItMDQzMS00M2EzLWFjNWYtMjg3OTY3NTNhZDM3IiwidCI6ImRjMWYwNGY1LWMxZTUtNDQyOS1hODEyLTU3OTNiZTQ1YmY5ZCIsImMiOjEwfQ%3D%3D
You can find weekly Ontario stats including variants at ( ).

The visualization tool for variants was created by @Mike_Honey_ ( ). 2/covid.gilchrist.ca/Ontario.html
app.powerbi.com/view?r=eyJrIjo…
To learn how to see what variants are circulating in your area, please read this guide ( ). 3/
Read 4 tweets

Did Thread Reader help you today?

Support us! We are indie developers!


This site is made by just two indie developers on a laptop doing marketing, support and development! Read more about the story.

Become a Premium Member ($3/month or $30/year) and get exclusive features!

Become Premium

Don't want to be a Premium member but still want to support us?

Make a small donation by buying us coffee ($5) or help with server cost ($10)

Donate via Paypal

Or Donate anonymously using crypto!

Ethereum

0xfe58350B80634f60Fa6Dc149a72b4DFbc17D341E copy

Bitcoin

3ATGMxNzCUFzxpMCHL5sWSt4DVtS8UqXpi copy

Thank you for your support!

Follow Us!

:(