I published a new study and it's a juicy one.
The establishment's theory of race differences in socially valued metrics is that this is due to "systemic racism", a kind of Marxist conspiracy theory where the dominant group (Whites) keeps other peoples down.

The establishment's theory of race differences in socially valued metrics is that this is due to "systemic racism", a kind of Marxist conspiracy theory where the dominant group (Whites) keeps other peoples down.


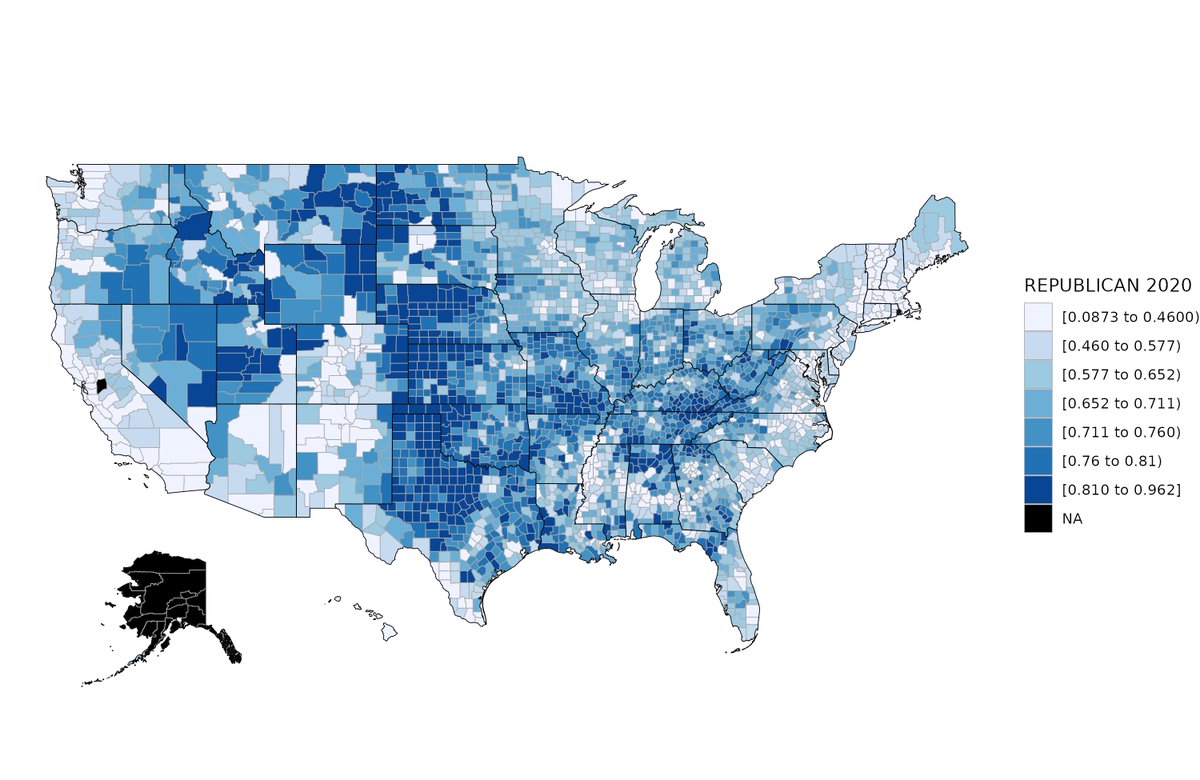
There are clear testable predictions from this theory. In places where racist, White people have more power, outcomes for non-Whites, especially Blacks and Hispanics should be worse. Recall that the US demographics by county look like this.
Of course, Republicans are racist in this theory.
Of course, Republicans are racist in this theory.

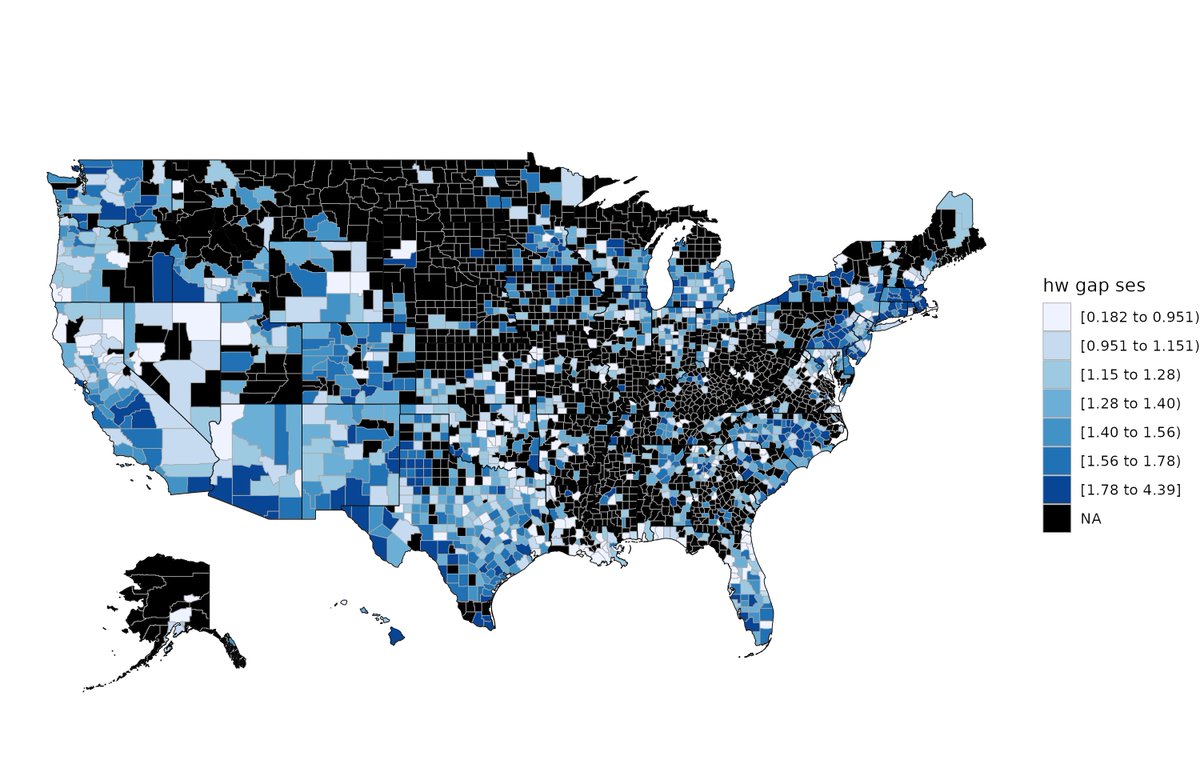
Thus, the theory predicts that in these areas of the USA, Blacks and Hispanics should be particularly worse off compared to Whites. But the exact opposite is actually true. The race gaps are smaller, not larger, in Whiter and more Republican areas.


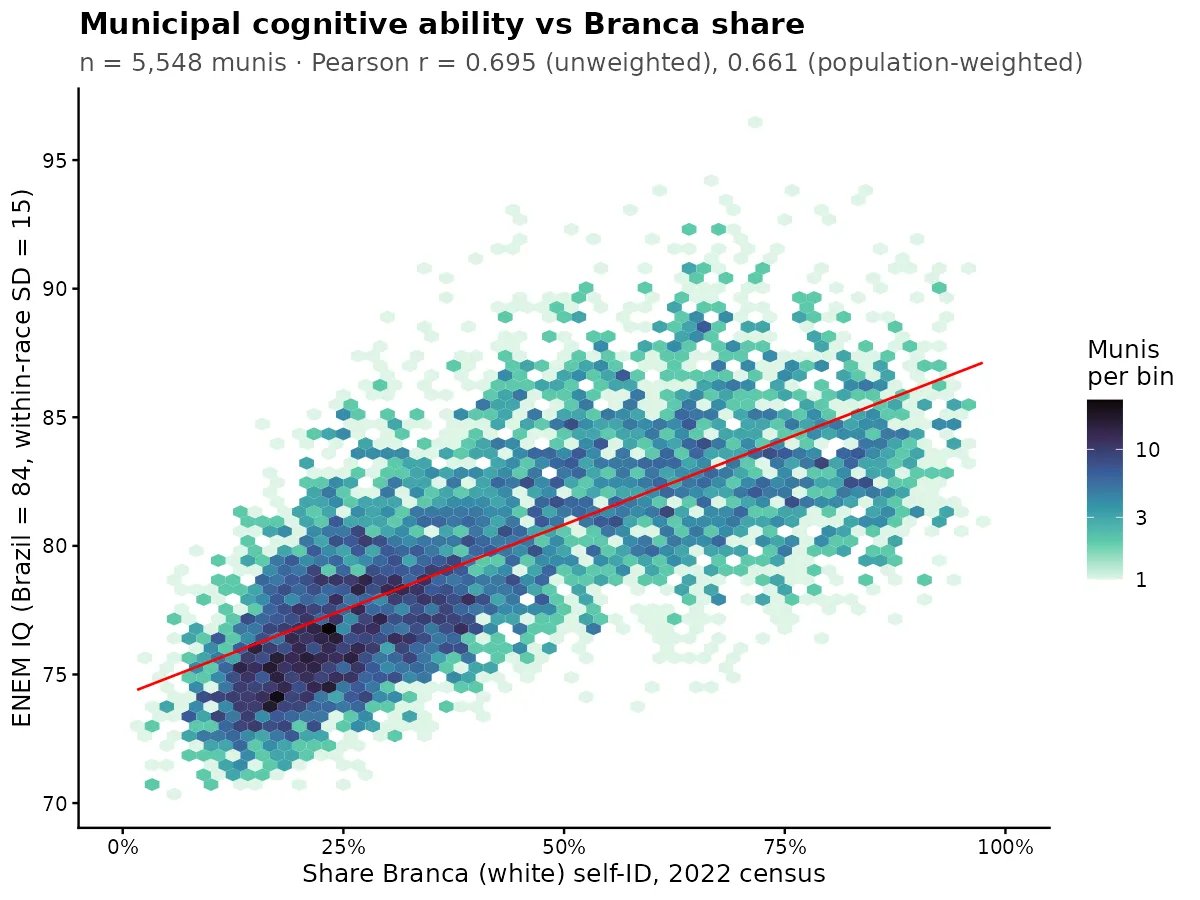
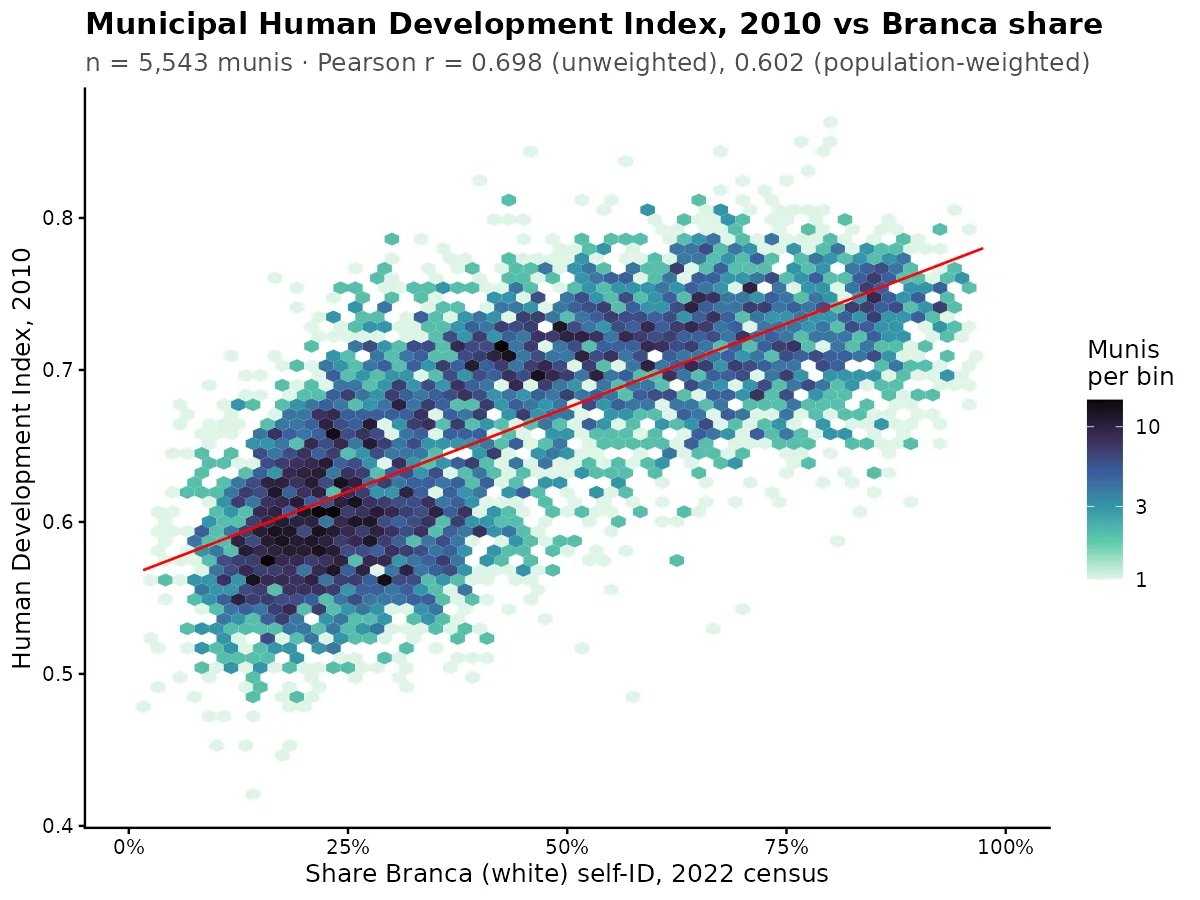
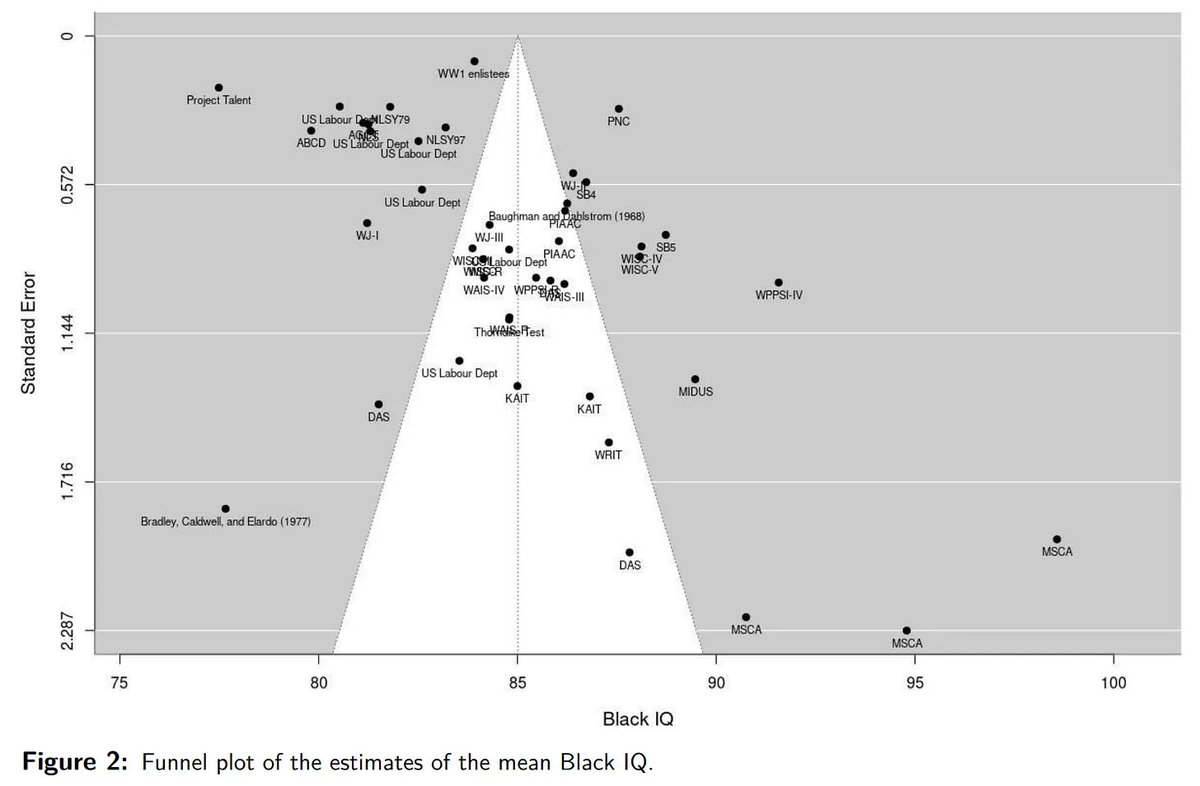
The above figures are for test score gaps, but the same holds true if we look at social status gaps. Here's some maps of race gaps in social status.

So we need another way to explain the variation in social status gaps. Well, it's easy. Test scores -- academic achievement that mainly reflecting intelligence -- explain why race gaps are smaller and larger in various locations. Meritocracy works.


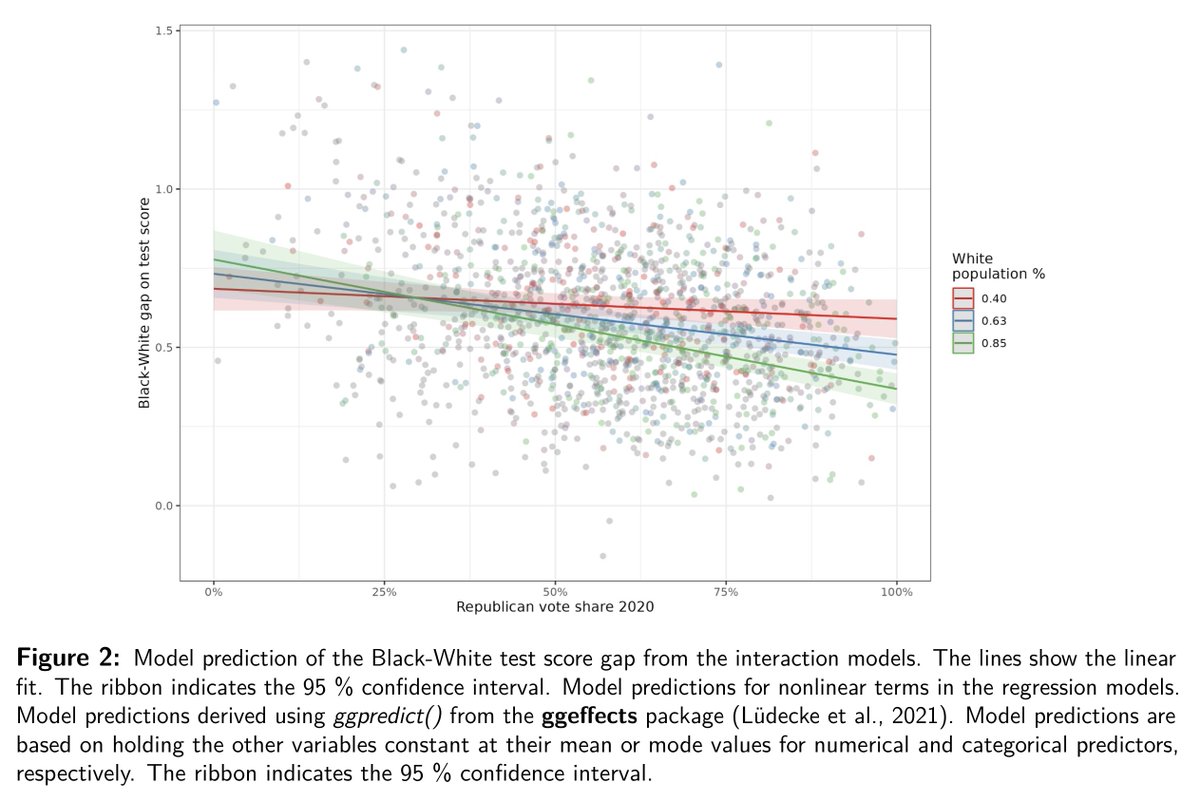
It gets even worse for the theory. It turns out the effect of White population share and Republican vote share are interactive. The areas with the smallest race gaps are the ones with the largest White populations and the largest Republican vote shares combined!

There we have it. The Marxist conspiracy theory that is the go-to explanation of race relations fails when we look at county-level variation across the United States. The predictions it makes are exactly opposite of reality. If anything, it seems Republican Whites are good for minorities.
If you want more details, read my new blog post:
New study out: Systemic Racism Does Not Explain Variation in Race Gaps on Cognitive Tests
emilkirkegaard.com/p/new-study-ou…
New study out: Systemic Racism Does Not Explain Variation in Race Gaps on Cognitive Tests
emilkirkegaard.com/p/new-study-ou…
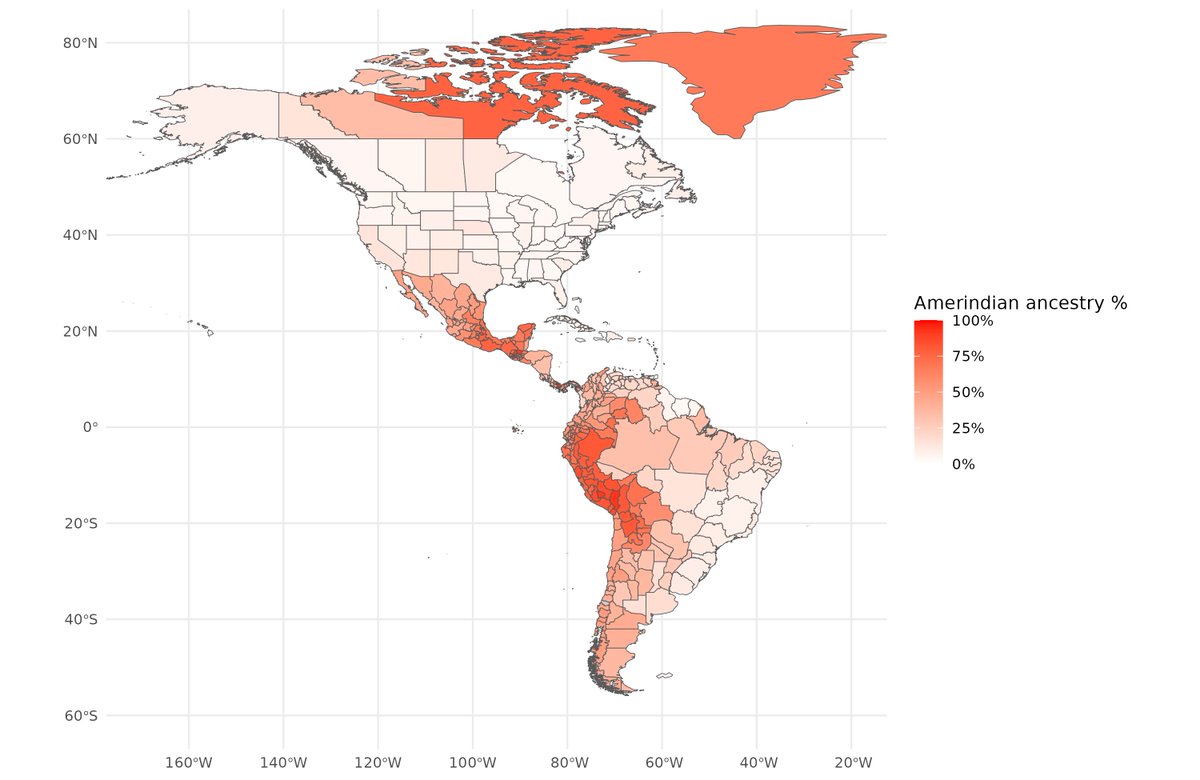
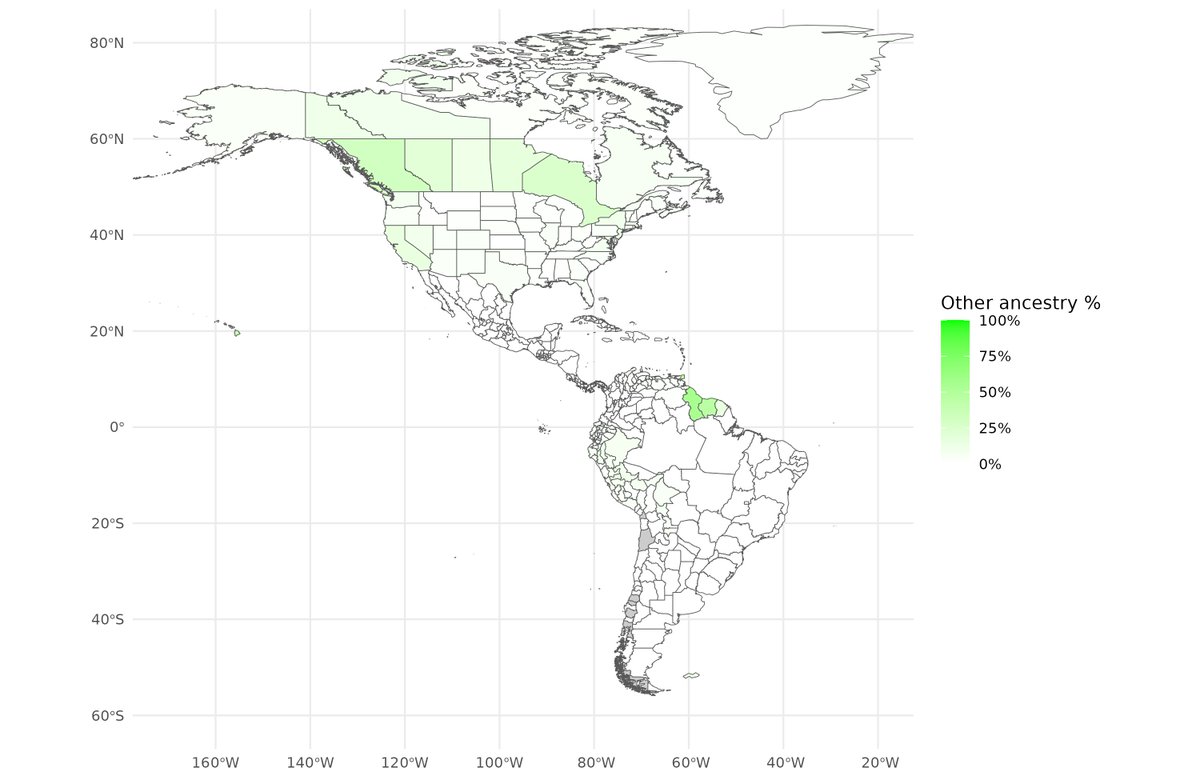
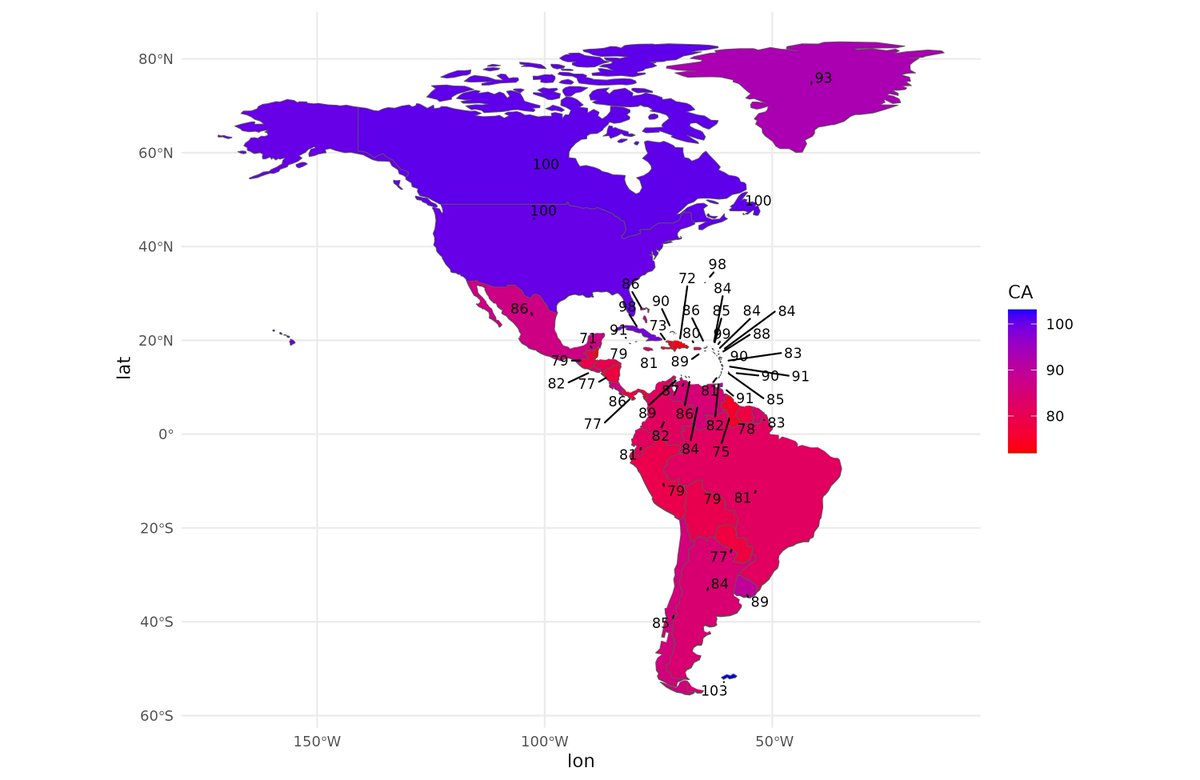
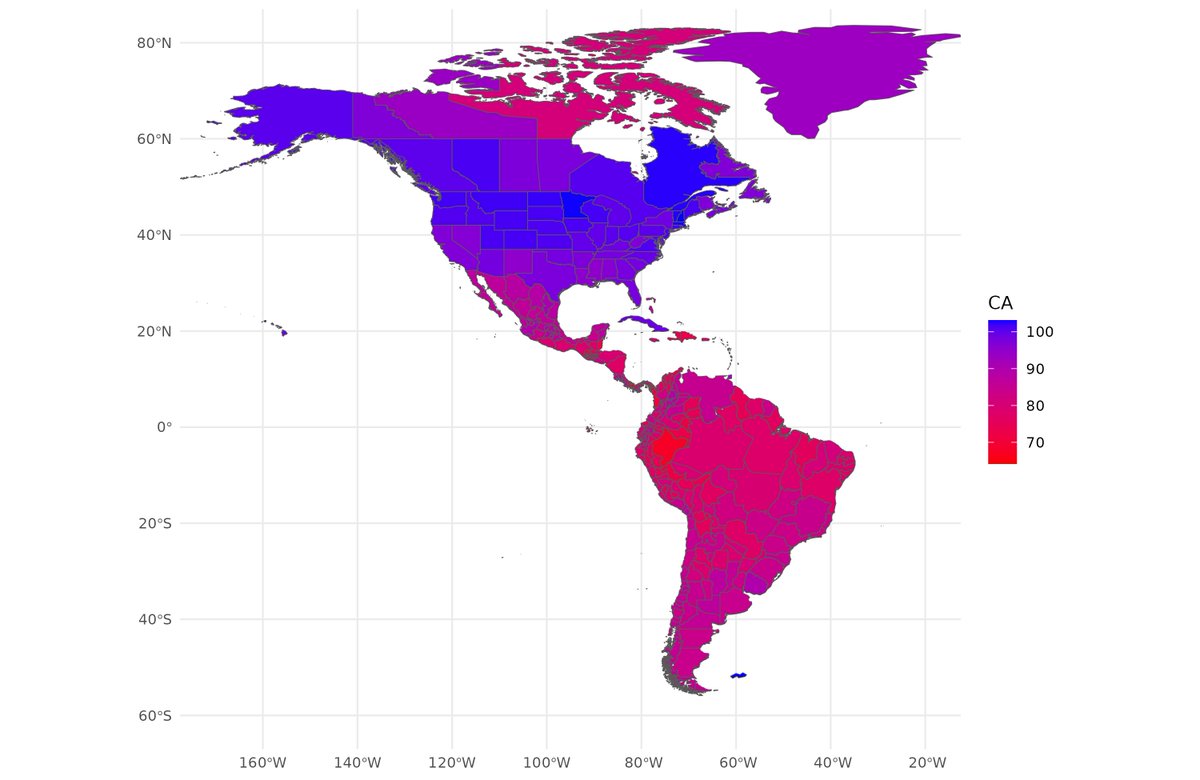
You can also download the data and R code yourself if you are more curious. There are many more figures and maps in the OSF repository.
osf.io/m8gs5/
osf.io/m8gs5/
• • •
Missing some Tweet in this thread? You can try to
force a refresh