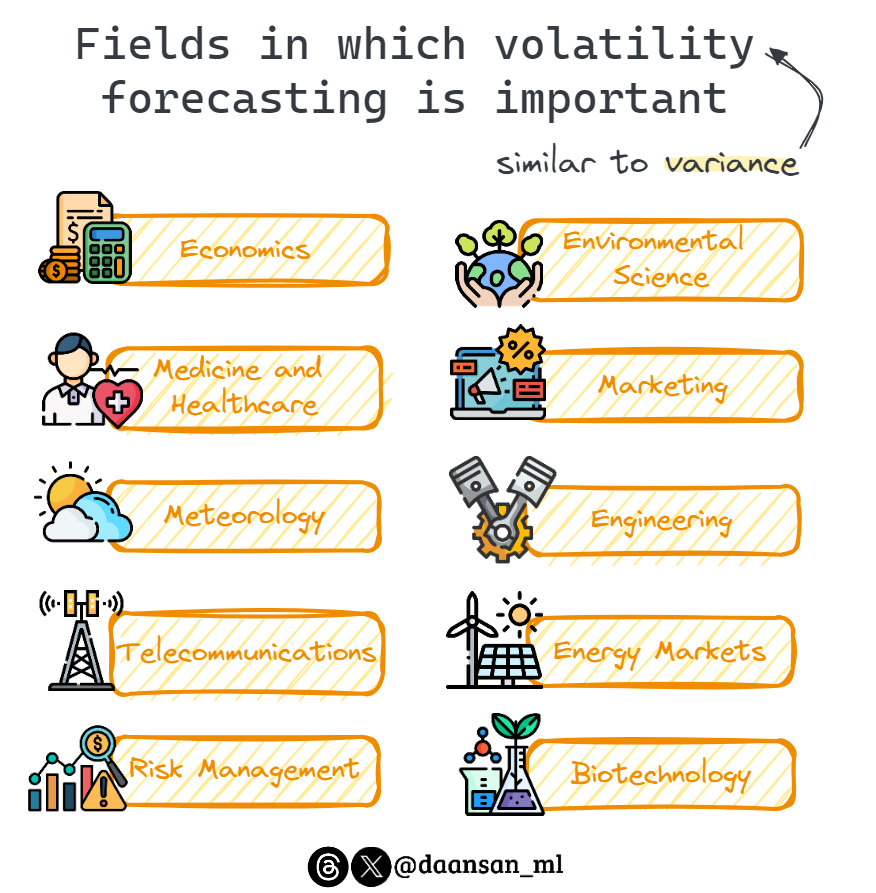
Do you want to forecast seasonal time series data?
Remove the seasonality and add it back at the end! That's basically what STL method does.
Remove the seasonality and add it back at the end! That's basically what STL method does.
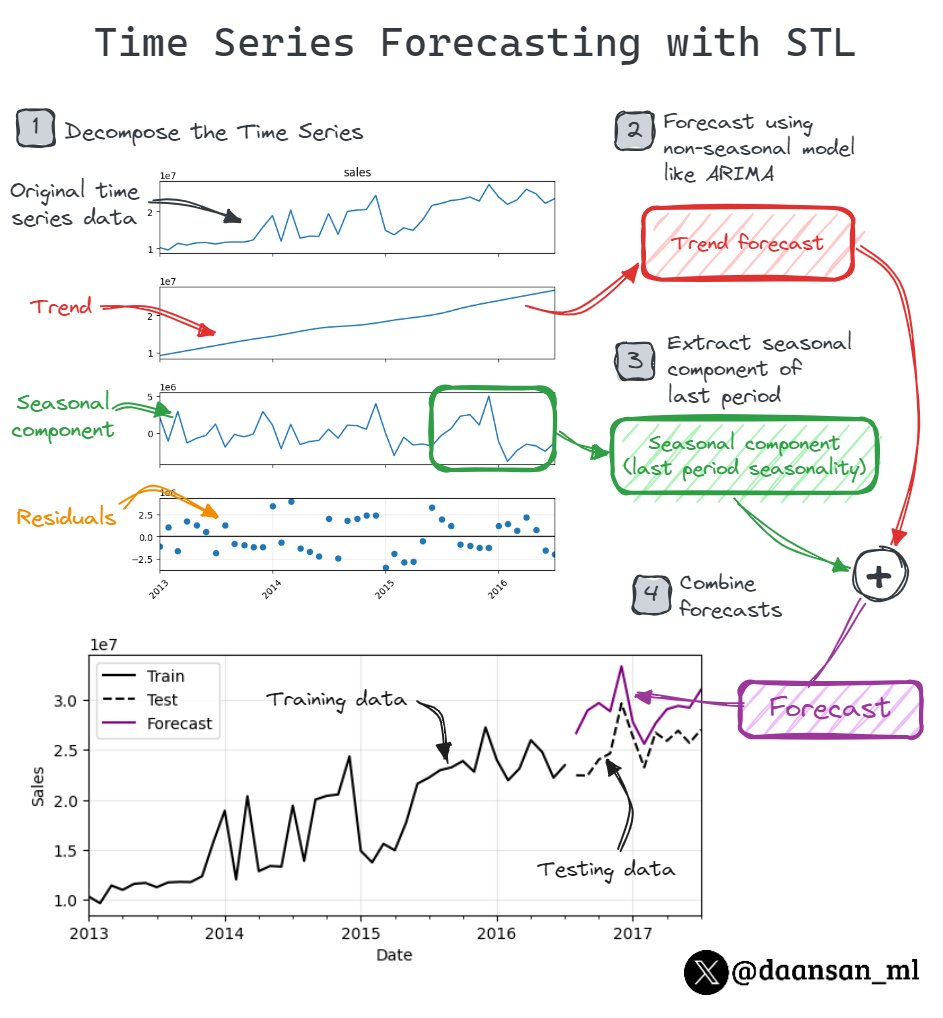
STL stands for “Seasonal and Trend decomposition using LOESS”. It is a versatile and robust method for decomposing time series.
It uses LOESS (Locally Estimated Scatterplot Smoothing) instead of Moving Average to extract the seasonal component.
It uses LOESS (Locally Estimated Scatterplot Smoothing) instead of Moving Average to extract the seasonal component.
1️⃣ Decompose the Time Series:
Utilize STL to split the time series into three parts:
• trend
• seasonal component
• residual component
Utilize STL to split the time series into three parts:
• trend
• seasonal component
• residual component
2️⃣ Deseasonalize:
Subtract the seasonal component from the main series, creating a deseasonalized version.
This will yield the trend with residuals, which are not just noise, they represent random or irregular fluctuations that are not captured by the trend or the seasonality.
Subtract the seasonal component from the main series, creating a deseasonalized version.
This will yield the trend with residuals, which are not just noise, they represent random or irregular fluctuations that are not captured by the trend or the seasonality.
3️⃣ Forecast Deseasonalized data:
Employ non-seasonal methods like ARIMA or Simple Exponential Smoothing to predict the trend and residuals in the deseasonalized data.
Employ non-seasonal methods like ARIMA or Simple Exponential Smoothing to predict the trend and residuals in the deseasonalized data.
4️⃣ Forecast Seasonality:
STL predicts future seasons by repeating the last observed season; for instance, last year's seasonal pattern for monthly data.
STL predicts future seasons by repeating the last observed season; for instance, last year's seasonal pattern for monthly data.
5️⃣ Reapply Seasonal Component:
Finally, incorporate the forecasted seasonal data back to the deseasonalized forecast, restoring it to the original scale.
That's how you can forecast your time series data using STL.
Finally, incorporate the forecasted seasonal data back to the deseasonalized forecast, restoring it to the original scale.
That's how you can forecast your time series data using STL.
You can learn more about this in the latest issue of MLPills💊
Read it here 👇
open.techwriters.info/mlpills/issue-…
Read it here 👇
open.techwriters.info/mlpills/issue-…
You should also join our newsletter, DSBoost🚀
Every week we share:
🔹Interviews
🔹Podcast notes
🔹Learning resources
🔹Interesting collections of content
Subscribe for free👇👇
dsboost.dev
Every week we share:
🔹Interviews
🔹Podcast notes
🔹Learning resources
🔹Interesting collections of content
Subscribe for free👇👇
dsboost.dev
• • •
Missing some Tweet in this thread? You can try to
force a refresh