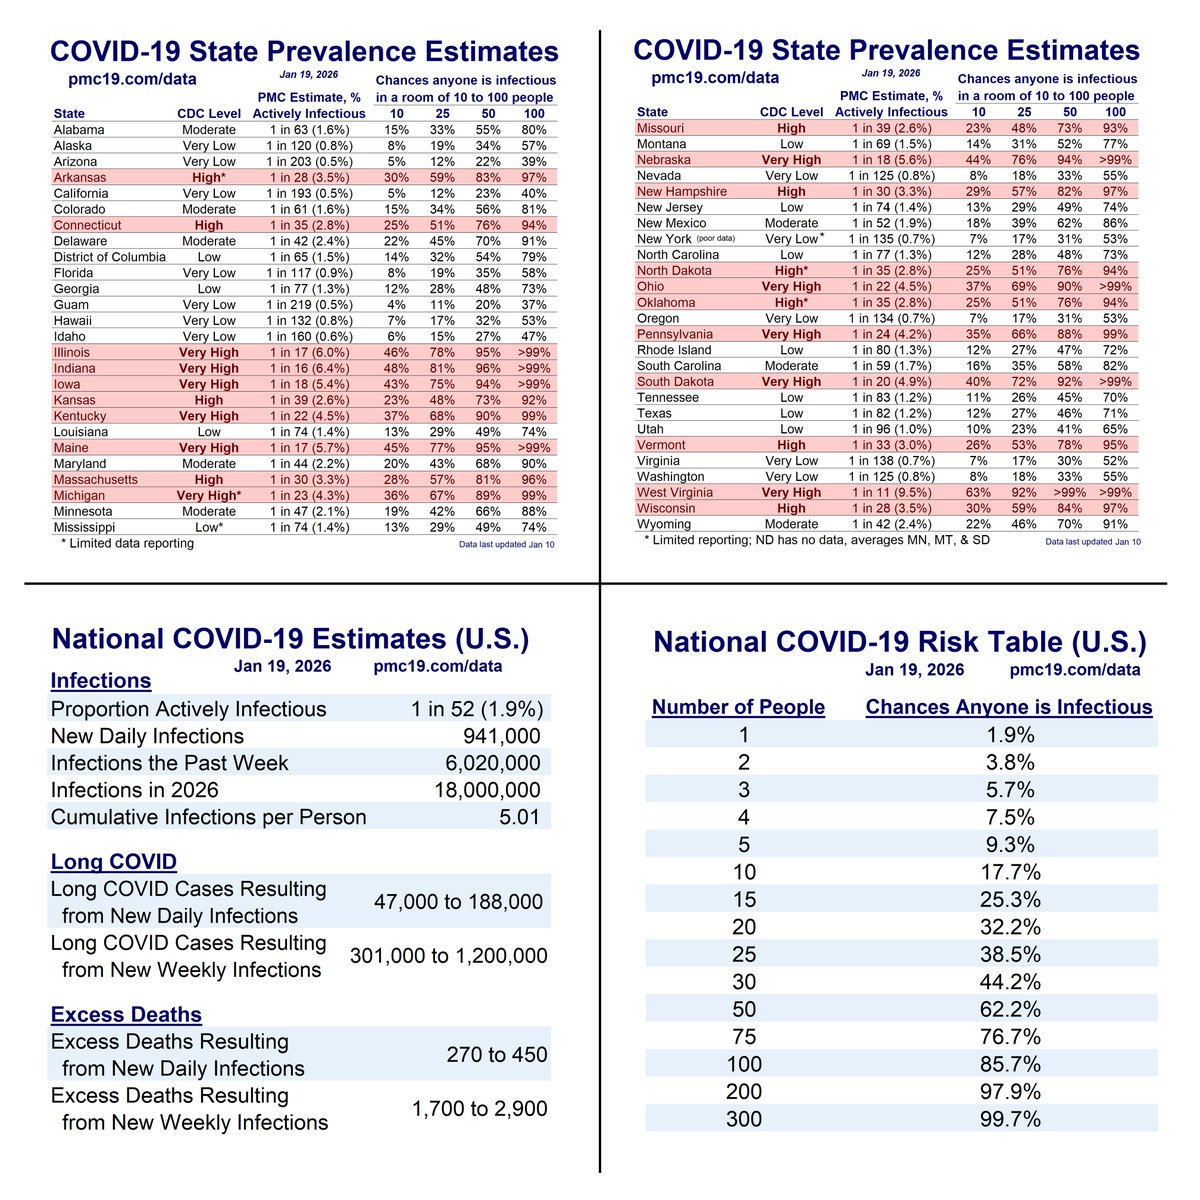
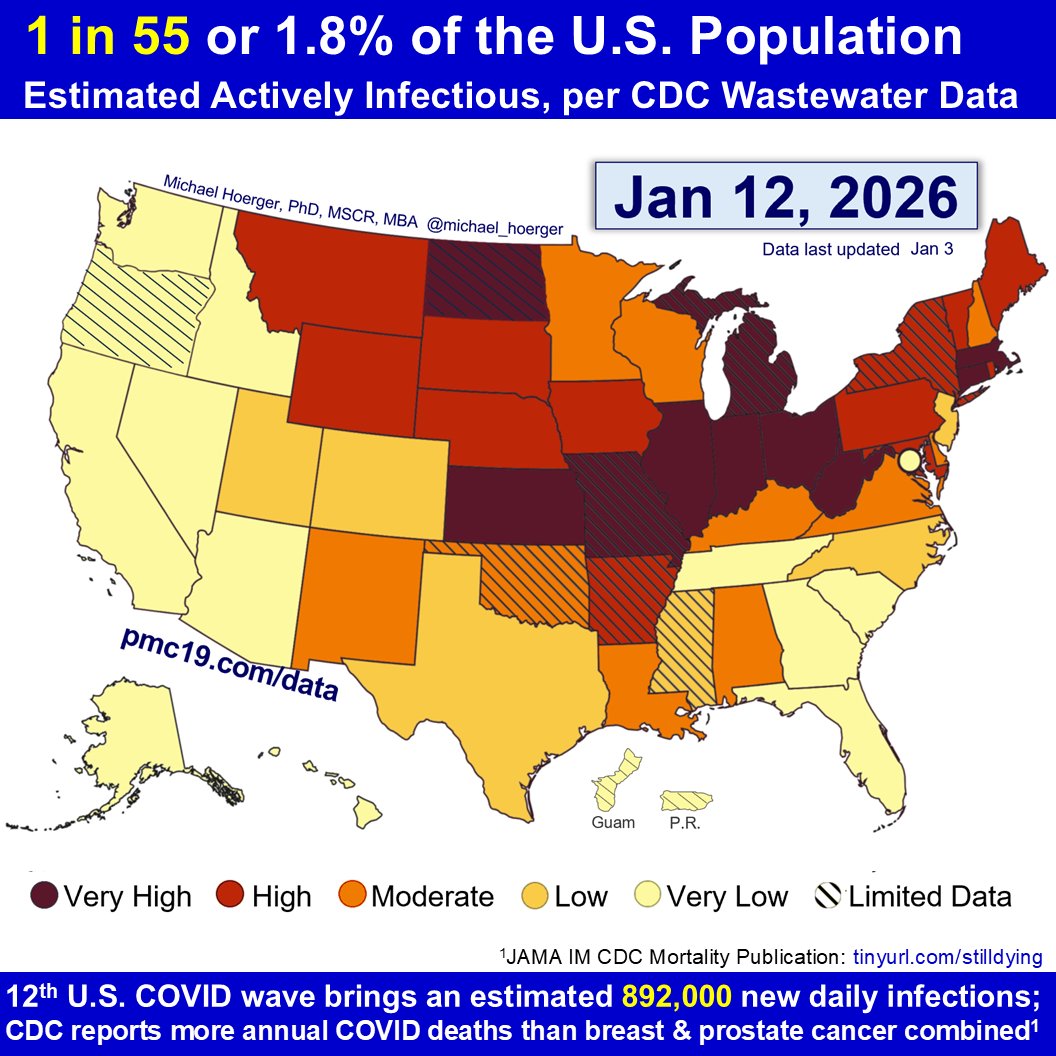
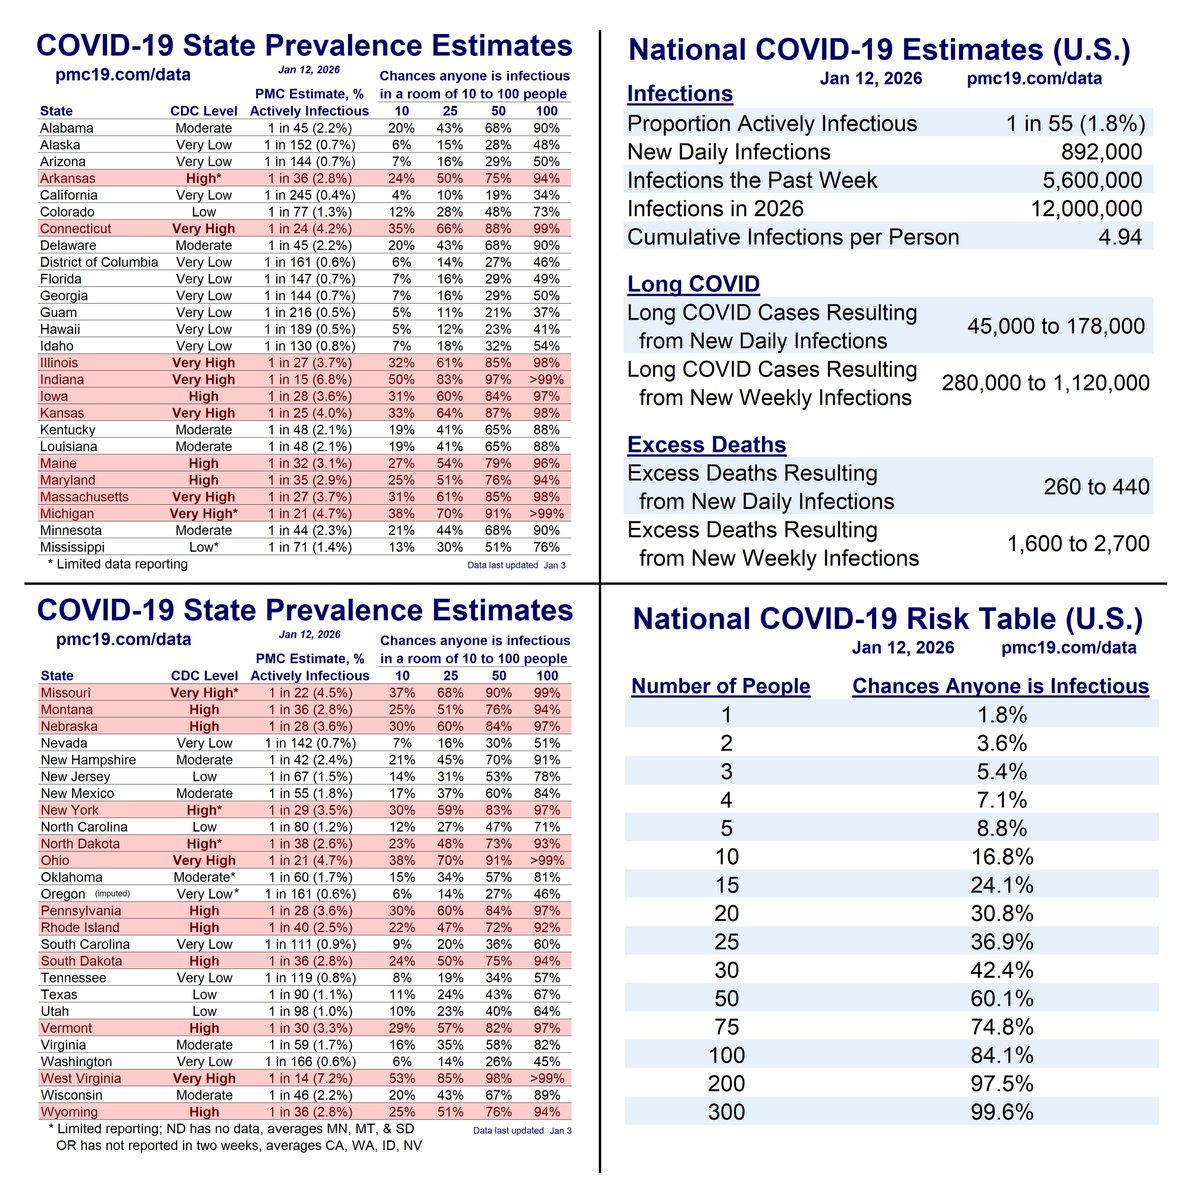
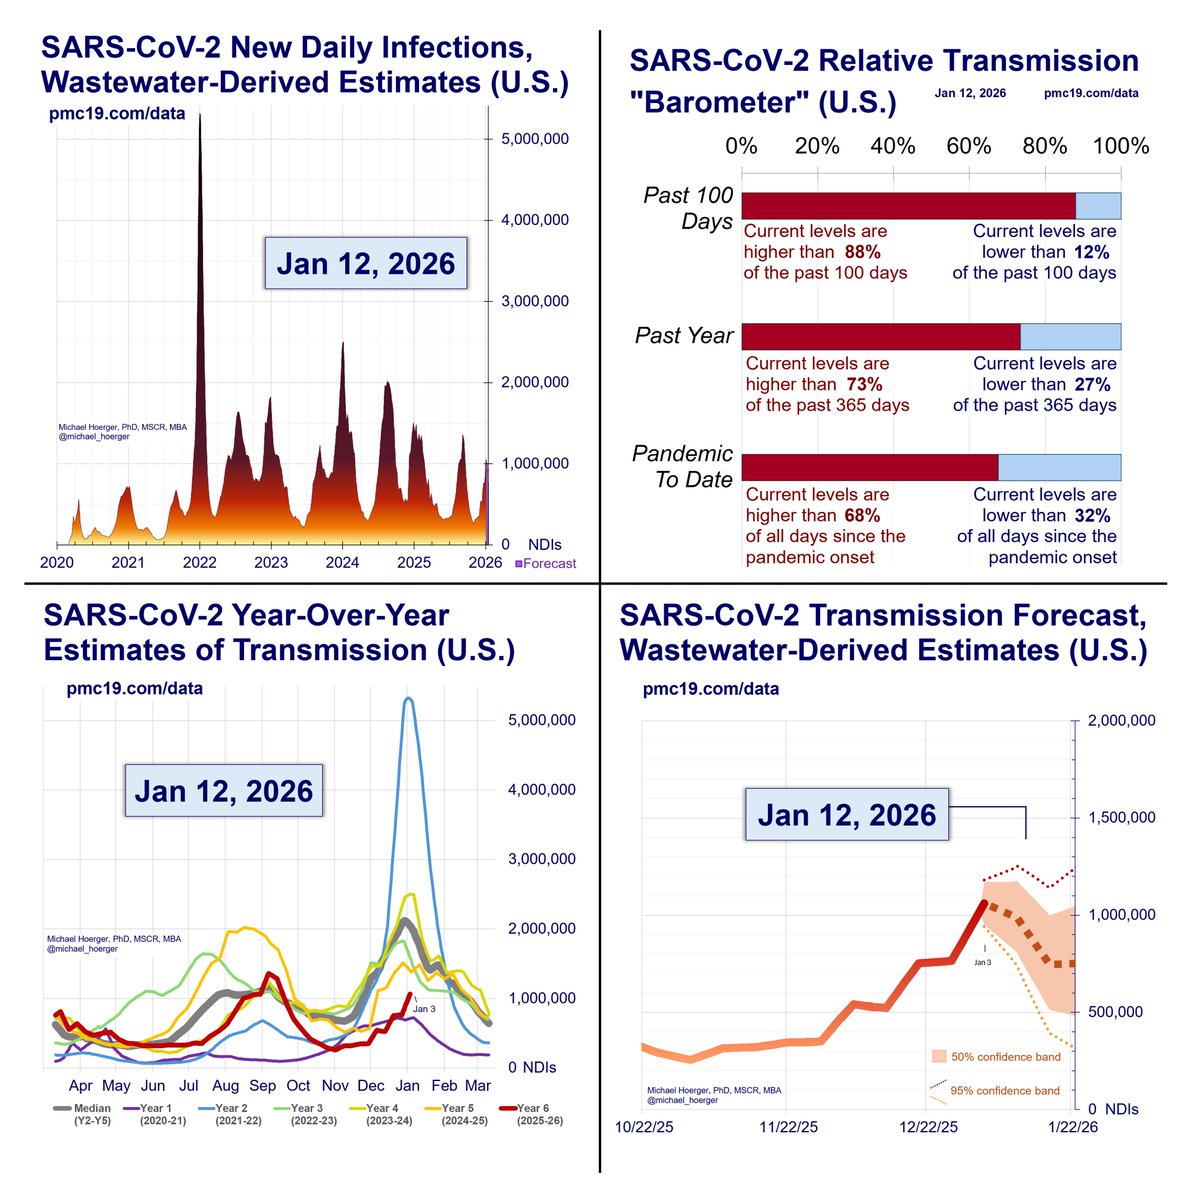
1/
PMC COVID-19 Forecast, Jan 8, 2024 (U.S.)
We're peaking at >2 million infections/day.
🔹1 in 23 people are actively infectious today
🔹1 in 3 people in the U.S. will be infected during the peak two months
🔹2nd biggest U.S. surge all-time
#MaskUp #VaxUp
PMC COVID-19 Forecast, Jan 8, 2024 (U.S.)
We're peaking at >2 million infections/day.
🔹1 in 23 people are actively infectious today
🔹1 in 3 people in the U.S. will be infected during the peak two months
🔹2nd biggest U.S. surge all-time
#MaskUp #VaxUp

2/
Before diving into the #Covid forecast, know that YOU can make a difference!
We will soon apply for a large research grant to help people with #cancer across the U.S. reduce their risk of negative Covid outcomes.
Learn more:
#CovidCancer tulane.co1.qualtrics.com/jfe/form/SV_3C…

Before diving into the #Covid forecast, know that YOU can make a difference!
We will soon apply for a large research grant to help people with #cancer across the U.S. reduce their risk of negative Covid outcomes.
Learn more:
#CovidCancer tulane.co1.qualtrics.com/jfe/form/SV_3C…

3/
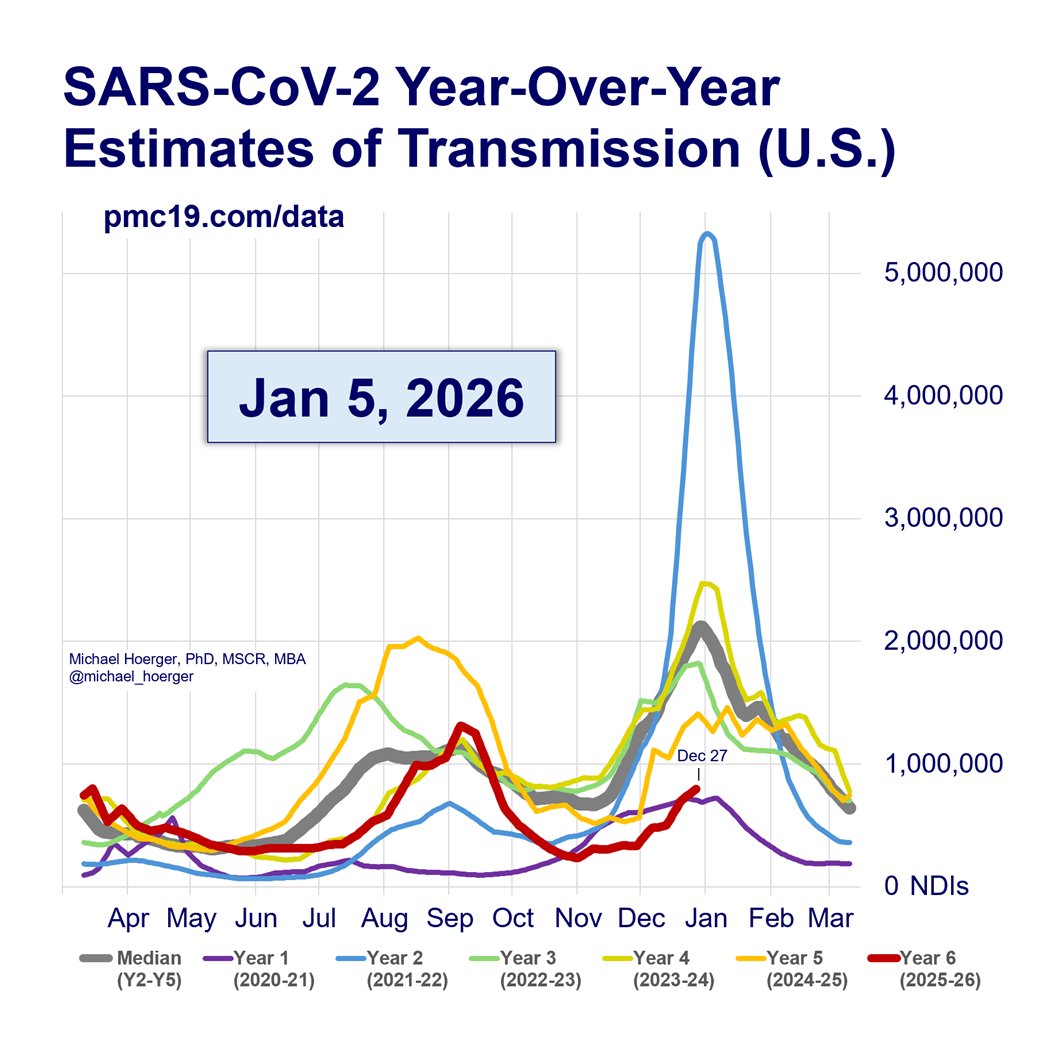
In the U.S. Covid #surge, it's not just the peak, it's the width of the mountain.
This is the 2nd highest peak all-time, but it's also brutally long. 1 in 3 people in the U.S. will get infected during the highest two months of transmission. 43% will get infected in the highest 3 months of transmission. Forecasted dates noted.
Those 142 million infections would conservatively translate into an eventual 7 million clinically significant #LongCovid cases.
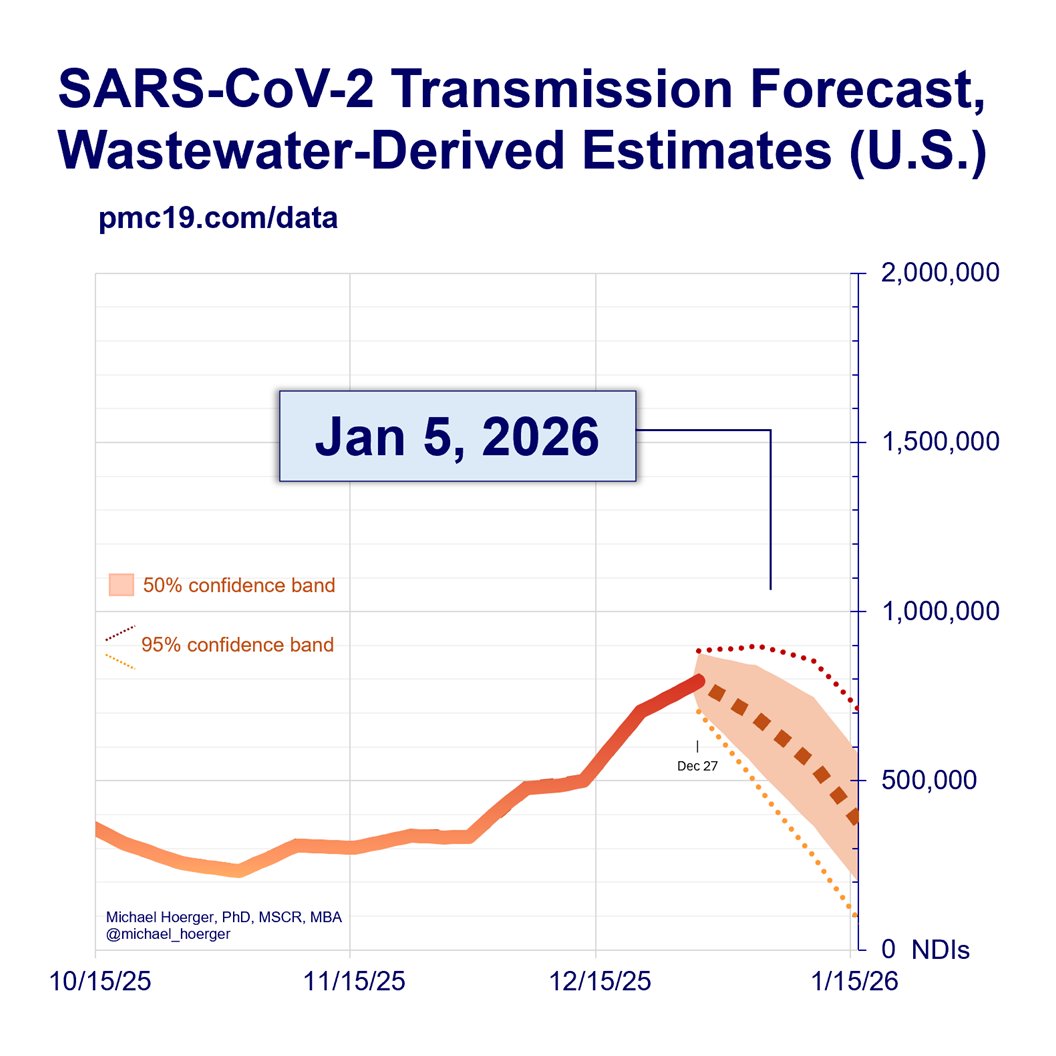
Transmission will drop considerably from early February through late March. On February 13, 2.9% of the population will be actively infectious, falling to 2.1% by February 24, 1% by mid-March, and bottoming out around 0.7% in late March. These very long-range projections are more historical medians rather than precise forecasts.

4/
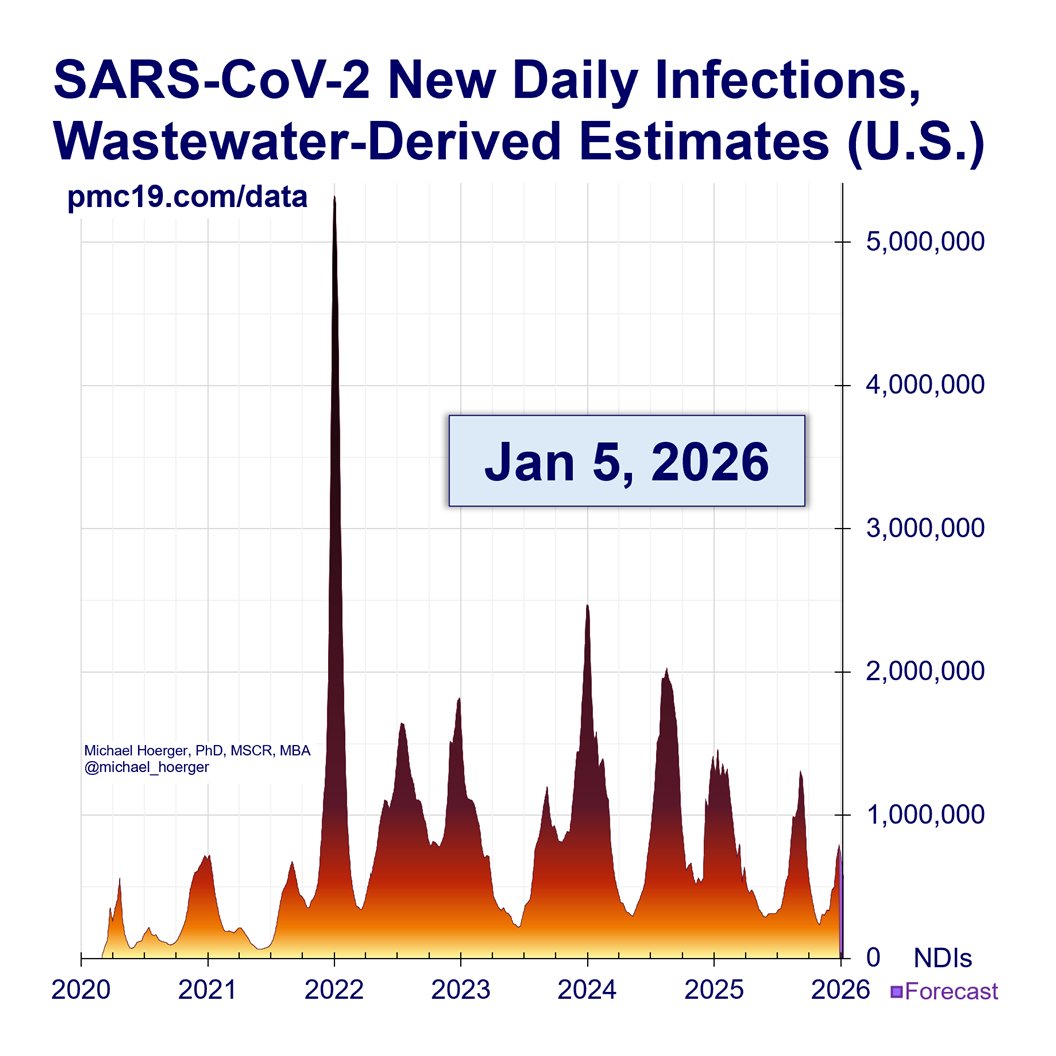
Zooming out to the entire pandemic, you can witness the brutality of the current #Covid #surge.
2nd biggest peak all-time. It also makes the horrific 2023 late-summer wave look like nothing.
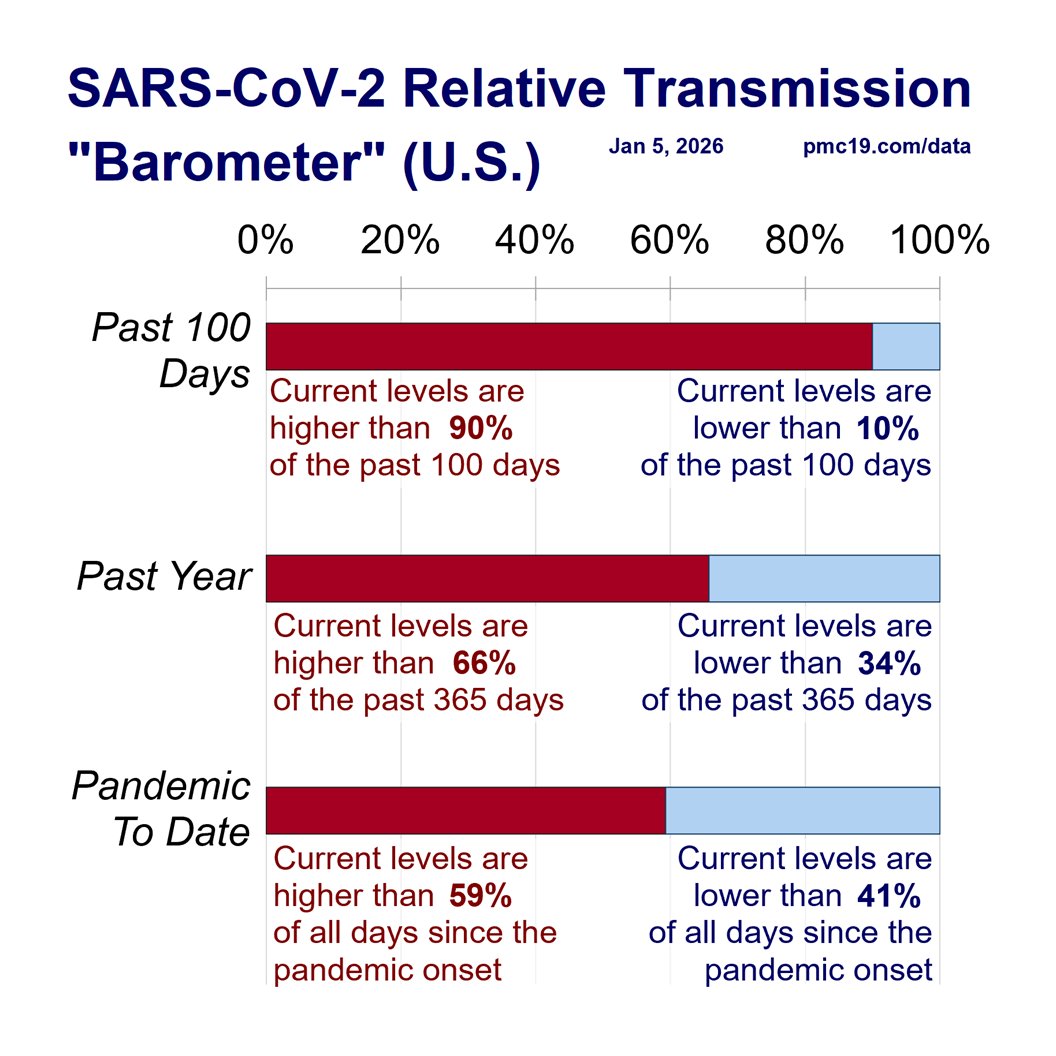
Transmission is worse in the U.S. today than during 96.5% of the days of the pandemic. We're already at 16 million Covid infections in 2024, which will conservatively ultimately result in 800 thousand #LongCovid cases.
All that remains to be settled is whether peak daily transmission will be closer to 2 million infections/day or 2.2 million per day.
You can read about the Turtle and Cheetah forecasting models in the online report. They basically adjust for the fact that Biobot has been retroactively correcting wastewater levels marginally upward. Perhaps locations with high transmission have more people out sick and report late.

5/
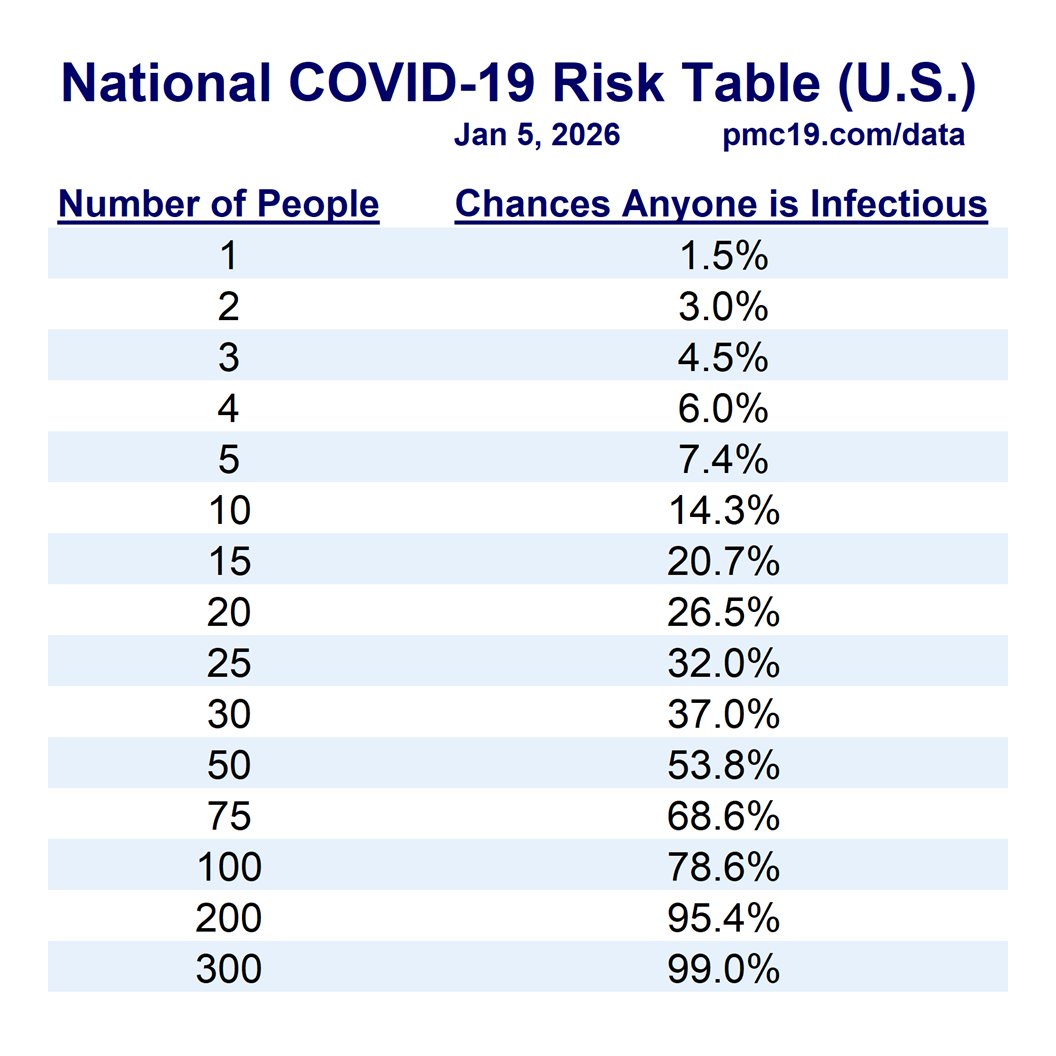
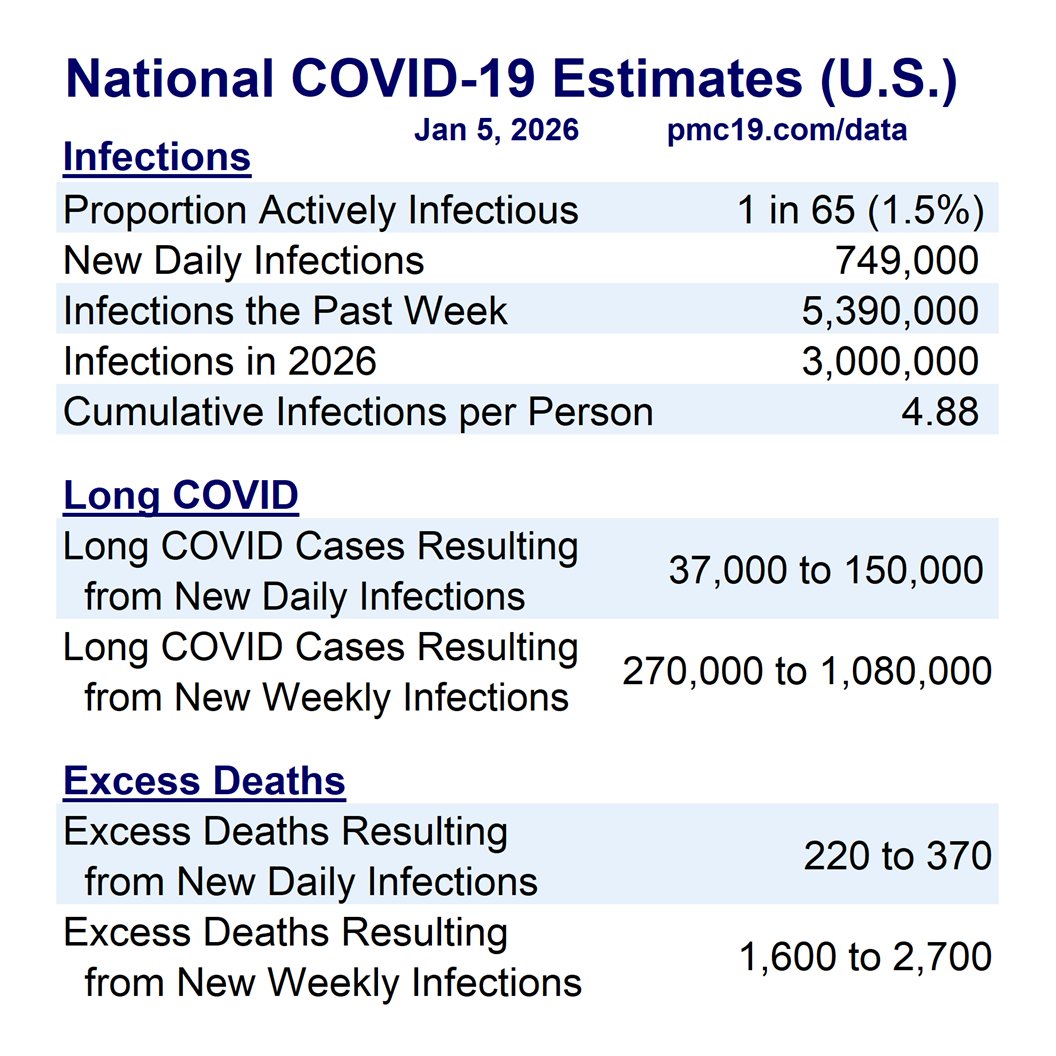
U.S. Covid Risk Table for the week of Jan 8, 2024.
In a gathering of 15-20 people, it's a coin toss whether at least one person has infectious Covid.
Avoid large gatherings. #VaxUp #MaskUp. DIY fit test. Turn that thermostat from 'auto' to 'on,' or better yet, get outside or remote. Add supplemental air cleaning with HEPA and #DIYAirCleaners. Keep testing.

6/
Warning: U.S. schools likely have very high Covid transmission throughout January 2024.
The following table shows the risk that anyone would have COVID in classrooms, based on varying size, date, and region.
Left table: The left table shows the chances someone is infectious with Covid based on class size and date. Class size matters considerably. Date does not (for January), as we'll be riding out the peak of the surge, which is more like a month-long plateau. In a class of 8, there's about a 25-30% chance someone would have Covid at any given time in January, absent any precautions using screening, testing, isolation, or quarantine. In a college class of 50, it's more like an 85-90% chance.
Right table: We do not model separately by region. However, if you track Biobot, you'll note levels are higher in the Northeast and Midwest than in the South and West. If we assume the same ratio for Jan 8, this table shows you how the risk varies geographically. The true risk levels could be a bit higher in the South/West if they catch up. The geographic comparisons arguably are not particularly useful because the regional differences tend to be more about the number of specific counties in an extreme surge, while most counties in a region follow the national average. If good local data from Verily or elsewhere, consider that, but otherwise focus more on national numbers. Even using these estimates for the South/West, they are very bad. A class of 32 would have a >50% chance of COVID, absent any screening/testing/isolation/quarantine precautions.
Summary: Schools are often among the highest risk settings for COVID transmission because of the high density of people in classrooms, presenteeism, discontinuation of testing programs, lack of masking requirements, use of ill-fitting and low-quality masks, low vaccination rates, low air cleaning rates, and an emphasis on droplet dogma (handwashing, Lysol) for an airborne virus. As indicated in the letter linked in the next section, the solution is to re-implement comprehensive COVID mitigation, as the U.S. is in the 2nd-largest COVID surge of the pandemic.
Letter: Dr. Hoerger has prepared a letter for parents seeking to advocate for better COVID mitigation at schools. Parents can consider attaching the letter as an appendix to their own letter. Alternatively, they can replace Dr. Hoerger’s letter with their own and use the tables provided, or any graphics from this website. No permission is required to use any of the graphics or data.
pmc19.com/data/pmc_schoo…

7/
International COVID Statistics
Independent estimates across 3 countries show that 4.2-5.0% of residents are actively infectious with Covid.
The U.S. numbers are now up to date, while the estimates in Canada and the U.K. are delayed by the holidays.
International COVID Statistics
Independent estimates across 3 countries show that 4.2-5.0% of residents are actively infectious with Covid.
The U.S. numbers are now up to date, while the estimates in Canada and the U.K. are delayed by the holidays.

8/
Toll of the COVID-19 pandemic in the U.S. in 2023
There were an estimated >250 million infections in the U.S. in 2023.
If assuming within-year reinfections were 0-30% of total reinfections, an estimated 53-76% of the U.S. population was infected at least once in 2023.
With a conservative estimate that 5% of infections will result in clinically significant Long Covid, that’s >12 million new #LongCovid cases.
These outcomes are the product of a highly-risky laissez-faire public health response to widespread viral transmission that contradicts the precautionary principle.

9/
Full PMC COVID-19 Forecasting Dashboard for the Week of Jan 8, 2024
Here's the entire dashboard. You can read the full report, which includes supplemental tables and analysis online:
pmc19.com/data
Full PMC COVID-19 Forecasting Dashboard for the Week of Jan 8, 2024
Here's the entire dashboard. You can read the full report, which includes supplemental tables and analysis online:
pmc19.com/data

10/end
Thank you to everyone engaged in pandemic advocacy.
The current surge demonstrates that public policy underlies human behavior that will continue to guide high transmission, viral evolution, and continued waves.
It's up to us to change that trajectory. 🙏
Thank you to everyone engaged in pandemic advocacy.
The current surge demonstrates that public policy underlies human behavior that will continue to guide high transmission, viral evolution, and continued waves.
It's up to us to change that trajectory. 🙏
https://twitter.com/michael_hoerger/status/1744580904356401284
• • •
Missing some Tweet in this thread? You can try to
force a refresh


