Jeff Gilchrist Profile picture
Jan 10, 2024 32 tweets 6 min read Read on X
Broad-Spectrum #COVID-19 #Therapeutics and #Prophylactics

An interesting presentation by Yunlong Richard Cao @yunlong_cao talking about their development of broadly #neutralizing #antibodies based on prediction of #viral #evolution ( ). 🧵1/
Slide showing how the immune barrier induced by vaccines and natural infection have been repeatedly evaded by the new COVID-19 variants. Image from: https://www.youtube.com/watch?v=OxpJM4gqwec
Read on to find out how their research team developed a neutralizing antibody solution (injection & nose spray) that works with all current variants, including the older SARS1 virus from 2003 and the currently globally dominant BA.2.86 Pirola clan of variants. 2/
Slide showing SA55 available as an injection to act as a long-term prophylactic or therapeutic for immunocompromised people (80-90 day half-life). Image from: https://www.youtube.com/watch?v=OxpJM4gqwec
Slide showing SA55 available as a nasal spray that is supposed to be low cost and provide short-term prophylactics (3 sprays per day) with 8-12h protection per spray providing high neutralization in the mucosa. Image from: https://www.youtube.com/watch?v=OxpJM4gqwec
An unrolled one-page web view for this long thread that may be easier to read or share can be found here ( ). 3/
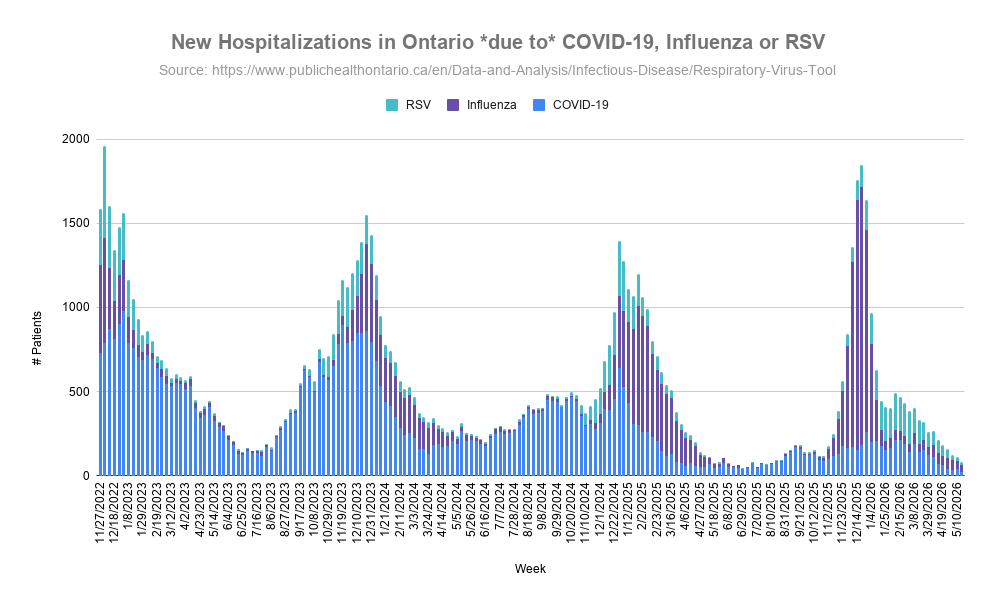
The COVID-19 virus is evolving so quickly with such massive unmitigated transmission that clinical development of vaccines and antibody drug development is too slow and can't keep pace. 4/
Even if updated vaccines can be designed quickly, they still take 4+ months to deploy and by then the variant landscape has already changed. 5/
Back in 2020 Dr. Cao found 300 human neutralizing antibodies and their team picked the 2 most potent antibodies to develop therapeutics. 6/
They passed phase 2 clinical trials but before they were ready to be used, the Omicron variant could already escape the antibodies, wasting about $150M. 7/ Slide of personal example of how viral evolution ruins clinical development. Image from: https://www.youtube.com/watch?v=OxpJM4gqwec
What is really interesting, there are still several of those original 300 neutralizing antibodies that remain potent to all variants to date, so they chose the wrong antibodies to develop. 8/
Dr. Cao wanted to find out how you identify the most broad-spectrum antibodies instead of the most potent ones so they are more likely to remain effective even with viral evolution. 9/
If you can try to predict viral evolution you might be able to select or design the best antibodies that will work long-term. 10/
For the past few years, Dr. Cao has been working on predicting the evolution of the SARS-CoV-2 virus. While mutations in the virus happen randomly, only the fittest survive and become successful which usually means they need to follow two criteria:

11/
1) maintain high binding efficiency to the ACE2 receptor to ensure viral replication
2) escape human neutralizing antibodies to evade immunity

12/ Slide showing survival of the fittest from random mutations of the virus. Image from: https://www.youtube.com/watch?v=OxpJM4gqwec
Following that hypothesis, Dr. Cao's team did high-throughput experiments to measure the impact of each mutation on the virus' infectivity and immune escape capability to predict the "optimal solution" for viral evolution. 13/
Using techniques developed over time they published a predictive model and highly immune evasive variant sequences in Sept. 2022. 14/
One month later in Oct. 2022 the BQ.1.1 and CH.1.1 variants that emerged XBB variant in Nov. 2022 sequentially gained the top 3 predicted mutations (346, 444, 460) and 490 for XBB. 15/ Slide showing the prediction model worked for new variants such as BQ1.1, CH.1.1 and XBB. Image from: https://www.youtube.com/watch?v=OxpJM4gqwec
Now it was time to try again to develop another solution but this time based on their virus evolution prediction model. 16/
They started with people who had been infected with SARS1 in 2003 who also had a COVID-19 vaccination in 2021 to screen 1400 antibodies and selected 1 for development. 17/
The neutralizing antibody they developed is called SA55 which can also neutralize SARS1 and many sarbecoviruses. 18/
You can see from the table that over time as new variants emerged, the other antibody therapeutics all stopped working since the virus evolved to escape those antibodies, while SA55 continues to neutralize even the latest BA.2.86 Pirola variants that are dominating globally. 19/ Slide showing variant escape of various therapeutics except for SA55 Sinovac solution based on virus evolution prediction. Image from: https://www.youtube.com/watch?v=OxpJM4gqwec
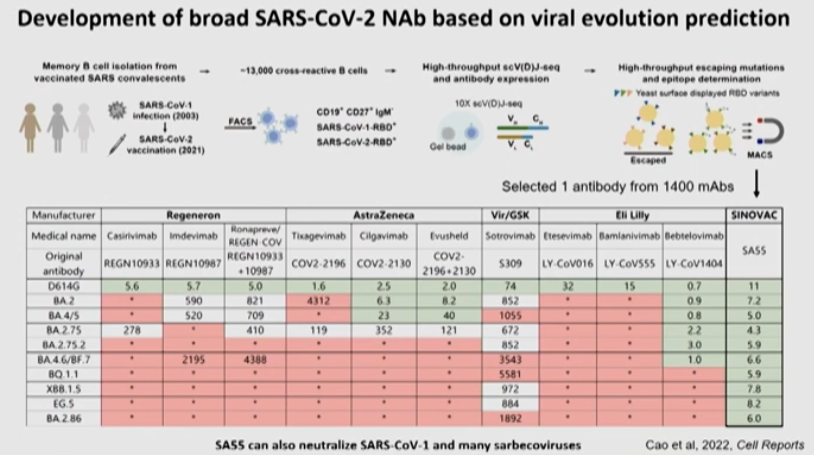
Previously, the most potent antibodies were selected which has already proven to be a bad strategy, instead you need to screen for the most broad ones. 20/
The reason they selected SA55 was by doing the mutation screening they found that SA55 can only be escaped by mutations on 503 and 504. 21/ Slide showing why SA55 was selected for clinical development, due to no immune pressure as the SA55 escaping sites. Image from: https://www.youtube.com/watch?v=OxpJM4gqwec
From their prediction model they know there is currently no immune pressure at locations 503 and 504 at all so choosing this antibody was a very safe choice. 22/
It is very difficult for a virus carrying mutations in location 503 and 504 to successfully transmit among a population which helps explain why after 2.5 years this antibody has not yet been evaded. 23/
SA55 has been made into multiple tools already. One is an injection for immunocompromised people to act as a long-term prophylactic with an 80-90 day half-life or therapeutic. It has already been used to treat 2,000 elderly patients in Beijing during the outbreak in December. 24/ Slide showing SA55 available as an injection to act as a long-term prophylactic or therapeutic for immunocompromised people (80-90 day half-life). Image from: https://www.youtube.com/watch?v=OxpJM4gqwec
The second tool is a SA55 nasal spray that is supposed to be low cost and provide short-term prophylactics (3 sprays per day) with 8-12h protection per spray providing high neutralization in the mucosa. 25/ Slide showing SA55 available as a nasal spray that is supposed to be low cost and provide short-term prophylactics (3 sprays per day) with 8-12h protection per spray providing high neutralization in the mucosa. Image from: https://www.youtube.com/watch?v=OxpJM4gqwec
It has been used by over 200,000 people and provides about 80% protection against symptomatic infection. 26/
The real challenge is future vaccines. Choosing the XBB.1.5 variant for this fall's vaccine dose selection was not the optimal solution but a practical solution. 27/
From the time the XBB.1.5 variant was chosen in May to when the vaccine was deployed in the USA (September), there was already a 4x decrease in vaccine efficacy because variants had changed so much through natural evolution. 28/
Instead of always being behind, a new strategy is needed for COVID vaccine development and Dr. Cao suggests creating a broad-spectrum vaccine based on viral evolution prediction. 29/ Slide showing new strategy for vaccines to create broad-spectrum COVID vaccine based on viral evolution prediction. Image from: https://www.youtube.com/watch?v=OxpJM4gqwec
Instead of basing vaccines on already existing naturally occurring variants, design them based on mutation prediction from current variants to determine what the most likely mutations are going to be. 30/
Hopefully vaccine manufacturers will start using better strategies like this in the future than always chasing variants and being left behind. 31/
@threadreaderapp please unroll

• • •

Missing some Tweet in this thread? You can try to force a refresh
 

Keep Current with Jeff Gilchrist

Jeff Gilchrist Profile picture

Stay in touch and get notified when new unrolls are available from this author!

Read all threads

This Thread may be Removed Anytime!

PDF

Twitter may remove this content at anytime! Save it as PDF for later use!

Try unrolling a thread yourself!

how to unroll video
  1. Follow @ThreadReaderApp to mention us!

  2. From a Twitter thread mention us with a keyword "unroll"
@threadreaderapp unroll

Practice here first or read more on our help page!

More from @jeffgilchrist

Jun 9
Understanding Canadian Air Quality Health Index (AQHI) & Wildfire Smoke

Wildfire smoke consists of toxic gases and particulate matter (PM) when breathed in gets into our lungs, bloodstream, and even our brain. 🧵1/
#iaq #wildfire #smoke #AQI #AQHI #Canada Bar chart of Canadian Air Quality Health Index (AQHI) - Equivalent # Cigarettes after Exposure ranging from 0.5 cigarettes after 8 hours exposure at AQHI level 3 to 0.9 cigarettes at level 6 and 1.5 at level 10.
Graph of Particulate Matter (PM) Levels in Ottawa from June 6, 2025 to June 8, 2025 from a VisiblAir Model X air quality sensor ( https://visiblair.com/ ).
The web version of this article with nice table of contents and easy to share with others can be found here ( tinyurl.com/AQHIwildfire ) and ( docs.google.com/document/d/1s9… ). 2/ Table of Contents: * Introduction * Air Quality Health Index (AQHI) * Health impact of Wildfire Smoke * Protect Yourself
When smoke stays in the air for prolonged periods of time, the UV radiation from the sun interacts with all the volatile organic compounds (VOCs) to form even more toxic gases ( ). 3/theweathernetwork.com/en/news/weathe…
Read 41 tweets
Jun 6
Pollution levels in Ottawa are very high from wildfire smoke. The particulate matter (PM)2.5 levels surpassed 140 ug/m^3 Thursday evening and are still above 130 on my VisiblAir Model X outdoor sensor ( ). 🧵1/ #iaq #wildfire #smoke visiblair.comLine graph showing PM2.5 levels in Ottawa increasing above 140 ug/m^3 and still above 130 now
Readings from a VisiblAir Model X outdoor air quality monitor showing levels in Ottawa above 130 ug/m^3 for PM2.5 wildfire smoke pollution
The EPA maps fine particulate pollution to their Air Quality Index where anything above 125.5 PM is Very Unhealthy which is a "Health alert: The risk of health effects is increased for everyone" ( ). 2/airnow.gov/aqi/aqi-basics/
EPA Categories:
* Unhealthy for Sensitive Groups (Orange) = 35.5-55.4 PM ug/m^3
* Unhealthy for everyone (Red) = 55.5 to 125.4 PM ug/m^3
* Very Unhealthy (Purple) = 125.5 to 225.4 PM ug/m^3
* Hazardous (Brown) = 225.5+ PM ug/m^3

3/
Read 13 tweets
Feb 10
#Ottawa, #Ontario, #Canada Virus Update:

You can see in the graph, COVID makes up the majority of new hospitalizations due to #Flu, #RSV or #COVID throughout the year, and even stays ahead during winter respiratory virus season. 🧵1/ A line graph displaying the percentage of patients hospitalized due to COVID-19, Influenza, or RSV over time, from September 1, 2023, to January 26, 2025. The x-axis represents weeks within this period, and the y-axis shows percentages from 0% to 100%. The graph has three colored lines: blue for COVID-19, purple for Influenza, and teal for RSV. The graph shows fluctuations in the percentage of hospitalizations due to each cause over time, with COVID-19 consistently having the highest percentage, followed by Influenza and RSV.
New hospitalizations are increasing again. This last update was the first time Flu hospitalizations (42) were significantly higher than COVID (34) in the same week with RSV at 14 people. 2/ The bar chart shows the number of new hospitalizations per week in Ottawa from August 27, 2023, to January 26, 2025. The y-axis represents the number of patients, ranging from 0 to 100. The x-axis represents the weeks. The bars are color-coded: blue for COVID-19, purple for Influenza, and teal for RSV. The chart shows fluctuations in hospitalizations over time, with notable peaks around December 2023 and January 2025.
In Ottawa, test positivity for Flu A (bright green) has really increased, COVID is still in second place, but seasonal human coronavirus is almost the same level, followed by Entero/Rhinovirus, and then RSV for the top 5. 3/ A stacked area chart displaying the percentage of positive tests for various viruses over time, from October 1, 2022, to January 26, 2025. The x-axis represents weeks within this period, while the y-axis represents the percentage, cumulatively stacked to 100%. The chart features the following viruses, each depicted in a distinct color: COVID-19 (red), Entero/Rhinovirus (yellow), Seasonal human coronavirus (purple), RSV (green), Parainfluenza (all types) (blue), Influenza B (dark purple), Influenza A (light green), Human metapneumovirus (pink), and Adenovirus (dark blue). The data shows fluc...
Read 6 tweets
Jan 20
Similar to #Canada, babies in the #UK are at higher risk for #hospitalization and #ICU admission from #COVID. Their data looks deeper at infants < 6 months old which have higher ER attendance, hospital admission and severe hospitalisation rates than the oldest adults 90+! 🧵1/
That data from the UK was taken from this pre-print study ( ). 2/medrxiv.org/content/10.110…
In Canada, babies < 1 years old had the highest ICU admission rates of all age groups from Aug. 27, 2023 to Aug. 24, 2024. Read on to see more details including Flu and RSV too ( ). 3/
Read 7 tweets
Jan 19
The @elastomaskpro () is a NIOSH approved reusable N95 elastomeric respirator. It is made of silicone so a higher chance it will fit and seal well and is super breathable at the same time. Read on to find out more about my experience with it. 🧵1/ elastomaskpro.comA blue respirator mask, called ElastoMaskPro, rests on top of a blue and white box. The mask has a smooth, curved design with two circular filters on each side. The mask's straps are neatly arranged.
A light blue ElastoMaskPro N95 reusable respirator mask with a soft, flexible facepiece rests on top of its packaging box. The mask features a large opening in the center, showcasing white pleated filters. Two elastic straps are attached to the mask for securing it to the face.
Full disclosure: ElastoMaskPro sent me a unit to evaluate. There were no strings attached, they just asked that I provided feedback after I tried it. This thread is the first time they are seeing my feedback, they did not review anything before it being posted here. 2/
The ElastoMaskPro is very cost effective at the current sale price of $29.99 which includes two N95 filtering pucks. You can continue using the filters until they either get too dirty or there is increased breathing resistance. 3/ ElastoMaskPro Filter Puck. Filter Pucks are constructed using an adhesive-free process that incorporates a large volume of long-lasting, highly durable mechanical filtration media.
Read 43 tweets
Jan 6
#Ottawa, #Ontario, #Canada Virus Update:

Ottawa updated its #respiratory #virus data again after a break for the holidays, respiratory related ED visits are up especially in kids 0-3, then 4-11 and age 80+. 🧵1/ A line graph showing the number of respiratory-related emergency department (ED) visits per 100,000 population by week, from September 1, 2023, to November 1, 2024, across different age groups. Six lines represent the age groups: Age 0-3 (purple), Age 4-11 (blue), Age 12-17 (green), Age 18-54 (yellow), Age 55-79 (red), and Age 80+ (orange). The Age 0-3 group shows the highest number of visits, peaking around 1000 visits per 100,000 population, while other age groups generally have rates below 250 visits per 100,000 population. The graph exhibits seasonal fluctuations, with peaks in the wint...
Quite a mixture of different viruses testing positive in the lab right now so people can pick up a variety of bugs in the air. 2/ A stacked area chart displaying the percentage of positive tests for various viruses over time, from October 1, 2022, to December 22, 2024. The x-axis represents weeks within this period, while the y-axis represents the percentage, cumulatively stacked to 100%. The chart features the following viruses, each depicted in a distinct color: COVID-19 (red), Entero/Rhinovirus (yellow), Seasonal human coronavirus (blue), RSV (green), Parainfluenza (purple), Influenza B (light blue), Influenza A (light green), Human metapneumovirus (pink), and Adenovirus (dark blue). COVID-19 maintains a high posit...
New hospitalizations also jumped a lot in the last two reporting weeks, not just due to #RSV but a big spike in #COVID as well.

Follow the latest updates here ( ). 3/ covid.gilchrist.ca/Ottawa.htmlThe bar chart shows the number of new hospitalizations per week in Ottawa from August 27, 2023, to December 22, 2024. The y-axis represents the number of patients, ranging from 0 to 100. The x-axis represents the weeks. The bars are color-coded: blue for COVID-19, purple for Influenza, and teal for RSV. The chart shows fluctuations in hospitalizations, with peaks around late 2023 and early 2024, and another peak towards the end of 2024.
A line graph displaying the percentage of patients hospitalized due to COVID-19, Influenza, or RSV over time, from September 1, 2023, to December 22, 2024. The x-axis represents weeks within this period, and the y-axis shows percentages from 0% to 100%. The graph has three colored lines: blue for COVID-19, purple for Influenza, and teal for RSV. COVID-19 consistently shows the highest percentage of hospitalizations, with fluctuations throughout the period.
Read 4 tweets

Did Thread Reader help you today?

Support us! We are indie developers!


This site is made by just two indie developers on a laptop doing marketing, support and development! Read more about the story.

Become a Premium Member ($3/month or $30/year) and get exclusive features!

Become Premium

Don't want to be a Premium member but still want to support us?

Make a small donation by buying us coffee ($5) or help with server cost ($10)

Donate via Paypal

Or Donate anonymously using crypto!

Ethereum

0xfe58350B80634f60Fa6Dc149a72b4DFbc17D341E copy

Bitcoin

3ATGMxNzCUFzxpMCHL5sWSt4DVtS8UqXpi copy

Thank you for your support!

Follow Us!

:(