Jeff Gilchrist Profile picture
Jan 14 12 tweets 5 min read Read on X
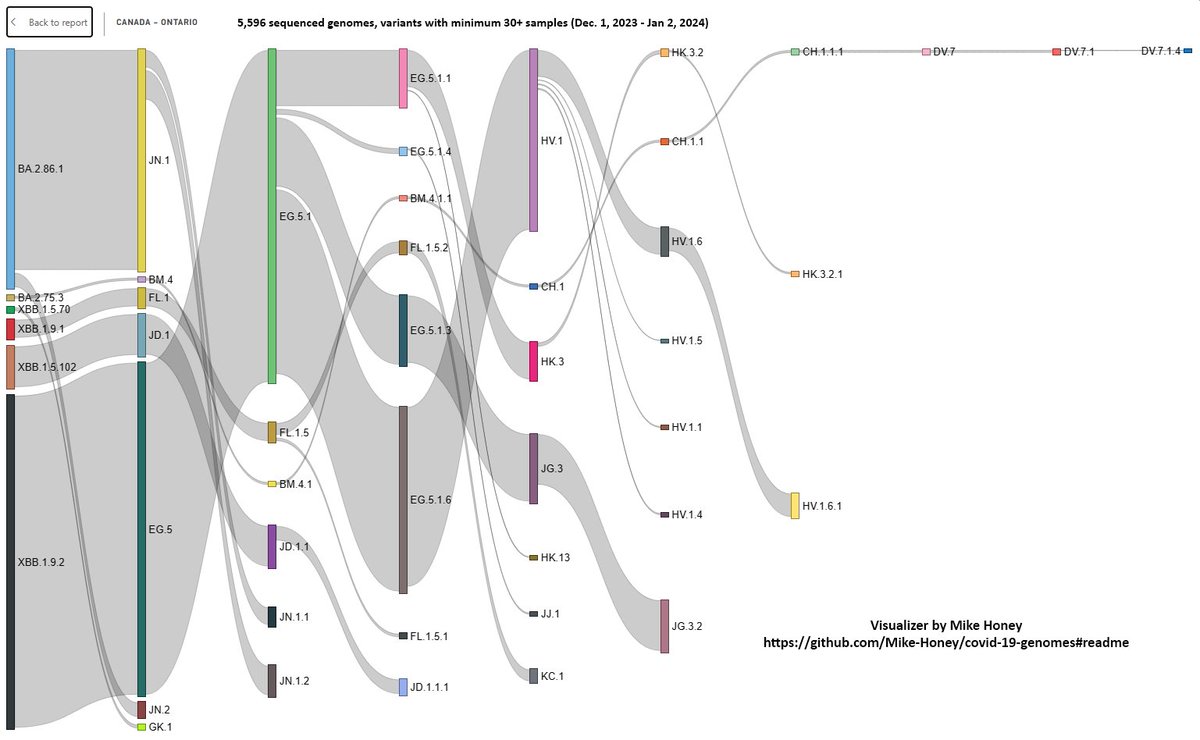
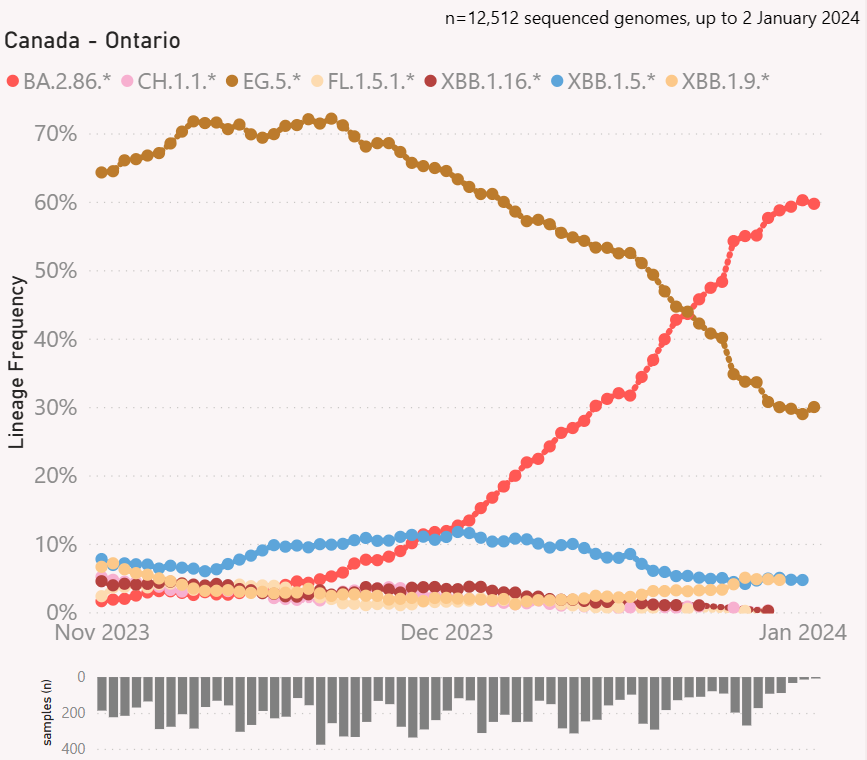
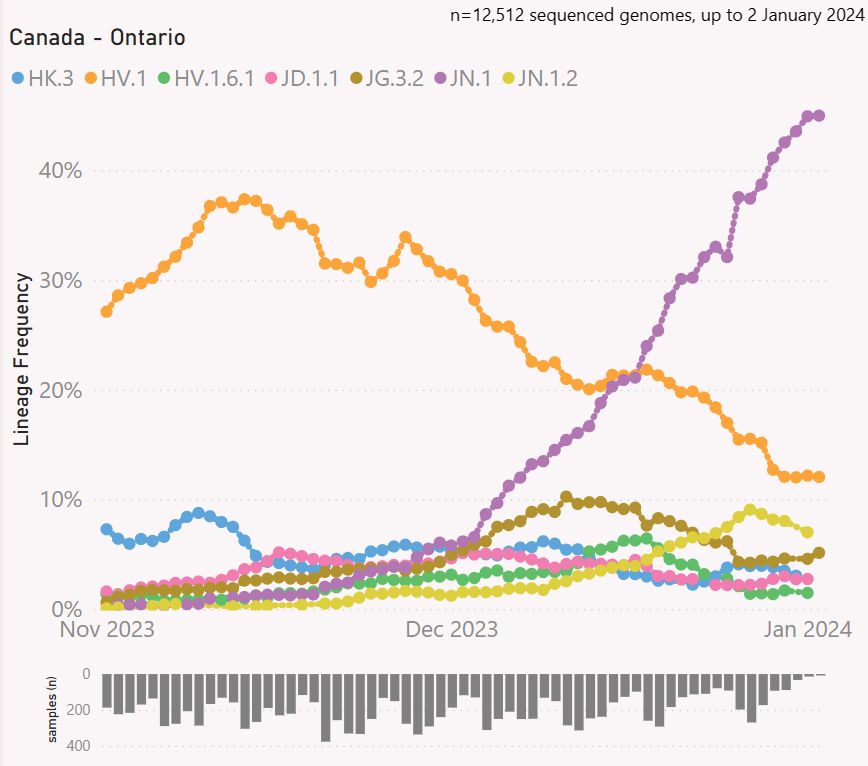
#Variant update for #Ontario, #Canada (to Jan. 2, 2023)

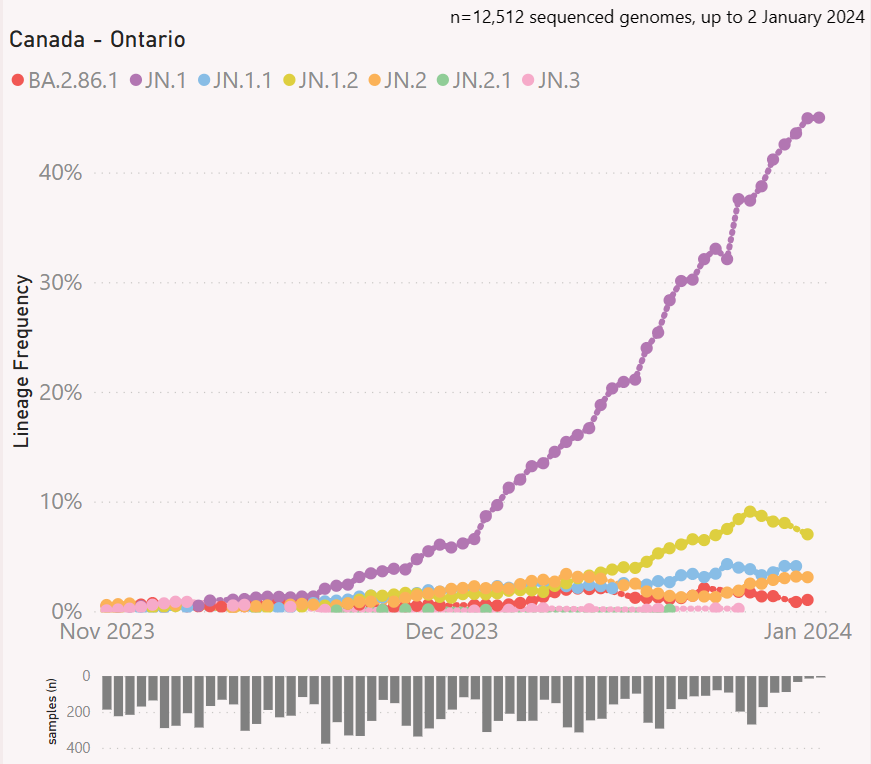
The BA.2.86.* #Pirola clan of variants is now the majority of sequences at 60%. JN.1 "Pirola" keeps 1st place at 45% with HV.1 #Eris a distant 2nd at 12%, then JN.1.2 at 7%. Graph tools by @Mike_Honey_ 🧵1/

Sankey graph (height of each bar is # of sequences for that variant) showing top variants and their lineages over the past couple of months from PCR test genomic sequencing in Ontario, Canada. Visualization tool was created by @Mike_Honey_ ( https://app.powerbi.com/view?r=eyJrIjoiNzE5YzczODItMDQzMS00M2EzLWFjNWYtMjg3OTY3NTNhZDM3IiwidCI6ImRjMWYwNGY1LWMxZTUtNDQyOS1hODEyLTU3OTNiZTQ1YmY5ZCIsImMiOjEwfQ%3D%3D&pageName=ReportSection32240d6b62ba73667e98 )
Graph of top 7 COVID variant clans from PCR test genomic sequencing in Ontario, Canada. Visualization tool was created by @Mike_Honey_ ( https://app.powerbi.com/view?r=eyJrIjoiNzE5YzczODItMDQzMS00M2EzLWFjNWYtMjg3OTY3NTNhZDM3IiwidCI6ImRjMWYwNGY1LWMxZTUtNDQyOS1hODEyLTU3OTNiZTQ1YmY5ZCIsImMiOjEwfQ%3D%3D
Graph of top 7 COVID variants (JN.1, HV.1, JN.1.2, JG.3.2, HK.3, JD.1.1, HV.1.6.1) from PCR test genomic sequencing in Ontario, Canada. Visualization tool was created by @Mike_Honey_ ( https://app.powerbi.com/view?r=eyJrIjoiNzE5YzczODItMDQzMS00M2EzLWFjNWYtMjg3OTY3NTNhZDM3IiwidCI6ImRjMWYwNGY1LWMxZTUtNDQyOS1hODEyLTU3OTNiZTQ1YmY5ZCIsImMiOjEwfQ%3D%3D )
The one page easier to share version of this thread can be found at ( ). 2/mastoreader.io/?url=https%3A%…
Despite transmission levels being high in Ontario for the past few months and so many people being infected with an EG.5.* "Eris" based variant, JN.1 "Pirola" was still able to come in and take over quickly. 3/ Graph of top 7 BA.2.86.* Pirola family COVID variants (BA.2.86.1, JN.1, JN.1.1, JN.1.2, JN.2, JN.2.1, JN.3) from PCR test genomic sequencing in Ontario, Canada. Visualization tool was created by @Mike_Honey_ ( https://app.powerbi.com/view?r=eyJrIjoiNzE5YzczODItMDQzMS00M2EzLWFjNWYtMjg3OTY3NTNhZDM3IiwidCI6ImRjMWYwNGY1LWMxZTUtNDQyOS1hODEyLTU3OTNiZTQ1YmY5ZCIsImMiOjEwfQ%3D%3D )
To give you an idea of just how different the Pirola family of variants is, this antigenic cartography graph shows JN.1 way down in the far right corner, far away from the HV.1 Eris variant (mid-right) that JN.1 just displaced. H/T: @yunlong_cao 4/ Antigenic cartography chart showing the more distance between variants in the graph, the less cross-reactivity between the variants. Each box represents a 2x decrease in efficacy. Image from: https://twitter.com/yunlong_cao/status/1714694253530804588
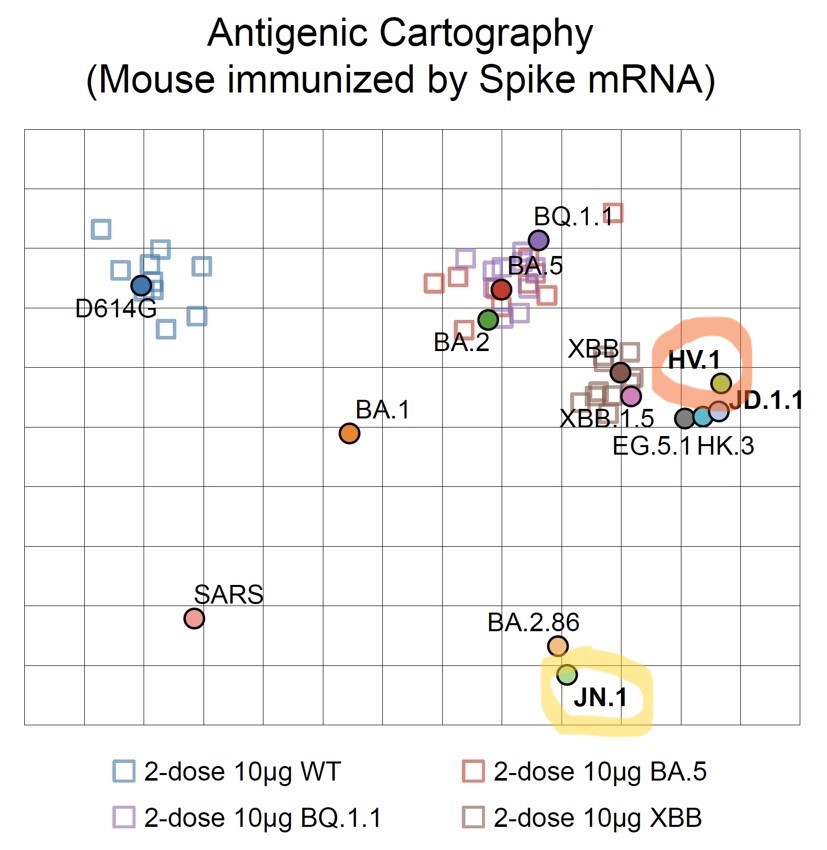
Each box in the chart represents a 2x decrease in efficacy, so the further away a variant is from another, the less cross-reactivity there will be in antibodies generated from exposure to that variant. 5/
You can find weekly Ontario stats including variants at ( ) and ( ). 6/covid.gilchrist.ca/Ontario.html
gilchrist.great-site.net/jeff/COVID-19/…
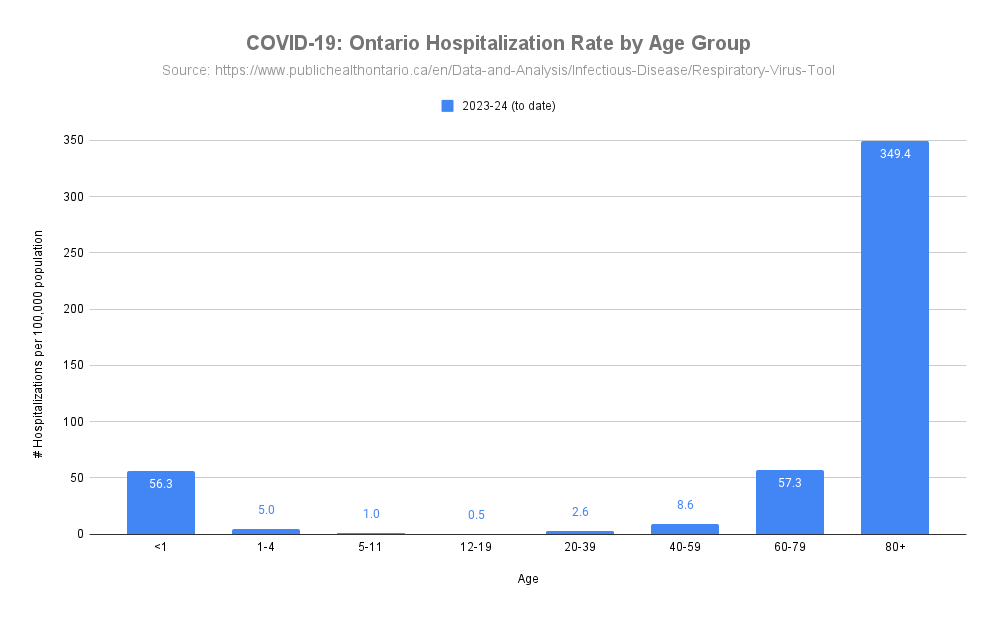
Parents with new babies be extra careful, in our current surveillance period (week 35, 2023 to present) infants < 1 years old are being hospitalized for COVID at a rate of 56.3 per 100,000 population, almost the same as adults age 60-79 at 57.3 per 100k population. 7/ Graph of # of Hospitalizations per 100,000 population for COVID-19 in Ontario by Age group for 2023-24. Image from: http://covid.gilchrist.ca/Ontario.html
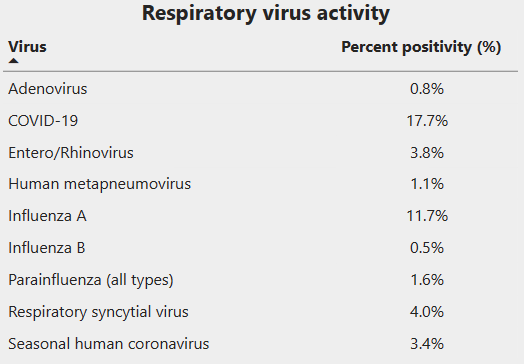
The % positivity from viral tests shows COVID-19 remains in the lead (17.7%) with Influenza A in 2nd place at 11.7% and RSV dropped significantly to 4% in 3rd place ( ). 8/ publichealthontario.ca/en/Data-and-An…
Table showing percentage positivity of respiratory virus activity in Ontario. Table from: https://www.publichealthontario.ca/en/Data-and-Analysis/Infectious-Disease/Respiratory-Virus-Tool
The visualization tool for variants was created by @Mike_Honey_ ( ). 9/app.powerbi.com/view?r=eyJrIjo…
To learn how to create a Sankey diagram of variants circulating in your area, please read this guide ( ). 10/
To learn how to see what variants are circulating in your area, please read this guide ( ). 11/
@threadreaderapp please unroll

• • •

Missing some Tweet in this thread? You can try to force a refresh
 

Keep Current with Jeff Gilchrist

Jeff Gilchrist Profile picture

Stay in touch and get notified when new unrolls are available from this author!

Read all threads

This Thread may be Removed Anytime!

PDF

Twitter may remove this content at anytime! Save it as PDF for later use!

Try unrolling a thread yourself!

how to unroll video
  1. Follow @ThreadReaderApp to mention us!

  2. From a Twitter thread mention us with a keyword "unroll"
@threadreaderapp unroll

Practice here first or read more on our help page!

More from @jeffgilchrist

Jan 11
How To: Create a Sankey diagram of variants circulating in your area

This thread will walk you through the process of using @Mike_Honey_'s visualization tool to generate a Sankey diagram for your country, province or State.🧵1/ Filtered Sankey diagram view with "Lineage Level" set to 3 and 11 and the Minimum # Samples per Lineage to show" to 60 and all labels shown. Visualization tool was created by Mike Honey @Mike_Honey_ ( https://app.powerbi.com/view?r=eyJrIjoiNzE5YzczODItMDQzMS00M2EzLWFjNWYtMjg3OTY3NTNhZDM3IiwidCI6ImRjMWYwNGY1LWMxZTUtNDQyOS1hODEyLTU3OTNiZTQ1YmY5ZCIsImMiOjEwfQ%3D%3D )
An unrolled one-page web view for this long thread that may be easier to read or share can be found here ( ). 2/
Step 1: Go to Mike's variant visualization tool ( ). By default, Australia is chosen so you need to select your region of interest. 3/app.powerbi.com/view?r=eyJrIjo…
Read 32 tweets
Jan 10
Broad-Spectrum #COVID-19 #Therapeutics and #Prophylactics

An interesting presentation by Yunlong Richard Cao @yunlong_cao talking about their development of broadly #neutralizing #antibodies based on prediction of #viral #evolution ( ). 🧵1/
Slide showing how the immune barrier induced by vaccines and natural infection have been repeatedly evaded by the new COVID-19 variants. Image from: https://www.youtube.com/watch?v=OxpJM4gqwec
Read on to find out how their research team developed a neutralizing antibody solution (injection & nose spray) that works with all current variants, including the older SARS1 virus from 2003 and the currently globally dominant BA.2.86 Pirola clan of variants. 2/
Slide showing SA55 available as an injection to act as a long-term prophylactic or therapeutic for immunocompromised people (80-90 day half-life). Image from: https://www.youtube.com/watch?v=OxpJM4gqwec
Slide showing SA55 available as a nasal spray that is supposed to be low cost and provide short-term prophylactics (3 sprays per day) with 8-12h protection per spray providing high neutralization in the mucosa. Image from: https://www.youtube.com/watch?v=OxpJM4gqwec
An unrolled one-page web view for this long thread that may be easier to read or share can be found here ( ). 3/
Read 32 tweets
Jan 8
#Virus update for Ottawa, #Canada (Jan 8, 2024)

#Wastewater levels in #Ottawa are extremely high and rising again with the JN.1 #Pirola variant now the most prevalent. #Hospitalization *for* #COVID-19 started declining just before the holidays but is increasing again.🧵1/
Graph of wastewater levels in Ottawa, Ontario. Weekly stats available at ( http://covid.gilchrist.ca/Ottawa.html )
Graph of # of people currently hospitalized *for* COVID-19 in Ottawa, Ontario. Weekly stats available at ( http://covid.gilchrist.ca/Ottawa.html )
Our young children are especially vulnerable to respiratory virus infections. In Ottawa, despite children age 0-11 only making up 11% of the population, they accounted for 46% of respiratory related Emergency Department visits the week of Dec. 24 ( ). 2/ ottawapublichealth.ca/en/reports-res…
Graph showing % of total respiratory related ED visits by week in Ottawa, Ontario with children <12 making up almost 50% of all visits despite being only 11% of the population. Weekly stats available at ( http://covid.gilchrist.ca/Ottawa.html )
RSV levels in Ottawa wastewater were declining but now seeing another increase, but Influenza A levels increased quickly and are now twice the peak of last year already. Influenza B is now being detected in very small amounts. 3/ Graph showing RSV levels decreased, Influenza A levels very high and low Influenza B wastewater levels in Ottawa, Ontario. Weekly stats available at ( http://covid.gilchrist.ca/Ottawa.html )
Read 12 tweets
Jan 6
#Variant update for #Ontario, #Canada (to Dec. 26, 2023)

The BA.2.86.* #Pirola clan of variants is now the majority of sequences at 56%. JN.1 Pirola has taken 1st place at 38% with HV.1 "Eris" down to 18%. The next closest is JG.3.2 "Eris" at 7%. Graph tools by @Mike_Honey_🧵1/

Sankey graph (height of each bar is # of sequences for that variant) showing top variants and their lineages over the past couple of months from PCR test genomic sequencing in Ontario, Canada. Visualization tool was created by @Mike_Honey_ ( https://app.powerbi.com/view?r=eyJrIjoiNzE5YzczODItMDQzMS00M2EzLWFjNWYtMjg3OTY3NTNhZDM3IiwidCI6ImRjMWYwNGY1LWMxZTUtNDQyOS1hODEyLTU3OTNiZTQ1YmY5ZCIsImMiOjEwfQ%3D%3D&pageName=ReportSection32240d6b62ba73667e98 )
Graph of top 7 COVID variant clans from PCR test genomic sequencing in Ontario, Canada. Visualization tool was created by @Mike_Honey_ ( https://app.powerbi.com/view?r=eyJrIjoiNzE5YzczODItMDQzMS00M2EzLWFjNWYtMjg3OTY3NTNhZDM3IiwidCI6ImRjMWYwNGY1LWMxZTUtNDQyOS1hODEyLTU3OTNiZTQ1YmY5ZCIsImMiOjEwfQ%3D%3D
Graph of top 7 COVID variants (JN.1, HV.1, JG.3.2, HV.1.6.1, HK.3, JD.1.1.1, JD.1.1) from PCR test genomic sequencing in Ontario, Canada. Visualization tool was created by @Mike_Honey_ ( https://app.powerbi.com/view?r=eyJrIjoiNzE5YzczODItMDQzMS00M2EzLWFjNWYtMjg3OTY3NTNhZDM3IiwidCI6ImRjMWYwNGY1LWMxZTUtNDQyOS1hODEyLTU3OTNiZTQ1YmY5ZCIsImMiOjEwfQ%3D%3D )
You can find weekly Ontario stats including variants at ( ) and ( ). 2/covid.gilchrist.ca/Ontario.html
gilchrist.great-site.net/jeff/COVID-19/…
Public Health Ontario got rid of their COVID data tool and replaced it with a respiratory virus tool making some of the previously reported data no longer available. 3/
Read 22 tweets
Jan 3
Particulate Matter (PM) pollution event happening in Ontario and Quebec right now!

It seems PM levels have risen a lot overnight and whatever this event is stretches from southern Ontario (Toronto) to Ottawa to Montreal. Read more about the Model X and how I measured this below.
Graph from co2.click portal showing the last 24 hours of particulate matter (PM) 1.0, 2.5, 4.0, and 10 levels in Ottawa measured with a Model X outdoor air quality monitor. More info at: https://co2.click/
Table of Contents and link to unrolled version of outdoor particulate matter (PM) air quality monitoring here ( ).
It is not just outside pollution you need to worry about, cooking inside can also generate PM pollution which you can see some examples here ( ).
Read 8 tweets
Dec 31, 2023
2023 in Review

In case you missed them the first time, I'm looking back at what I thought were the most educational threads that I wrote over the past year starting with the oldest. 🧵1/ Image of person turning wooden 2023 blocks over to 2024. Image from: https://pixevety.com/2023-a-year-in-review-navigating-challenges-embracing-innovation-and-shaping-the-future/
Why do people get (re)infected over and over again? COVID actively evades your immune system by suppressing parts of it to become invisible. Part 1 ( ) and Part 2 ( ). 2/
What actually happens inside your body when you are sick? It is important to understand your body and immune system. Part 1 ( ) and Part 2 ( ). 3/
Read 10 tweets

Did Thread Reader help you today?

Support us! We are indie developers!


This site is made by just two indie developers on a laptop doing marketing, support and development! Read more about the story.

Become a Premium Member ($3/month or $30/year) and get exclusive features!

Become Premium

Don't want to be a Premium member but still want to support us?

Make a small donation by buying us coffee ($5) or help with server cost ($10)

Donate via Paypal

Or Donate anonymously using crypto!

Ethereum

0xfe58350B80634f60Fa6Dc149a72b4DFbc17D341E copy

Bitcoin

3ATGMxNzCUFzxpMCHL5sWSt4DVtS8UqXpi copy

Thank you for your support!

Follow Us!

:(