1/ A bit of Waller and pre Vixperation gave the market a little excitement. Today last trading day for VIX. Let's see how the key levels can help you risk manage. While it is impossible to have 100% accurate models, we can still use them as support. Let's take a look 👀🧵
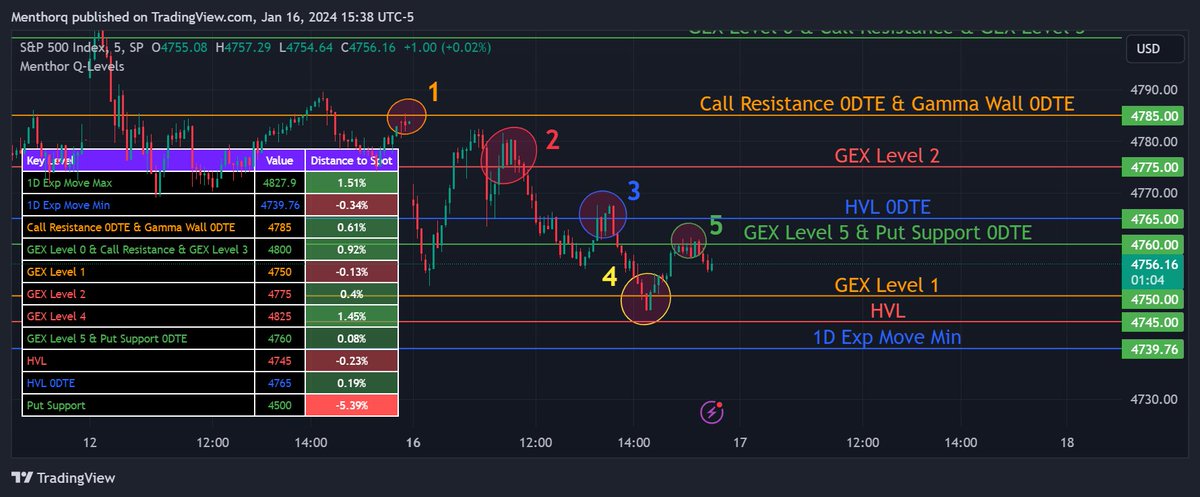
2/ Starting from (1). We opened right at the Call resistance 0DTE. We could also see from NetGex, OI and BMO volumes that that looked like a solid level for the market to bounce off. We wrote a thread about it yesterday
3/ Then (2) we moved to the GEX level 2. This is a key level but not a major level. It uses NetGex to identify secondary key levels. You can find more about these levels here. Ultimately when the price reaches one of these levels, we want to look at what volumes are doing around that particular strikes. Working on intraday data, that should help you with this. menthorq.com/guide/gex-leve…
4/ We then bounced on the ODTE HighVolLevel (3). That is a key ODTE level, and also a volatility level you want to follow closely. If you take the GEX for each strike and create a cumulative sum, you get a curve that gives you the total GEX up to that strike. This curve is the GEX profile. The High Vol Level tells you at which point the slope of the GEX profile changes from negative to positive. This article breaks it down for you menthorq.com/guide/high-vol…
5/ Next the market moved right next the (4) HVL. While the previous HVL was the 0DTE HVL, this is the monthly HVL. You can find the different volatility level by downloading the different maturity NetGex. This was the chart before we started trading this morning
6/ Finally, the market bounced right off that HVL, that acted like a big support. Those key levels generally do and it just closed to the day (5) on the last GEX level. Hope these threads help you better understand our models and how you can use them to support your data driven decision making
• • •
Missing some Tweet in this thread? You can try to
force a refresh
1/ SPX is in negative gamma. What does that mean? Let's understand the difference between Positive and Negative Gamma. Gamma conditions significantly influence investment strategies and risk exposure. Let's delve into how these conditions affect market dynamics and trading decisions Let's review tonight 🧵👇
2/ Market Makers and Gamma. MM profit not from directional moves but from trade spreads. Their delta hedging varies based on whether they are in a positive or negative gamma condition
3/ Positive gamma is typically associated with long options positions, for example long calls or long puts. The same can be said for multi-leg strategies. Long Straddles or Strangles and Long Options spreads are positive gamma. When your strategy is long gamma, you benefit from spot price moments. Gamma scalping is an example of a strategy that benefits from a positive gamma condition.
1/ A quick look at Gamma in Options including for 0DTE to close the day. Gamma is a crucial Greek in options trading (we all know that at this point), indicating how sensitive an option's delta is to changes in the underlying asset's price. Let's explore the key factors affecting gamma next 🧵
2/ Strike Price vs. Spot Price. Gamma is highest for ATM options, as they are highly sensitive to spot price changes. Far OTM options, with a delta near 0%, show little to no gamma. Simple chart 👇
3/ ATM Options and Gamma. ATM options, hovering around a 50% delta, react significantly to even slight changes in the spot price. This heightened sensitivity results in higher gamma. Another simple chart here
1/ 📉 Long Weekend Education Thread: What is the Volatility Smile? The volatility smile shows how implied volatility changes across different strike prices for options with the same underlying asset and expiration. It's a key concept in options trading 🧵
2/ 📊 Characteristics of the Smile. This pattern arises as IV increases for options that are deep In-The-Money (ITM) or Out-of-The-Money (OTM), while it's generally lower for At-The-Money (ATM) options.
3/ 📈 Equity Smile Curve For equities, the left side of the smile curve (representing OTM puts) often steepens. This reflects market fears and a rush to buy protective puts in downturns, spiking IV
1/ 📊💰 Exploring the Hottest Options Trade of 2023: 0DTE (Zero-Day to Expiration) 🚀
Wall Street's "quant" community is buzzing about the latest trend in options trading: 0DTE derivative contracts. These contracts have zero days to expiration and have gained immense popularity among banks and investors alike.
We summarized this BB article in this thread, some interesting takes 🧵
2/ Wall Street's Embrace: Banks like Citigroup, JPMorgan Chase, and UBS, which specialize in developing systematic equity products, have jumped on the 0DTE bandwagon. Teams responsible for quantitative investment strategies (QIS) have started incorporating 0DTE options into their portfolios.
3/Liquidity and Acceptance: 0DTE options have seen rapid acceptance due to their liquidity and versatility. They are used for everything from low-cost volatility bets to portfolio diversification. Professional investors are leveraging bespoke 0DTE strategies.
1/ 🚨 VVIX/VIX: we are seeing a big widening of these two indicators. What do we make of this? Let's see what this is and also look at our model to find some interesting data before Monday open
2/ First the basics, the VIX index measures the market's expectation of 30-day volatility implied by S&P 500 index options, while the VVIX index measures the volatility of the VIX itself, or the volatility of the 30-day implied volatility. What could a gap between the two mean?
3/ a low VIX with a high VVIX might suggest that the market is calm but could become volatile. Looking at the NetGex for the VIX, we do see an accumulation of calls after having had put bid for the entire week. Also total
1/ As the market opens tomorrow, we will be in negative gamma - MM are short gamma. Since these will be bumpy times, let's just re-visit some important concepts, because you will have to be on top of your risk management in the next few weeks 🧵
2/For MM to be short gamma, investors have to buy options. To stay delta hedged in negative gamma, MM sell underlying. As investors buy more options, IV increases, that decreases market gamma creating a new exposure to MM: vanna, and that has to be hedged just like gamma
3/Drop in price like we have seen recently, gets investors to buy OTM puts. This creates more negative gamma. MM have to sell more to stay delta hedged as price move down. That leads to more volatility and MM have to keep selling to hedge vanna.