
Here was my Senate 2020 forecast vs 538.
Our forecasts were similar in shape but I had much, much higher percentages in the middle.
They, as usual, have indefensible Astrapia tails which say, basically, there's about 1/5 chance that events of the 1/50 magnitude will happen.
Our forecasts were similar in shape but I had much, much higher percentages in the middle.
They, as usual, have indefensible Astrapia tails which say, basically, there's about 1/5 chance that events of the 1/50 magnitude will happen.
https://twitter.com/RealCarlAllen/status/1363899677662445569
And here is 2020 vs 2022.
This time, not only are their tails crazy wide (1/5 chance highly unlikely events happen) the shapes of our forecasts are very different
In simplest terms, they thought Rs should be favored bc of PA and GA, and Ds only slightly favored in AZ and NH
This time, not only are their tails crazy wide (1/5 chance highly unlikely events happen) the shapes of our forecasts are very different
In simplest terms, they thought Rs should be favored bc of PA and GA, and Ds only slightly favored in AZ and NH


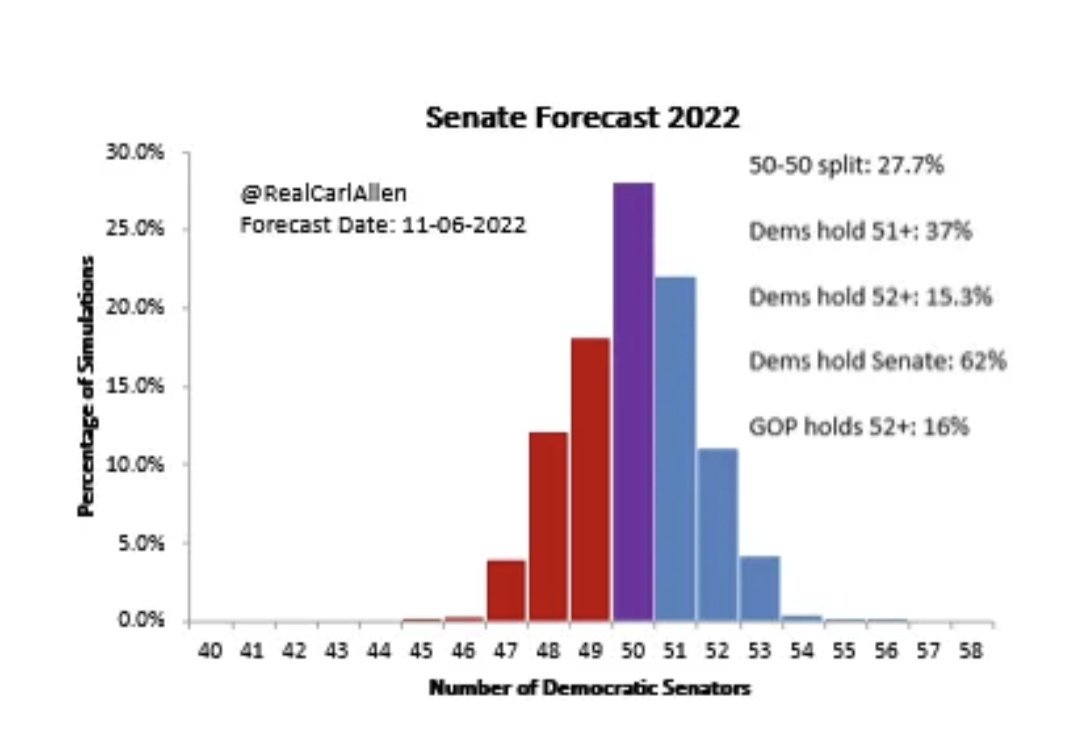
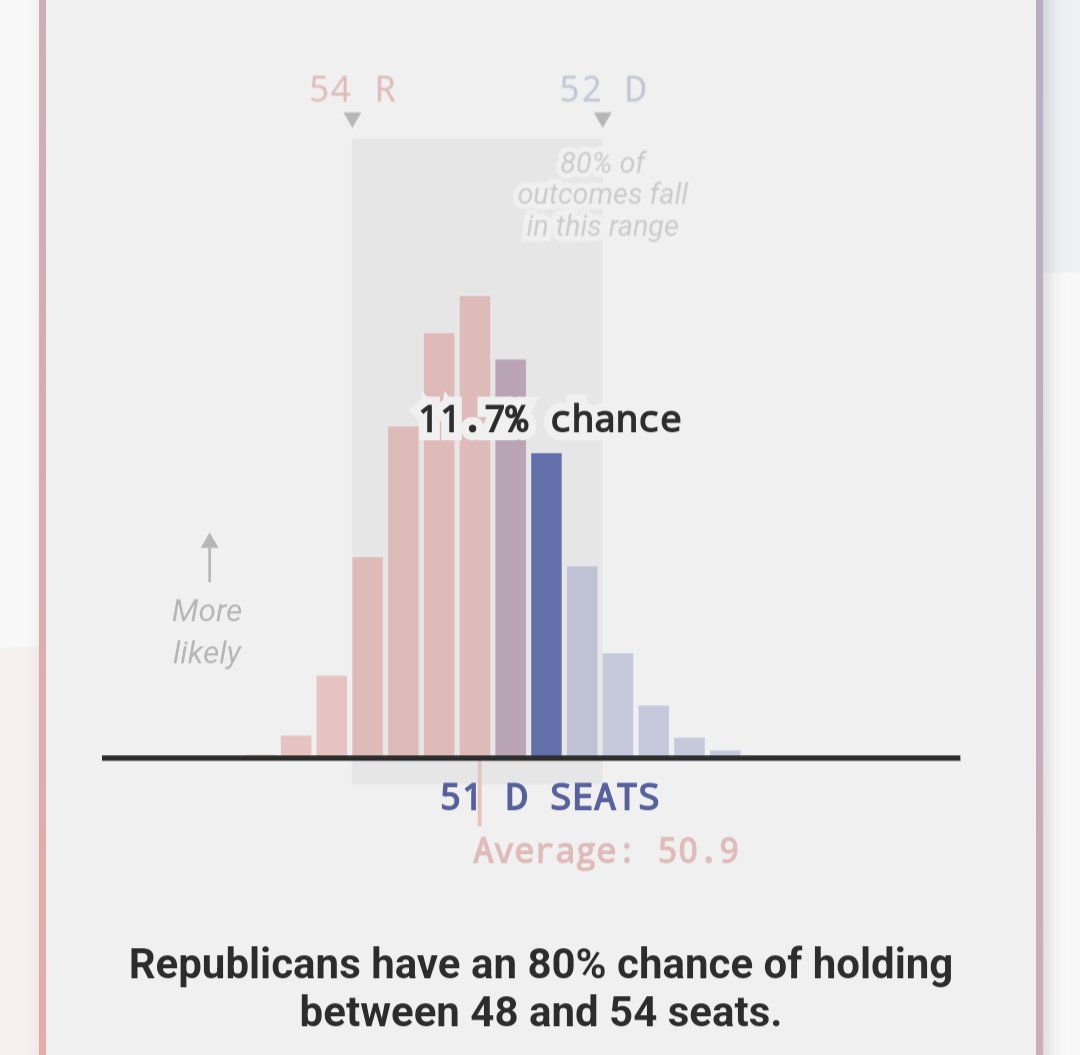
In 2022's case, you can look at the side-by-side of the percentages of the actual outcome (D51)
538: 11.7%
Carl: 22%
538: 11.7%
Carl: 22%


Ah yes. But the narrow win Nevada, less than 1%. Could've easily gone R.
That doesn't help 538's case.
I considered D50 the most likely outcome (and Nevada the closest race, as did they)
The difference?
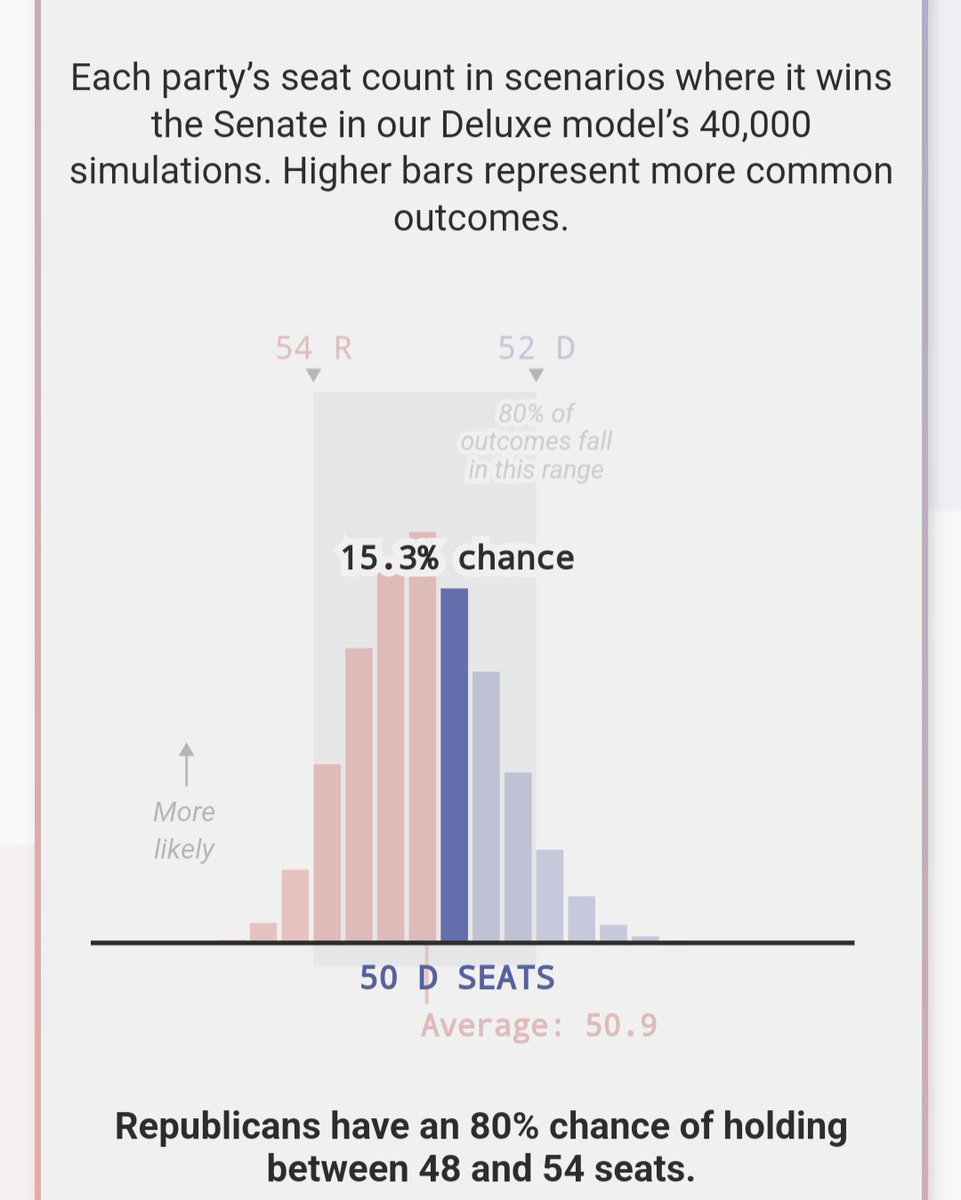
538: 15.3%
Carl: 28%
That doesn't help 538's case.
I considered D50 the most likely outcome (and Nevada the closest race, as did they)
The difference?
538: 15.3%
Carl: 28%
As a matter of fact, compare them side-by-side and consider:
Every single race could have been 2% more R
And what happens?
The only state whose results change is Nevada
That is, I would need to grant @FiveThirtyEight's forecast a 2 point spread and mine would still be better
Every single race could have been 2% more R
And what happens?
The only state whose results change is Nevada
That is, I would need to grant @FiveThirtyEight's forecast a 2 point spread and mine would still be better


@FiveThirtyEight Let's take it a step further.
Let's do something crazy.
Let's just arbitrarily give Rs 4% more in every single 2022 Senate race.
The only changes would be:
Nevada
Georgia
That's it.
In order for 538's modal outcome (D49) to hit, they would have needed a 4 point handicap.
Let's do something crazy.
Let's just arbitrarily give Rs 4% more in every single 2022 Senate race.
The only changes would be:
Nevada
Georgia
That's it.
In order for 538's modal outcome (D49) to hit, they would have needed a 4 point handicap.


@FiveThirtyEight Ready for the punchline?
Look at the charts again.
Look at my D49 (my 3rd most likely outcome) compared to their D49 (their 1st most likely outcome)
Notice anything interesting?
Look at the charts again.
Look at my D49 (my 3rd most likely outcome) compared to their D49 (their 1st most likely outcome)
Notice anything interesting?

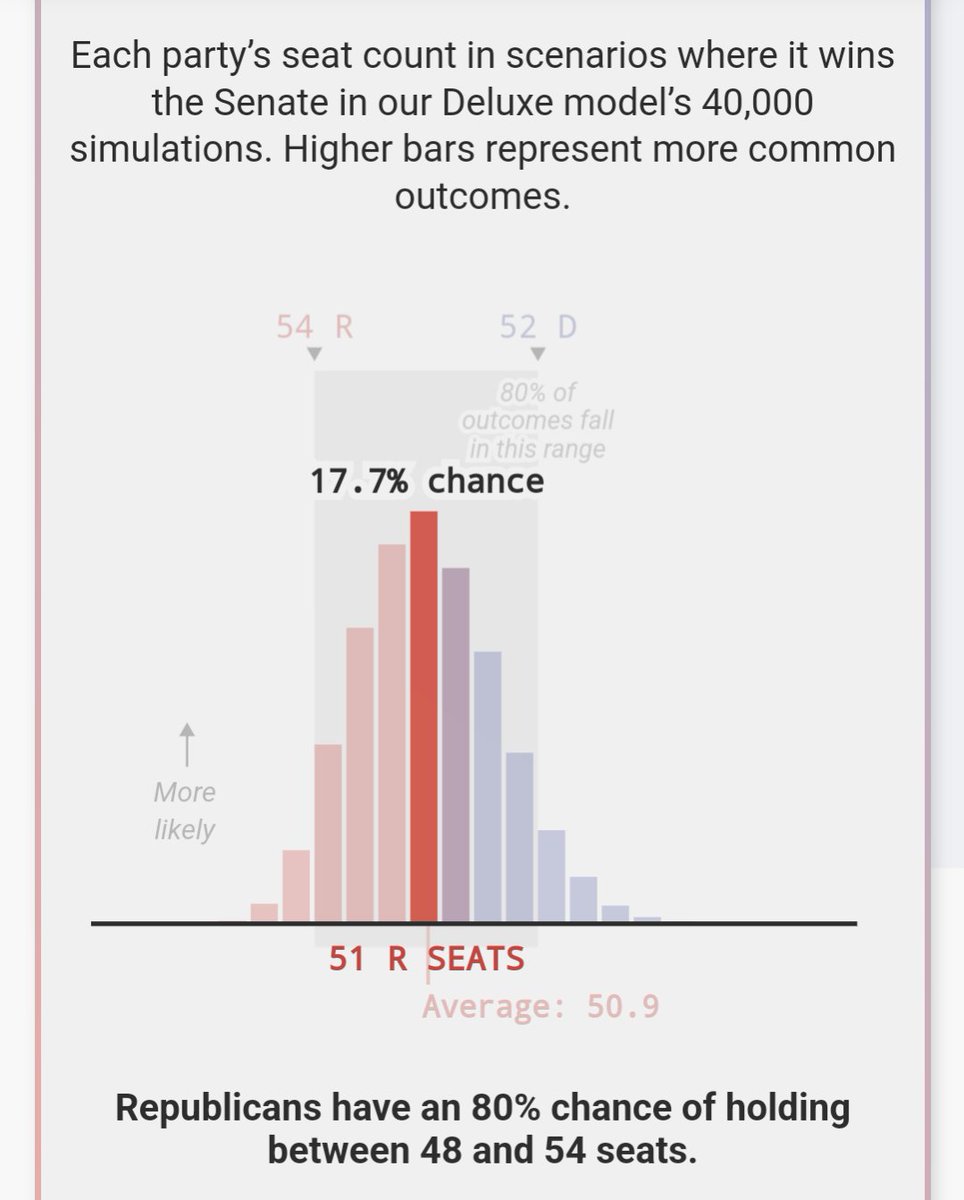
@FiveThirtyEight Arbitrarily giving Rs in every state a FOUR POINT advantage would have ended at D49.
My probability of D49? 17.5%
538 probability of D49? 17.7%
538s forecast handicap to (barely) be better than mine: 4%.
There's a Happy Gilmore quote that goes here that I'll resist.
My probability of D49? 17.5%
538 probability of D49? 17.7%
538s forecast handicap to (barely) be better than mine: 4%.
There's a Happy Gilmore quote that goes here that I'll resist.


@FiveThirtyEight There's, I hope, a lesson to be learned here (with details that I'll spare for a more academic setting)
When you "overprice" highly unlikely events (calling a 1% possibility 2%, calling a 2% possibility 4%) there's a domino effect:
It leeches from the more probable outcomes.
When you "overprice" highly unlikely events (calling a 1% possibility 2%, calling a 2% possibility 4%) there's a domino effect:
It leeches from the more probable outcomes.
@FiveThirtyEight That is not to say tails this wide are not valid, or are never applicable.
The debate is whether or not those tails are justified in this case.
Fortunately, given probabilities, we can quite easily test them.
The debate is whether or not those tails are justified in this case.
Fortunately, given probabilities, we can quite easily test them.
@FiveThirtyEight They said "80% chance Rs hold between 48 & 54 seats"
That is (translating to my forecast parlance)
D46 + D47 + D48 + D49 + D50 + D51 + D52 ~ 80%
Or, in other words, none of the above had ~20% chance
Which is why I said "they give highly unlikely events a 1/5 chance to happen"
That is (translating to my forecast parlance)
D46 + D47 + D48 + D49 + D50 + D51 + D52 ~ 80%
Or, in other words, none of the above had ~20% chance
Which is why I said "they give highly unlikely events a 1/5 chance to happen"


@FiveThirtyEight So to compare again apples-to-apples:
538 said there was a 20% chance that Dems ended up with 53+ seats OR that Rs ended up with 55+ seats.
1/5.
I'll do the math on that joke in a minute.
For comparison, I said there was only a 10% chance that Ds OR Rs ended with 53+ seats
538 said there was a 20% chance that Dems ended up with 53+ seats OR that Rs ended up with 55+ seats.
1/5.
I'll do the math on that joke in a minute.
For comparison, I said there was only a 10% chance that Ds OR Rs ended with 53+ seats


@FiveThirtyEight Let's look at what I had in the "1/10" possibility range.
Dems would've needed to flip both Wisconsin and North Carolina.
That would require 3.3% in those states to favor Ds
Rs would've needed Nevada, Georgia, Arizona, and Pennsylvania
That would require about 5% to favor Rs
Dems would've needed to flip both Wisconsin and North Carolina.
That would require 3.3% in those states to favor Ds
Rs would've needed Nevada, Georgia, Arizona, and Pennsylvania
That would require about 5% to favor Rs
@FiveThirtyEight Whether or not you think a unidirectional 3.3%+ move across the board (D53)
Or a unidirectional 5%+ move (R53) is in the 10% probability range
Is a debate reasonable people can have.
I think it was and is extremely accurate.
Or a unidirectional 5%+ move (R53) is in the 10% probability range
Is a debate reasonable people can have.
I think it was and is extremely accurate.
@FiveThirtyEight But now the fun part
Let's dream up some scenarios that would hit outside 538's 80% window
Again, all together, these are said to be about 1/5 to happen
R55 would have required:
NV (lost by 1)
GA (lost by 3)
AZ and PA (lost by 5)
NH (lost by 9)
And that's still not enough!
Let's dream up some scenarios that would hit outside 538's 80% window
Again, all together, these are said to be about 1/5 to happen
R55 would have required:
NV (lost by 1)
GA (lost by 3)
AZ and PA (lost by 5)
NH (lost by 9)
And that's still not enough!
@FiveThirtyEight Remember 538's window (only ~80% and not ~90% like mine)
Should be far more inclusive of likely outcomes
Asking me to predict something with 90% confidence should require far wider "error bars" than 80%*
If forecasts are equally good*
Yet
THEY WOULD'VE NEEDED 15% to hit R55
Should be far more inclusive of likely outcomes
Asking me to predict something with 90% confidence should require far wider "error bars" than 80%*
If forecasts are equally good*
Yet
THEY WOULD'VE NEEDED 15% to hit R55
@FiveThirtyEight This is a very long thread to say something people who follow me for sports betting know well:
If someone says something is about 1% to happen, but it is actually 3% to happen (or vice versa)
That's not negligible. You can make a lot of money, in fact, if you're right.
If someone says something is about 1% to happen, but it is actually 3% to happen (or vice versa)
That's not negligible. You can make a lot of money, in fact, if you're right.
@FiveThirtyEight But nature of political forecasts is that events interconnect
Some unlikely thing happening makes some other unlikely thing more likely to happen, and so on
Arbitrarily granting 5% to one side isn't a far-fetched test. There's strong state-to-state correlation in elections
Some unlikely thing happening makes some other unlikely thing more likely to happen, and so on
Arbitrarily granting 5% to one side isn't a far-fetched test. There's strong state-to-state correlation in elections
@FiveThirtyEight In a forecast, this overrating the possibility of an outlier event causes their model to say the most probable causes are far less probable than they actually are
IOW, a 3-5% swing (unlikely but far from impossible) is in my forecast what a 10-15% swing is to theirs
Not good!
IOW, a 3-5% swing (unlikely but far from impossible) is in my forecast what a 10-15% swing is to theirs
Not good!
@FiveThirtyEight That they had the wrong favs in PA, GA, and EXTREMELY UNDERCONFIDENT in AZ & NH is a different topic
That I nailed the "if forced to make a call?" is also a different topic.
A whole lot of simple errors leading to the "best" forecasters being very bad
That I nailed the "if forced to make a call?" is also a different topic.
A whole lot of simple errors leading to the "best" forecasters being very bad
https://x.com/RealCarlAllen/status/1587508889670586370?t=Z7UBeorrQnsSjCeu_jdlew&s=19
@FiveThirtyEight Xwitter is an absolute treasure chest of me calling my shots and nailing them
https://x.com/RealCarlAllen/status/1587512113555283969?t=Z7UBeorrQnsSjCeu_jdlew&s=19
@FiveThirtyEight @threadreaderapp unroll
• • •
Missing some Tweet in this thread? You can try to
force a refresh


