Jurrien Timmer Profile picture
Jan 16 5 tweets 2 min read Read on X
What we don’t know: how much will the Fed ease, and will it be for the wrong reasons?🧵
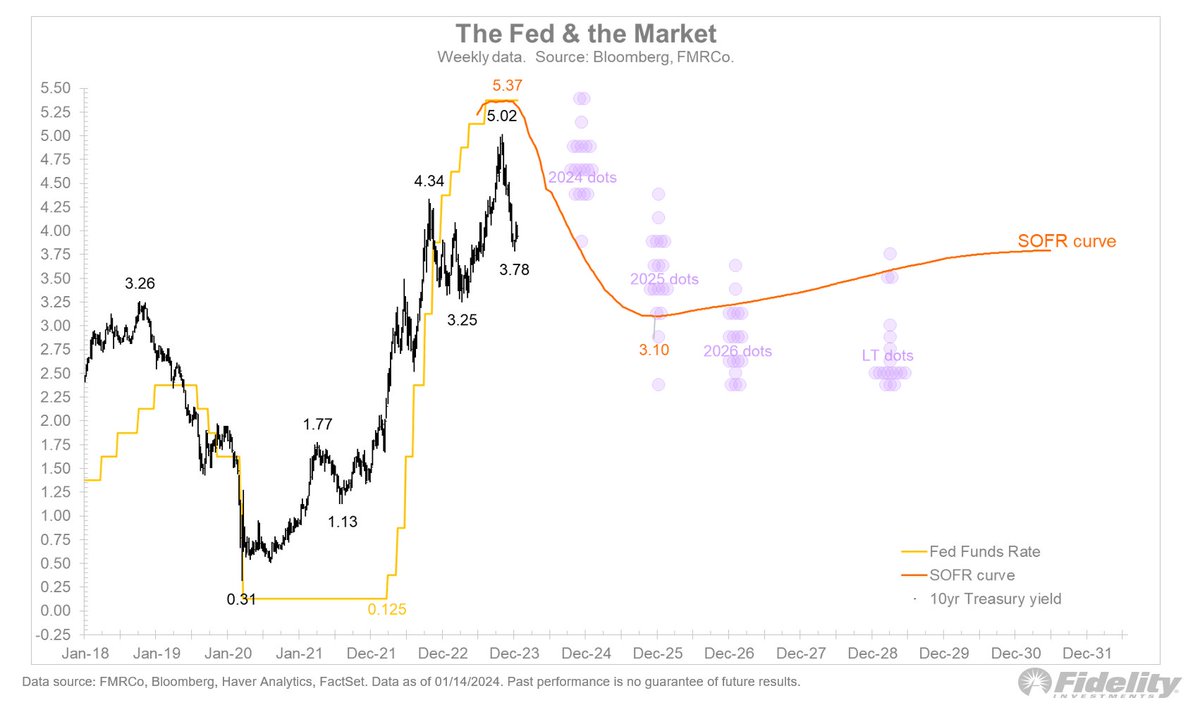
An easing bias doesn’t tell us when the rate cuts are coming or how many there will be. In my view, the market is a bit delusional in expecting 6 or 7 rate cuts this year, unless we get a recession. But the stock market is priced for a soft landing, which doesn’t reconcile with the bond market’s view on rates. Somebody is wrong, and my guess is that it’s the bond market. /2Image
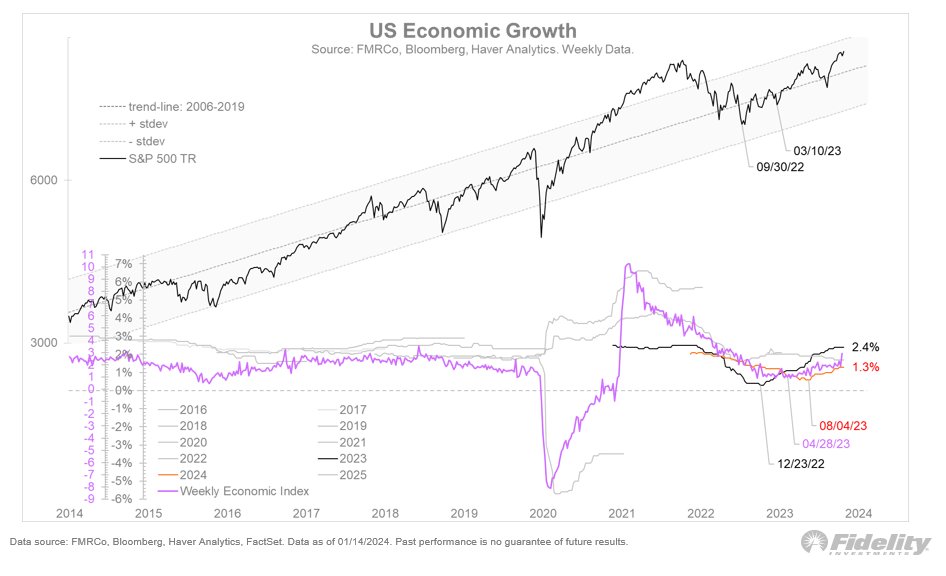
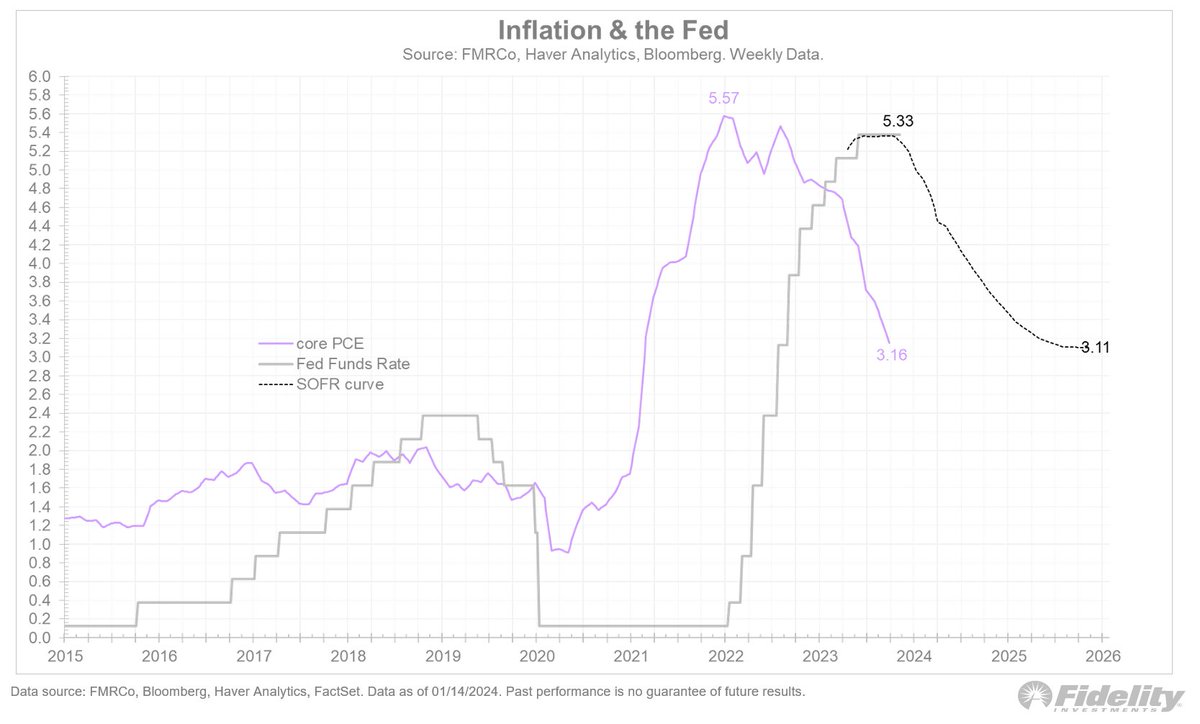
With core-PCE at 3.2% and the forward curve dipping to 3.1%, the market is essentially saying that the Fed will drop real rates to zero. A zero real rate in a soft landing makes little sense, unless inflation keeps dropping (which could happen of course). /3 Image
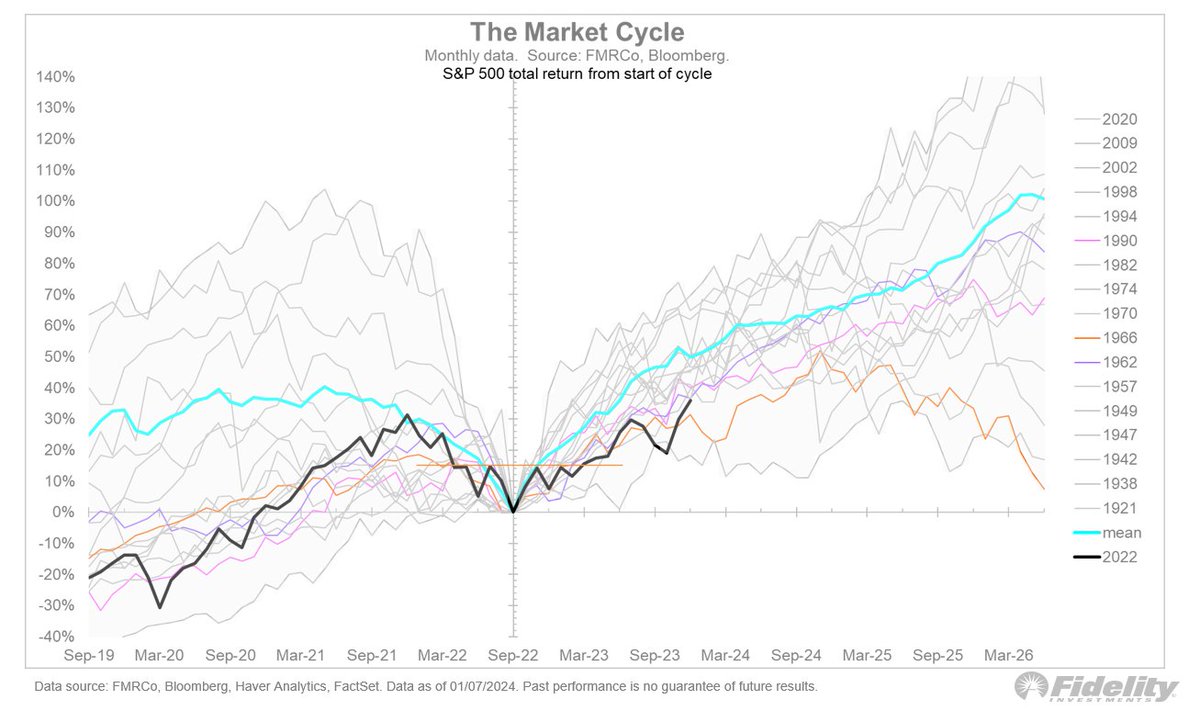
If the Fed has stuck the (soft) landing and drops rates back towards neutral, that bodes well for equities and supports the narrative of a bullish broadening in 2024. But as the chart shows below, the range of outcomes for the S&P 500 index following the last tightening is all over the place. It’s a messy playbook. /4Image
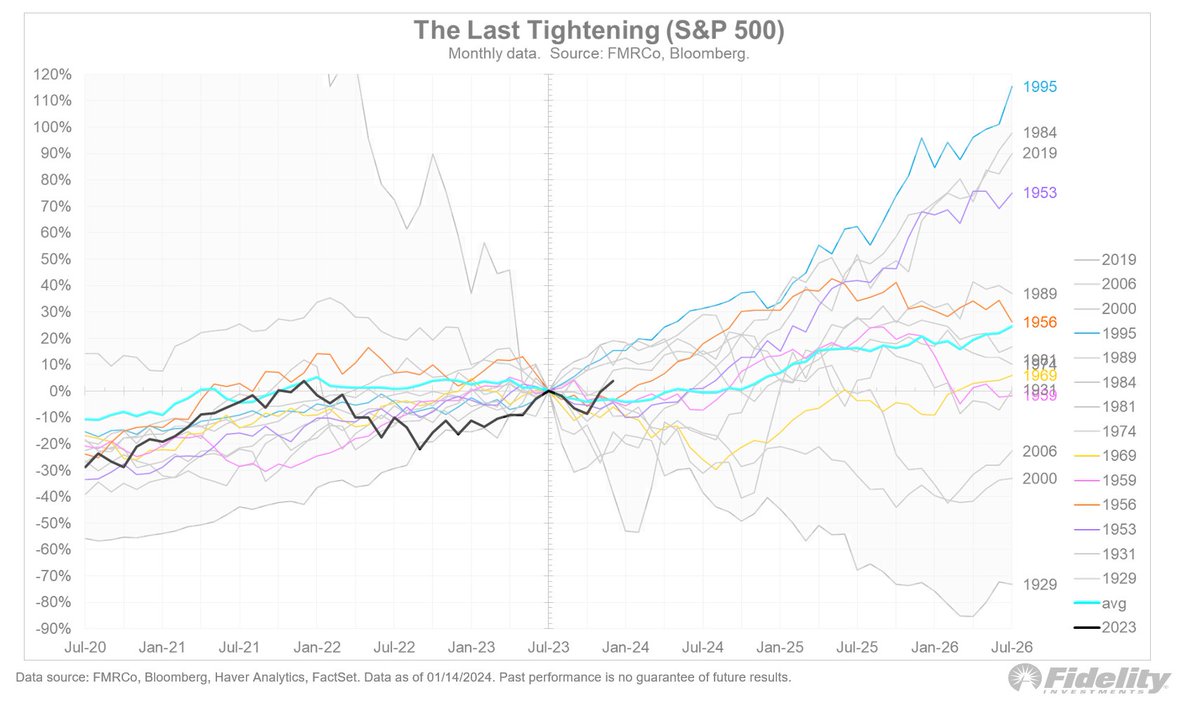
For now, Goldilocks is winning the battle, and with the Fed pivoting the market is taking a page from the 1994-1995 cycle. /END Image

• • •

Missing some Tweet in this thread? You can try to force a refresh
 

Keep Current with Jurrien Timmer

Jurrien Timmer Profile picture

Stay in touch and get notified when new unrolls are available from this author!

Read all threads

This Thread may be Removed Anytime!

PDF

Twitter may remove this content at anytime! Save it as PDF for later use!

Try unrolling a thread yourself!

how to unroll video
  1. Follow @ThreadReaderApp to mention us!

  2. From a Twitter thread mention us with a keyword "unroll"
@threadreaderapp unroll

Practice here first or read more on our help page!

More from @TimmerFidelity

Jan 17
My previous post assumes that the earnings cycle has bottomed and that we are not about to get blindsided by that recession that we were all expecting a year ago, but which so far hasn’t materialized. If it does make an appearance in 2024, then earnings could get hit, leaving this market cycle (driven by a 6-point P/E expansion) over its skis. 🧵
The yield curve has been signaling exactly such an outcome, but that signal is notoriously difficult to translate into an actionable playbook. The outcomes, both in terms of magnitude and timing, are all over the place, much like the “last tightening” playbook mentioned earlier. /2Image
While the yield curve inversion needs to be respected, so far things have been different this time (famous last words). This chart shows the Fed’s Weekly Economic Index (purple) and consensus GDP estimates. You can see the inflection point from weaker growth to stronger growth last spring. Was that the soft landing? That’s what the stock market is counting on. /3Image
Read 5 tweets
Jan 16
Well, the moment finally came last week, which is very exciting to say the least. Will this be a new chapter towards Bitcoin’s widespread adoption as a commodity-currency? 🧵
It seems that way, although it could take some time to get there. For now, Bitcoin has made it to the middle of what I consider to be its fair value band, driven by the growth rate of its network and the level of real rates. /2 Image
The short-term question is whether this a sell-the-news moment. My guess is that it will take a little time to consolidate the recent gains, now that the big moment has arrived. Why? The chart below suggests that there were more than a few participants who “equitized” future spot positions through either the futures market or Bitcoin-sensitive equities. /3Image
Read 6 tweets
Jan 11
For US stocks, the valuation question (relative to the rest of the world) comes down to the secular leadership of the big growers in the US stock market. By my count we are now in year 14 of this secular bull market (since March 2009), and it seems to be going strong.🧵
In real terms, the S&P 500 is up 476% from the March 2009 low, which is in line with both the 1949-1968 and 1982-2000 super-cycles. /2 Image
A good chunk of that performance comes down to free cash flow (FCF) and margins, which are driven in part by financial engineering. Since the 2009 low, the new supply of equities (via IPOs and secondaries) totals $2.6 trillion, but the internal demand (just from the corporates themselves) is close to $20 trillion. That’s half the market cap of the S&P 500. /3
Read 6 tweets
Jan 10
We know that market breadth has been narrow, and one of the big questions for 2024 is whether the market will broaden, and whether that can happen in a rising market (OK, that’s two questions).🧵
The chart below shows that the market has now advanced 37% from the October 2022 low, but that only 26% of the stocks in the S&P 500 are beating the index. That’s a very small pond to fish from. /2 Image
At the helm of that narrow 26% are of course the Mag 7. They have been driving the bus for nine years now, which is a very long time. While from the perspective of magnitude and duration we seem to be poised for a rotation, the one missing link is a valuation extreme. /3
Read 7 tweets
Jan 9
In all likelihood the bear market for equities started two years ago on January 4th, 2022, and at least the cap-weighted index is within spitting distance of its all-time high. That leaves the early cycle bull market narrative on track, per the chart below, but not before the thesis got challenged last fall. Until recently, this was a tentative bull, but after the last few months of gains we are getting on-trend. 🧵Image
Much of the gains since the October 2022 low have been driven by multiple-expansion, as is typically the case in an early-cycle bull market. /2
On average, the first year of a bull market produces a 40-50% P/E-expansion as the market anticipates the earnings bottom that typically follows a few quarters after the low. As the next chart shows, we have reached that point of maximum P/E expansion, which means that it will be up to earnings to carry the load from here, potentially allowing valuations to normalize. /3Image
Read 6 tweets
Jan 8
Two years ago was a tough time to start investing. Back in 2021 the P/E ratio for the S&P 500 was 29x and the “P/E” (inverse of yield) on the 10-year Treasury note was 300x “based on intra-day high”. That means that investors who dipped their toes in the market for the first time had to pay 29 dollars for every dollar of earnings and 300 dollars for every dollar of interest payments. Starting points matter. 🧵Image
Then came the reset in 2022, and bonds went to 20x while equities briefly went to 15x. This created a more level playing field for investors, but also painful losses for those already in. Now, after the rallies of late 2023, bonds are trading at 25x and equites at 21x. So where do we go from here? /2
As the periodic table shows below, at first glance there doesn’t seem to be a lot of rhyme or reason in terms of what leads when and for how long. That’s more or less the point of showing this table to investors, to remind them that picking winners and losers is hard, and to be diversified. /3Image
Read 4 tweets

Did Thread Reader help you today?

Support us! We are indie developers!


This site is made by just two indie developers on a laptop doing marketing, support and development! Read more about the story.

Become a Premium Member ($3/month or $30/year) and get exclusive features!

Become Premium

Don't want to be a Premium member but still want to support us?

Make a small donation by buying us coffee ($5) or help with server cost ($10)

Donate via Paypal

Or Donate anonymously using crypto!

Ethereum

0xfe58350B80634f60Fa6Dc149a72b4DFbc17D341E copy

Bitcoin

3ATGMxNzCUFzxpMCHL5sWSt4DVtS8UqXpi copy

Thank you for your support!

Follow Us!

:(