Crémieux Profile picture
Jan 20 5 tweets 2 min read Read on X
How long should you wait between pregnancies?

Many studies suggest short timeframes are bad.

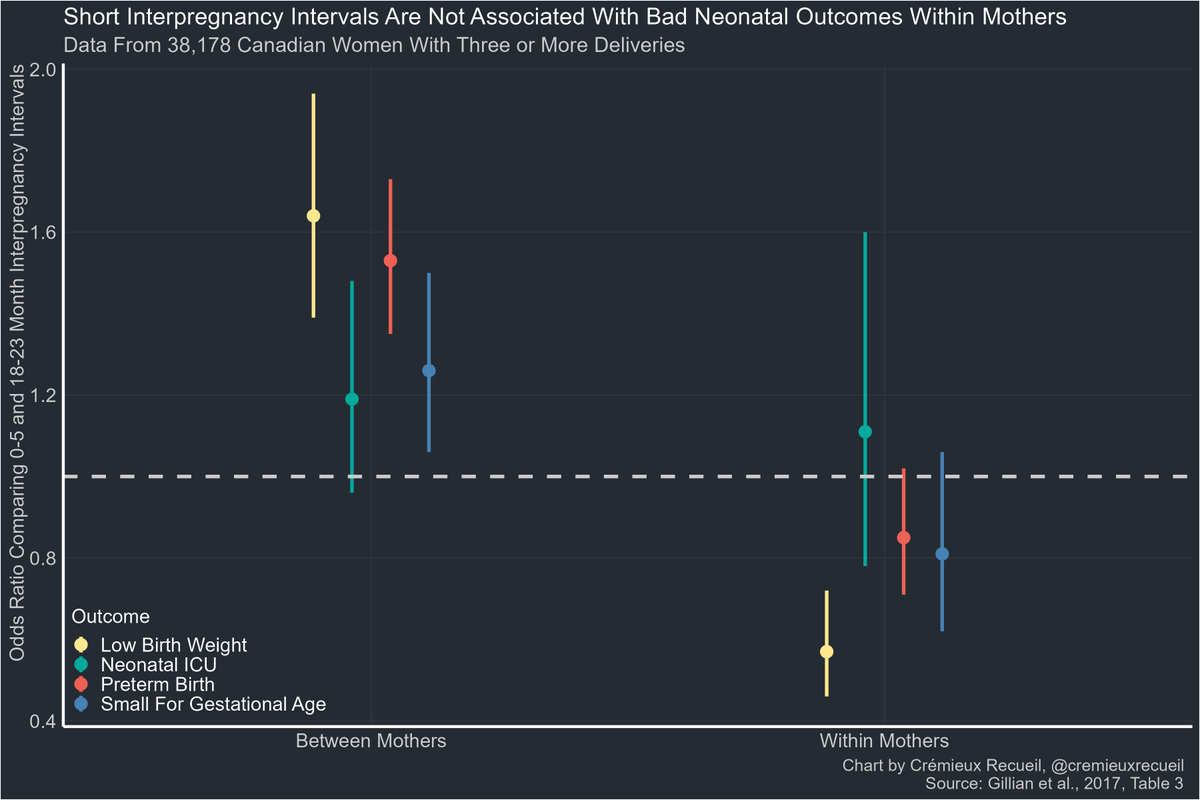
But those look at effects between mothers. Estimating the effect within mothers by looking at the same mothers over time, short interpregnancy intervals don't seem bad🧵Image
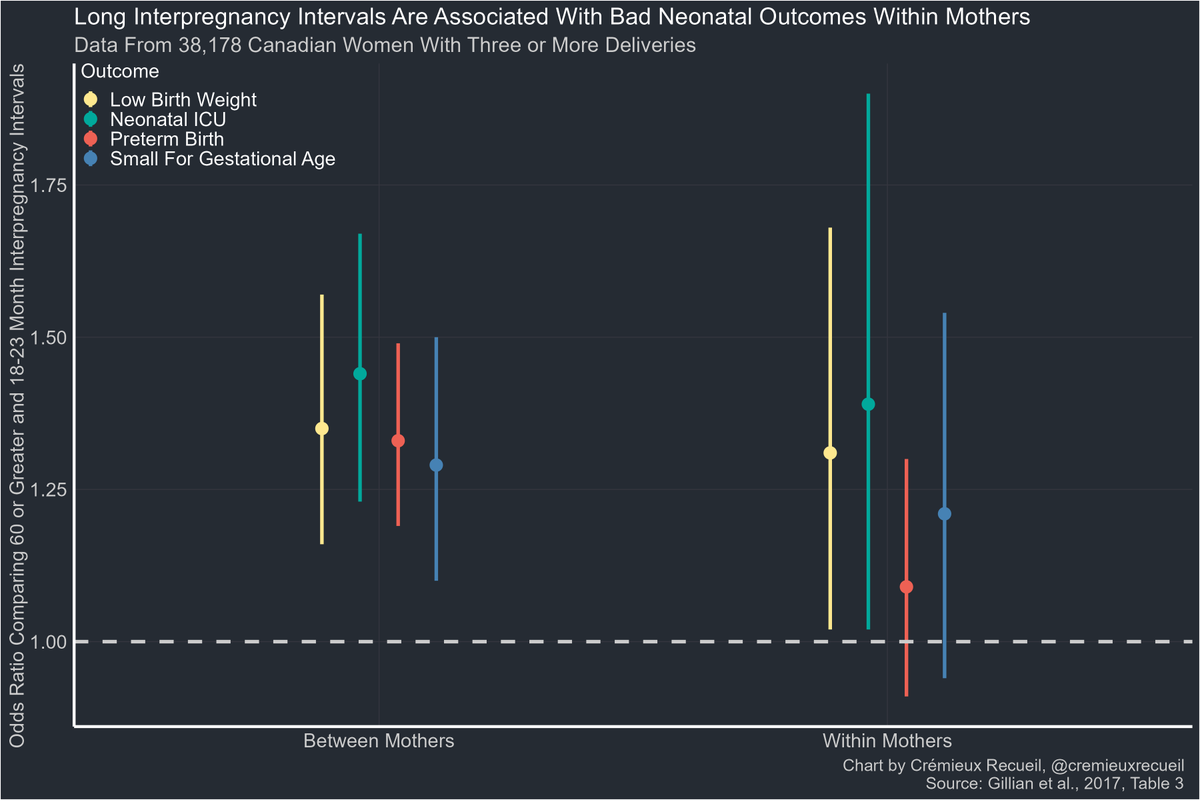
On the other hand, long interpregnancy intervals do seem bad.

I think this one might be down to aging. The estimates are corrected for maternal age, but that doesn't seem like a correction that should work well within mothers.Image
Now we can also look at the relationships between maternal characteristics and short interpregnancy intervals.

As it turns out, it's fairly consistently more obese women who get pregnant quickly. That suggests selection matters! Image
The differences (between/within) in the estimated effects of a short interval were significant excepting neonatal ICU usage. For long intervals, there were no significant differences between/within.

For maternal characteristics, selection was indicated between/within. The design doesn't let us speak to causal effects on gestational diabetes and preeclampsia, but we know the baby doesn't just make people obese at the beginning of pregnancy, while obesity is a risk factor for the other two conditions.

• • •

Missing some Tweet in this thread? You can try to force a refresh
 

Keep Current with Crémieux

Crémieux Profile picture

Stay in touch and get notified when new unrolls are available from this author!

Read all threads

This Thread may be Removed Anytime!

PDF

Twitter may remove this content at anytime! Save it as PDF for later use!

Try unrolling a thread yourself!

how to unroll video
  1. Follow @ThreadReaderApp to mention us!

  2. From a Twitter thread mention us with a keyword "unroll"
@threadreaderapp unroll

Practice here first or read more on our help page!

More from @cremieuxrecueil

Jan 20
It's hard to predict or explain why test questions might be biased.

So here are eight biased questions from a British internal medicine exam and the ways they were biased.

This one was favored high-scoring females over high-scoring males but there was no bias among low scorers. Image
This one consistently favored Whites over non-Whites. Image
This one favored high-scoring females over high-scoring males, but there was no difference for low-scorers. Image
Read 12 tweets
Jan 19
Paper and pencils ready.

It's time to take the Black Intelligence Test of Cultural Homogeneity.

First question: Image
Image
Image
Read 27 tweets
Jan 7
The New York times has just published a story supporting standardized testing.

Thread Image
The story says admissions officers can't distinguish talented students based on grades alone.

This is true! Grades from schools and classes with different levels of rigor aren't comparable. Test scores are. Image
The story says test scores predict better than grades.

That's true! Cognitive skills matter a lot, and though noncognitive skills do too, hard work without talent doesn't have the same payoff. Image
Read 12 tweets
Jan 6
Radiant Energy Group recently published a massive international survey of opinions on nuclear energy.

It's full of some things you might already know, but it also contains some surprises🧵

For example, did you know French and German nuclear support isn't that different? Image
Nuclear does have less support than other green technologies, but in most places, it still receives net support. Image
This apparently low level of support looks higher when survey participants are asked about their ranked supported for different energy sources. Image
Read 12 tweets
Dec 19, 2023
Poverty and crime.

In the public imagination, these things go hand-in-hand.

But the link between poverty and crime is much weaker than people might imagine. It might not even be causal.

A new lottery study shows us just that:

🧵 Image
To understand the causes of crime, there are other things you need to understand first.

For example, you need to understand the roles of sex and age.

In the whole country the lottery study results came from, you get this result when you plot both variables. Image
The collapse in criminal offending from adolescence is the crux of the "age-crime curve". The gap between men and women that declines with age is another important part.

Unlike age and crime, income and crime are nonlinearly related: after a certain level, income barely matters. Image
Read 25 tweets
Dec 17, 2023
The ACT has released their scores for 2023, so I thought I'd put everything in familiar terms and make some plots.

This thread will include lots of pictures!

So, how did everyone do nationally? Image
Differences were fairly typical.

Assuming Whites had a mean of 100 and an SD of 15

- Asians had a mean of 107.26 and an SD of 21.58
- Blacks had a mean of 86.20 and an SD of 12.54
- Hispanics had a mean of 90 and an SD of 15.21

Here are their scaled densities: Image
But we know that state-level participation rates and scores are correlated, so taking the ACT is selective.

However, in a few states, every kid took the ACT. These were Alabama, Kentucky, Louisiana, Mississippi, Nevada, Oklahoma, Tennessee, and Wyoming.

So, how did they do? Image
Read 17 tweets

Did Thread Reader help you today?

Support us! We are indie developers!


This site is made by just two indie developers on a laptop doing marketing, support and development! Read more about the story.

Become a Premium Member ($3/month or $30/year) and get exclusive features!

Become Premium

Don't want to be a Premium member but still want to support us?

Make a small donation by buying us coffee ($5) or help with server cost ($10)

Donate via Paypal

Or Donate anonymously using crypto!

Ethereum

0xfe58350B80634f60Fa6Dc149a72b4DFbc17D341E copy

Bitcoin

3ATGMxNzCUFzxpMCHL5sWSt4DVtS8UqXpi copy

Thank you for your support!

Follow Us!

:(