JayneshKasliwal Profile picture
Jan 22, 2024 9 tweets 4 min read Read on X
Techno Funda Stock Selection Critera

A thread to pick stocks moving 20-30% in a week🧵
( Chartink link at the end of tweet )
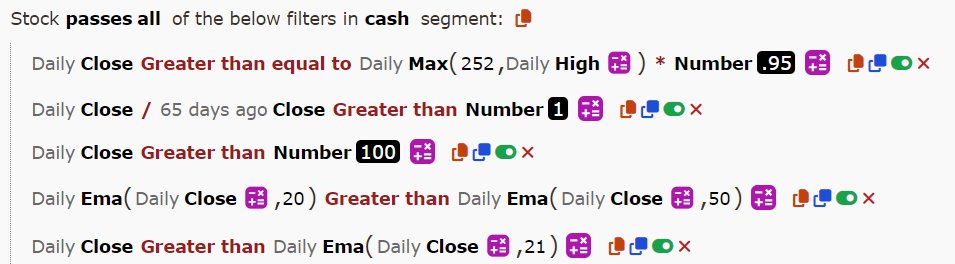
Technical Criteria
1. Stock near 5% of 52 week high
2. Stock above 30 weekly ema : Stage 1 uptrend
3. 21ema > 50ema signifying strong uptrend
4. RS >0

You can also add Volume criteria Image
Fundamental Critera 1 :
ROE and ROCE > 15 Image
Fundamental Critera 2 :
Year on Year EPS growth
If a company can keep growing earnings per share (EPS) long enough, its share price should eventually follow. Image
Fundamental Critera 3 :
Quarterly EPS Growth

You can choose between Quarterly or Yearly EPS growth Image
Fundamental Critera 4 :

Fiis and Diis increasing stake
Helps us understand smart money flow Image
Video 1 : Understanding the use of Screener


Video 2: Live application

Swing Trading Mentorship in HINDI :
Mentorship starting in Feb on weekends only with recording
Whatsapp for doubts :
Payment Link :
IPO base trading , Stock Selection , Stage Analysis and much more !wa.link/si4jn4
bit.ly/SwingMegaWebin…Image
Chartink Link :


Telegram Link :chartink.com/screener/stock…
t.me/Techno_charts

• • •

Missing some Tweet in this thread? You can try to force a refresh
 

Keep Current with JayneshKasliwal

JayneshKasliwal Profile picture

Stay in touch and get notified when new unrolls are available from this author!

Read all threads

This Thread may be Removed Anytime!

PDF

Twitter may remove this content at anytime! Save it as PDF for later use!

Try unrolling a thread yourself!

how to unroll video
  1. Follow @ThreadReaderApp to mention us!

  2. From a Twitter thread mention us with a keyword "unroll"
@threadreaderapp unroll

Practice here first or read more on our help page!

More from @JayneshKasliwal

Jun 30
There are 100s of Chartink Dashboard Available
I filtered out top 4 from Twitter
Retweet and Share !
[Bookmark it ]
🧵 Intraday Dashboard by
@Mr_Chartist
It displays:
✅Breakouts
✅Volume Spikes
✅Top Gainers & Losers
✅VWAP Setups ...and more!

Image
The MARS Chartink Dashboard by @finallynitin
⦿ MARS widget for indices
⦿ Top 50 stocks as per MARS
⦿ MARS 20 - a shorter-term variant based on 20-day MA
⦿ MARS 200 - a longer-term variant based on 200-day MA
⦿ % of stocks above/below 50-day MA

chartink.com/dashboard/1598…Image
Image
Read 6 tweets
Jun 7
The #1 Tradingview Indicator for Catching Reversals in 2025

A Thread🧵 Image
We use ATR to calculate the volatility of stock
What Does ATR Measure?
ATR calculates the average of the True Range (TR)over a specified number of periods (usually 14).

Its used for
Position Sizing:
Stop-Loss Placement:
Breakout Confirmation
Reversal Confirmation
Reversal Indicator :
Click on Link-> bit.ly/VCPSWINGImage
Read 9 tweets
Jan 9
Confused how to exit stocks in swing trading ?
A thread 🧵on 4 ways to exit stocks

Retweet and Share !
There are multiple ways to exit a stock
1. 7-8% Stoploss
2. 21 EMA tsl
3. 50% exit on RR and 50% on Tsl
4. Using Swing lows as stoploss

I use majorly use 1st and 2nd
1. 7-8% Stoploss

Description: You set a fixed stop-loss percentage, typically 7-8% below your entry price.
If the stock's price drops to this level, you exit the trade to minimize losses.

Losses work exponentially against you .
A 10% drop requires 12.5% breakeven
A 20% drop requires 25% breakevenImage
Read 12 tweets
Dec 23, 2024
Relative Strength vs Relative Strength Index
Tool to level up your Trading 🔥
A Thread 🧵
Kindly Retweet and 🩷
Relative Strength :
¢Relative strength is a strategy used in momentum investing and in identifying value stocks.

¢ It focuses on investing in stocks or other investments that have performed well relative to the market as a whole or to a relevant benchmark.
Indicator Values :
💠0 line that helps to differentiate between underperformer and outperformer
💠>1 Outperforming the markets
💠<0 Underperforming the markets Image
Read 13 tweets
Dec 12, 2024
Understanding Stage Analysis in 4 mins
A Thread🧵
Stage 1: Accumulation
Stage 2 : Uptrend
Read 6 tweets
Dec 10, 2024
7 less known Tradingview Indicators that all traders should know about
A thread🧵
1. @TraderLion_ Enhanced Volume Indicator

Lime Green Bars Suggests day when the stocks closes near the days high and volume greater than past 10 down volume days Suggesting Institutional Accumulation

Has Features Like :Highest/Lowest Volume in a year.
tradingview.com/script/yzjhAo0…
2. Revolution Volatility Bands

Modified version of Bollinger Bands
When price is written in blue, volatility overall is falling. When the outer bands start to fatten up in blue, a contraction signal is forming. Works with any length of your choosing
tradingview.com/script/fXnublK…
Read 11 tweets

Did Thread Reader help you today?

Support us! We are indie developers!


This site is made by just two indie developers on a laptop doing marketing, support and development! Read more about the story.

Become a Premium Member ($3/month or $30/year) and get exclusive features!

Become Premium

Don't want to be a Premium member but still want to support us?

Make a small donation by buying us coffee ($5) or help with server cost ($10)

Donate via Paypal

Or Donate anonymously using crypto!

Ethereum

0xfe58350B80634f60Fa6Dc149a72b4DFbc17D341E copy

Bitcoin

3ATGMxNzCUFzxpMCHL5sWSt4DVtS8UqXpi copy

Thank you for your support!

Follow Us!

:(