$1000 to $1,000,000 in 3 years then almost $2,500,000 since October 2023🤨
How come I can compound trades while keeping losses minimum?
In this thread, I'll explain 12 Entry Models I use on a daily basis to rapidly increase my net-worth as a spot markets day trader | No Leverage, No Shitcoins !! 🧵
How come I can compound trades while keeping losses minimum?
In this thread, I'll explain 12 Entry Models I use on a daily basis to rapidly increase my net-worth as a spot markets day trader | No Leverage, No Shitcoins !! 🧵

Before going through each entry model, I recommend to watch this video about ranges, order-blocks and supply/demand explained in under 35 minutes!

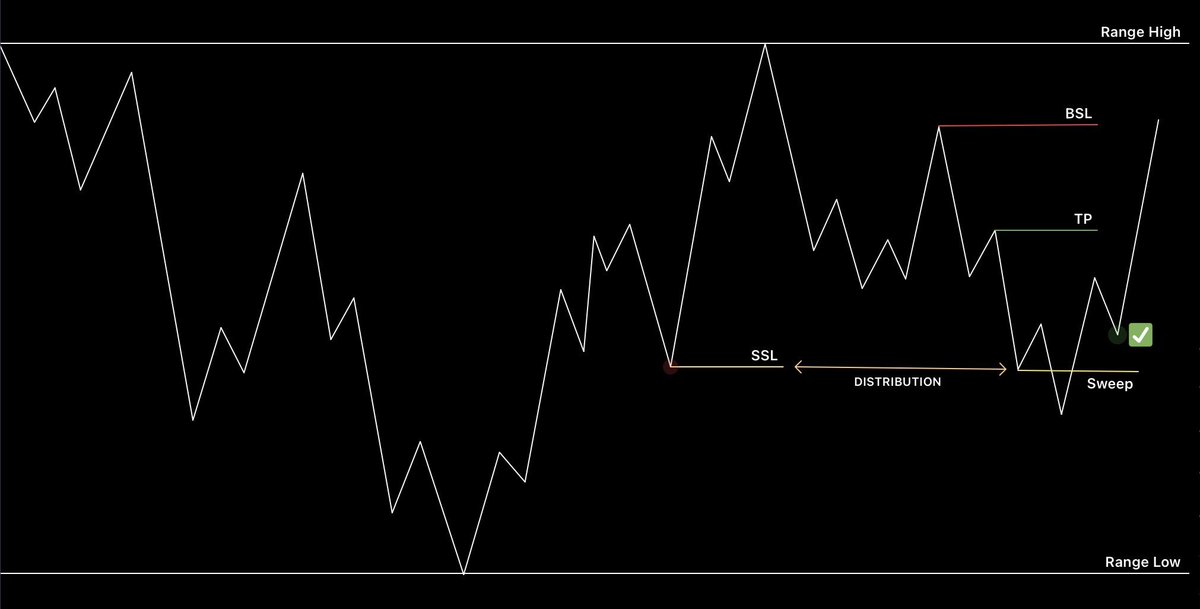
Model 1 | Sell Side Liquidity
Often around the mid range, price will leave a candle with a large buy back wick, this is called the SSL.
Wait for price to sweep & reclaim. Best confirmation is to wait for 4H candle to close above.
Target the first high left above or the opposite of SSL, which is the Buy Side Liquidity (BSL).
Invalidation is simply placing a hard stop below the recent low that was created after the sweep.
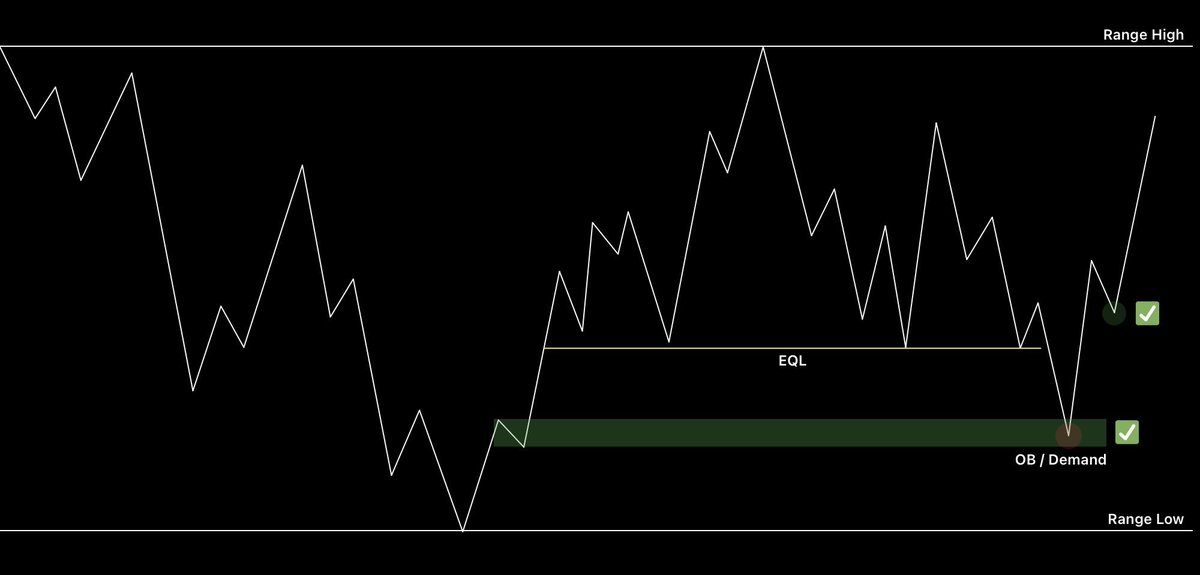
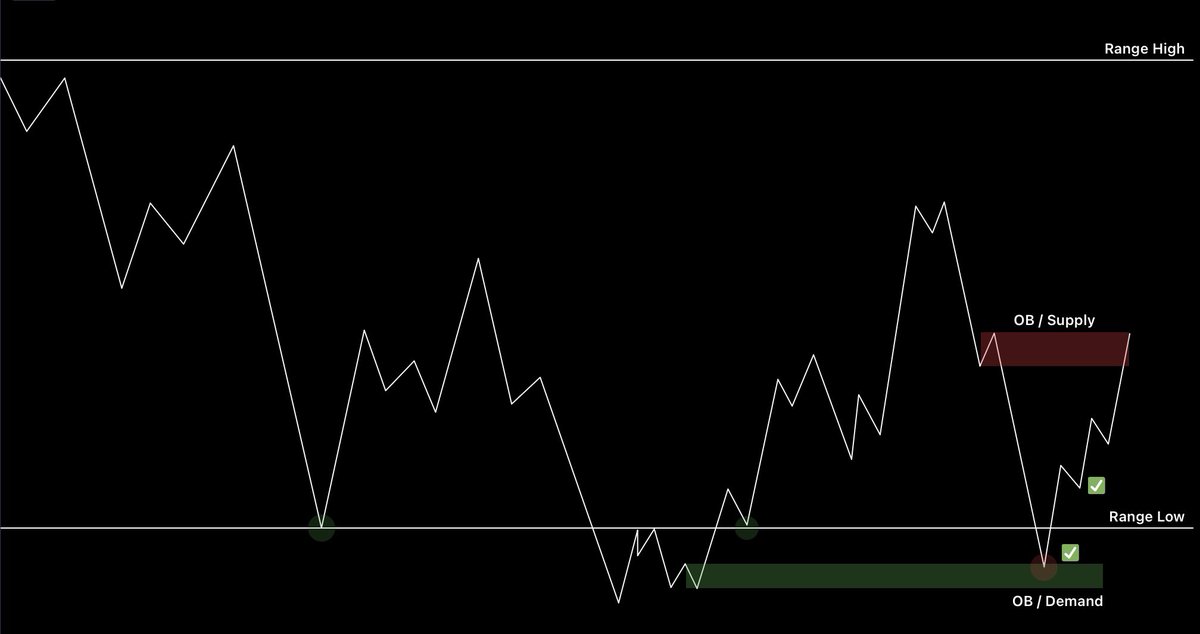
Model 2 | Equal Lows Sweep
In this instance, you’d see equal wicks around a clustered area where retest longs have their stops placed below.
Depending on the timeframe of range, you cannot decide how far the sweep is likely to go.
To overcome this, look for an untapped OB/Demand zone below the EQL.
You can enter with a limit order or wait for the sweep & reclaim (similar to Model 1)
Invalidation is simply the OB/Demand showing no reaction within the first couple of H4 candles. Place a hard stop if market is uncertain but I usually use a manual stop in this case to absorb wicks.

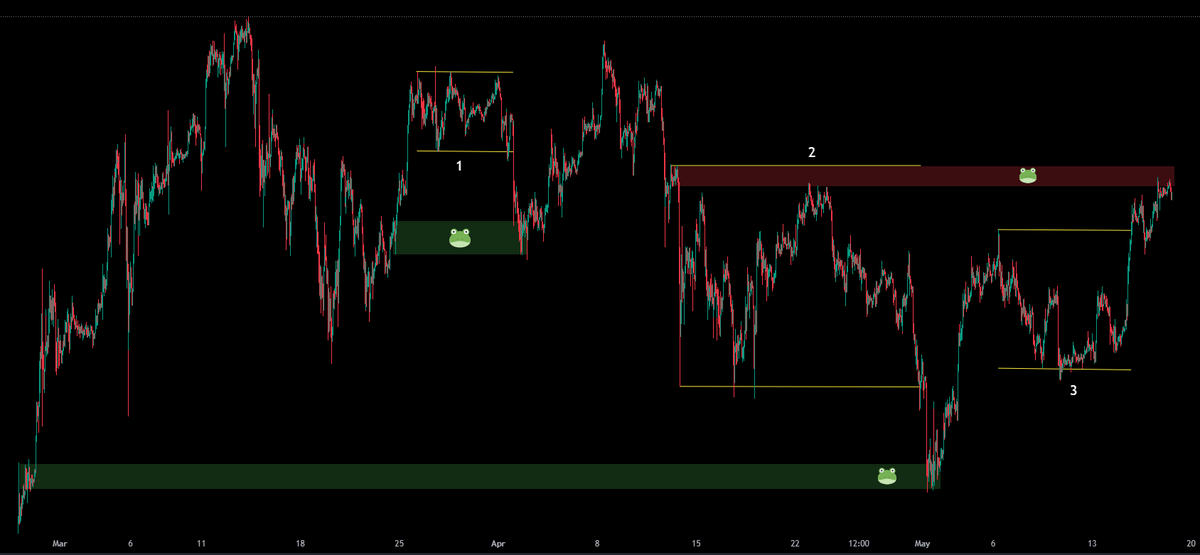
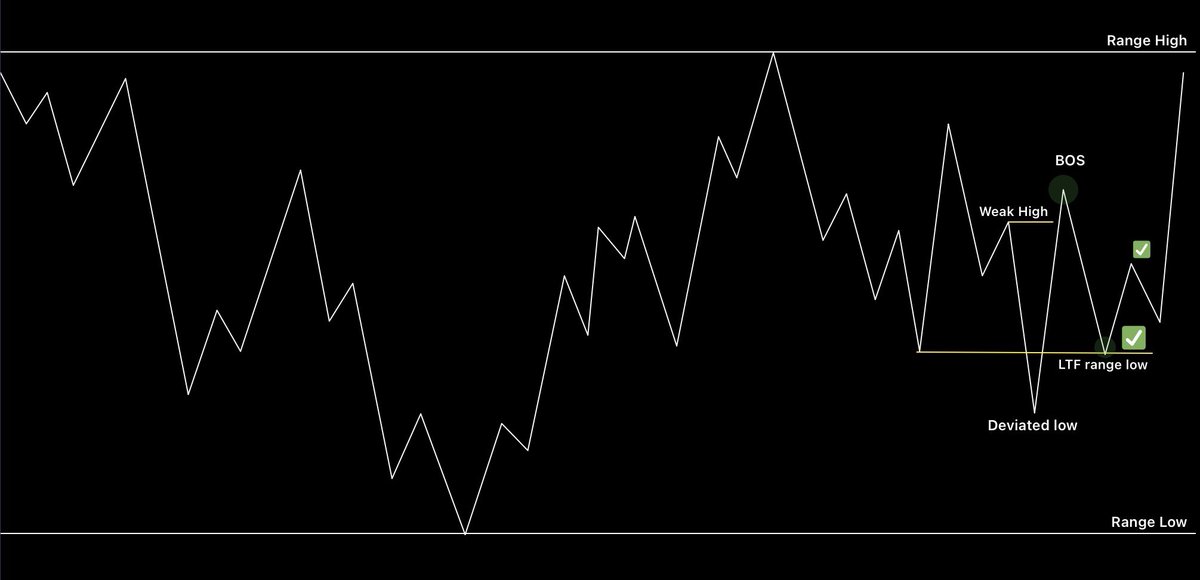
Model 3 | Break of Structure
This one is my least favorite as the price action during this is ultimate chop.
You’re looking at a continuation of trend but there will be a weak high left somewhere in the trend.
The thesis is simple; if price goes for the weak high, it indicates a buy pressure that was able to push it that far during a downtrend.
To enter, look for entry at LTF range low or the LTF OB/Demand created as POI after both sides have been swung & swept.
Given the nature of this model, there isn’t much resistance left above after the BOS, therefore you can target fully back to range high.
Invalidation is placing a hard stop below the local low as going back there would indicate a continuation in momentum of trend.
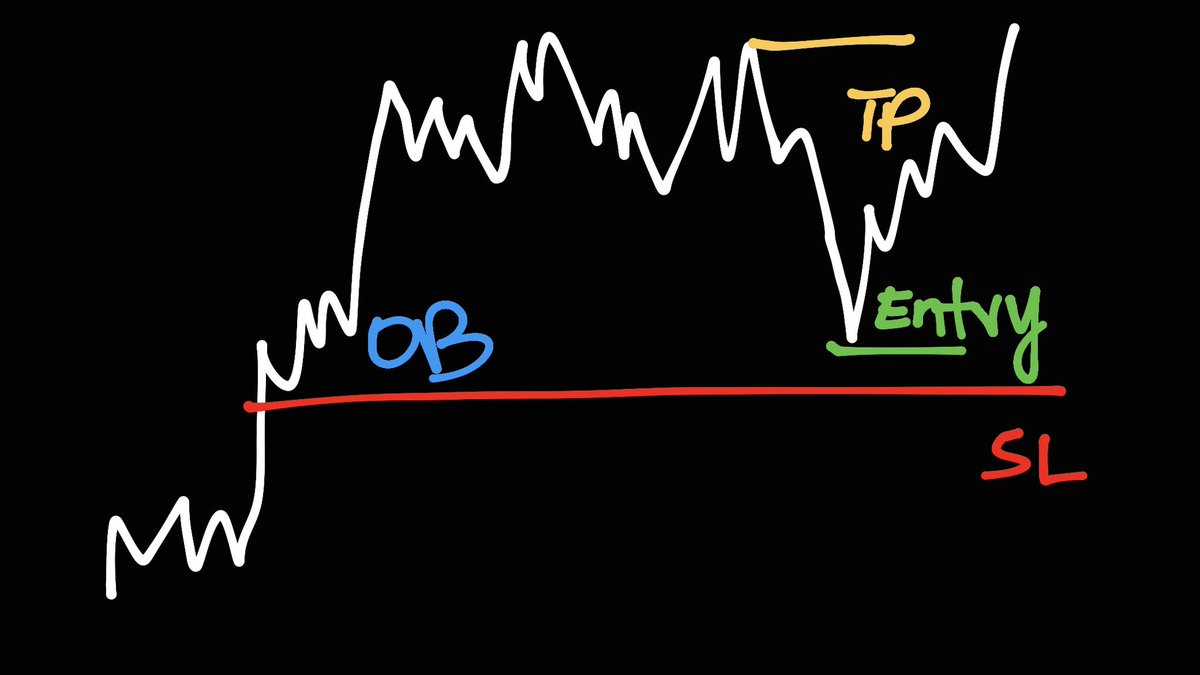
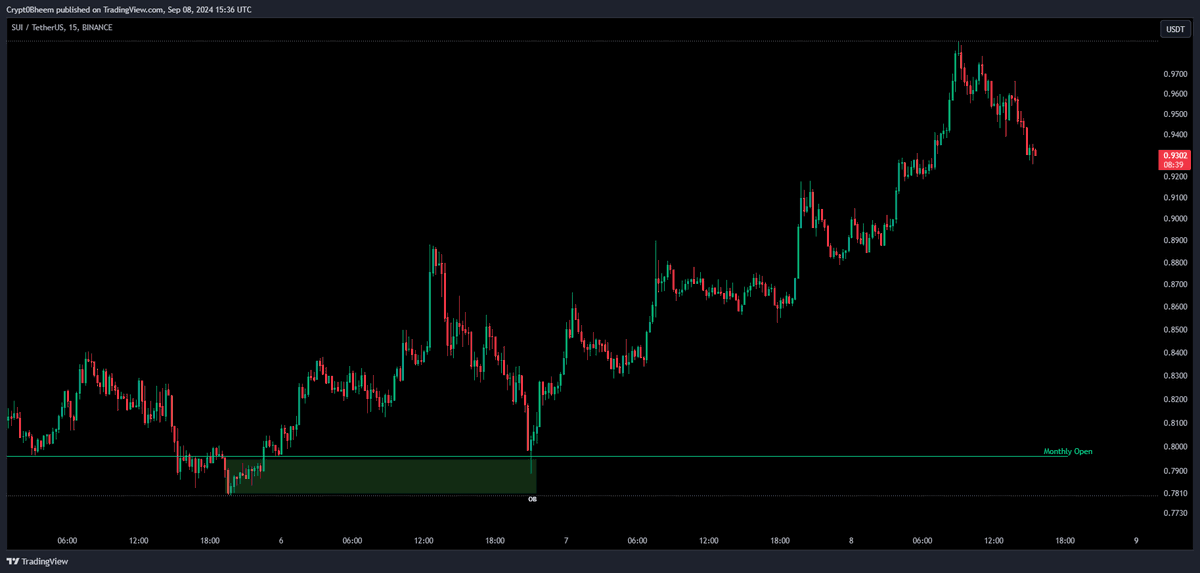
Model 4 | Range Low Sweep
One of my most favorite, simply marking the OB/Demand created below the range low after the sweep or deviated reclaim.
These will get tested 90% of the time & provide ample bounces to scalp.
If unsure, enter on the reclaim (similar to Model 1)
Invalidation is to place the stop below the lower band of OB/Demand but give enough room for wicks.
Target the latest supply created on the fall.
I’ve attached my recent open long on sui as an example from today:
https://x.com/cryptobheem/status/1749176690859991327?s=46
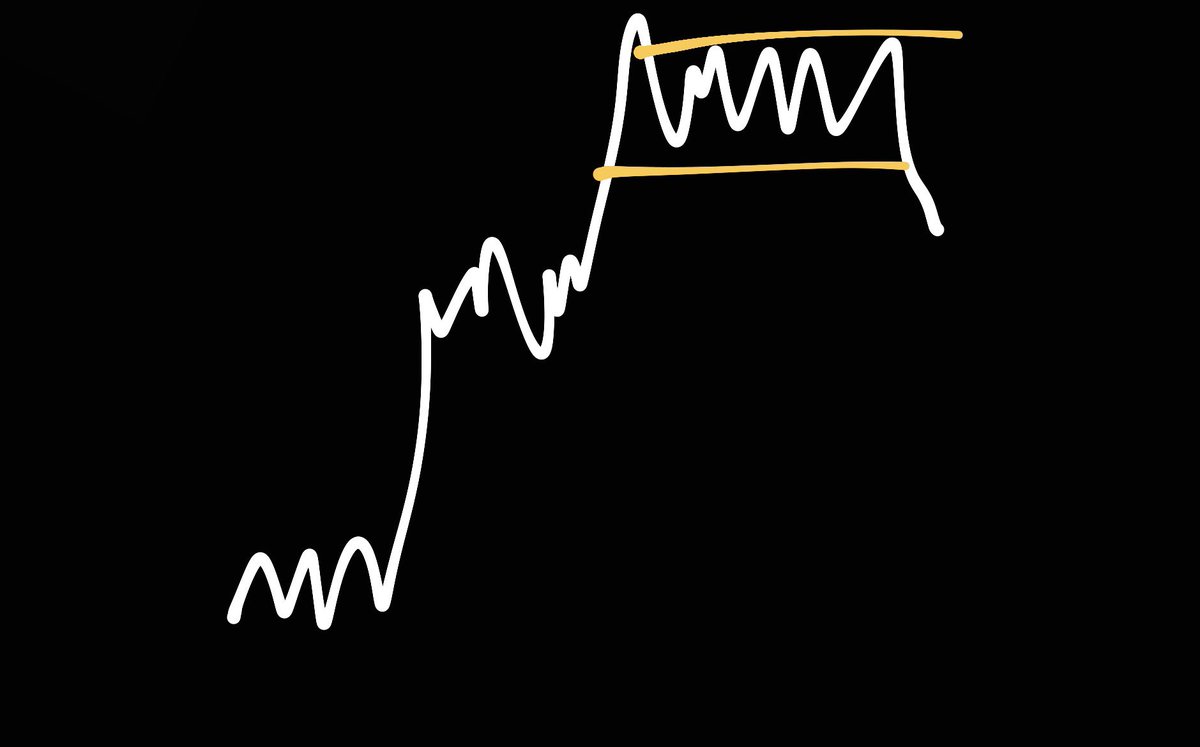
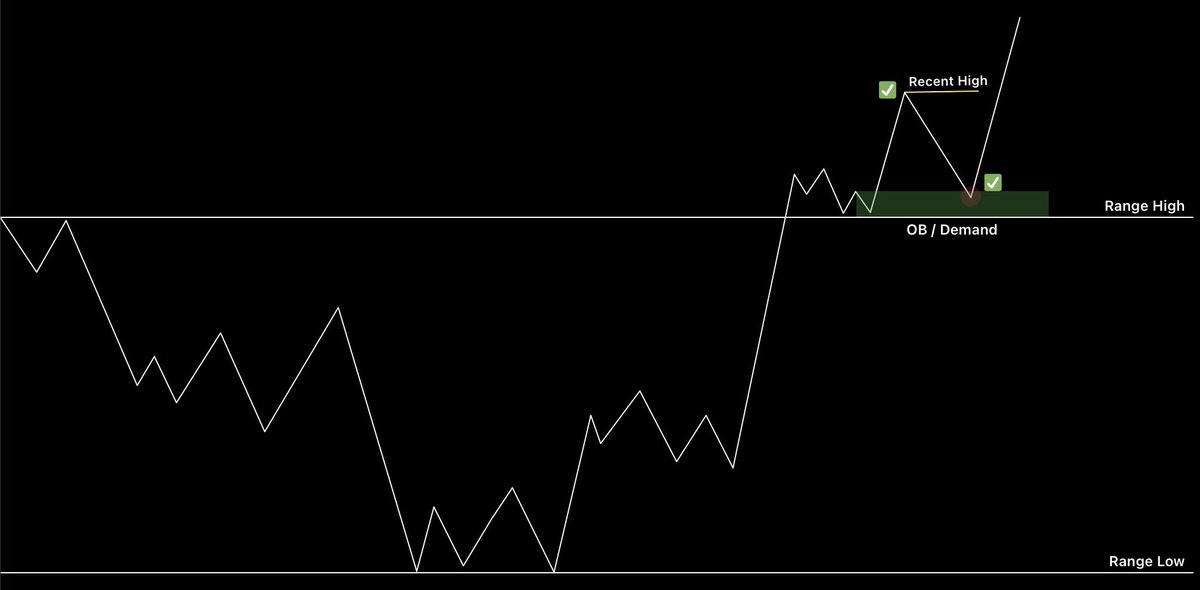
Model 5 | Range High Flip
Another one of my most favorite. Have you ever tried to long a breakout of range but end up with no movement?
That is because, altho you’re following the trend> you’re not keeping your eyes open to momentum.
In this model, right after a breakout, an OB/Demand gets created above the high. Thats it, there’s confirmation that some large entity is interested to keep the momentum on price.
Bid the retest, target recent high or all time high depending on the overall market structure.
Invalidation is simple, manually close the trade if price accepts below range high on a couple of H4 candles because that indicates a loss of momentum of trend.
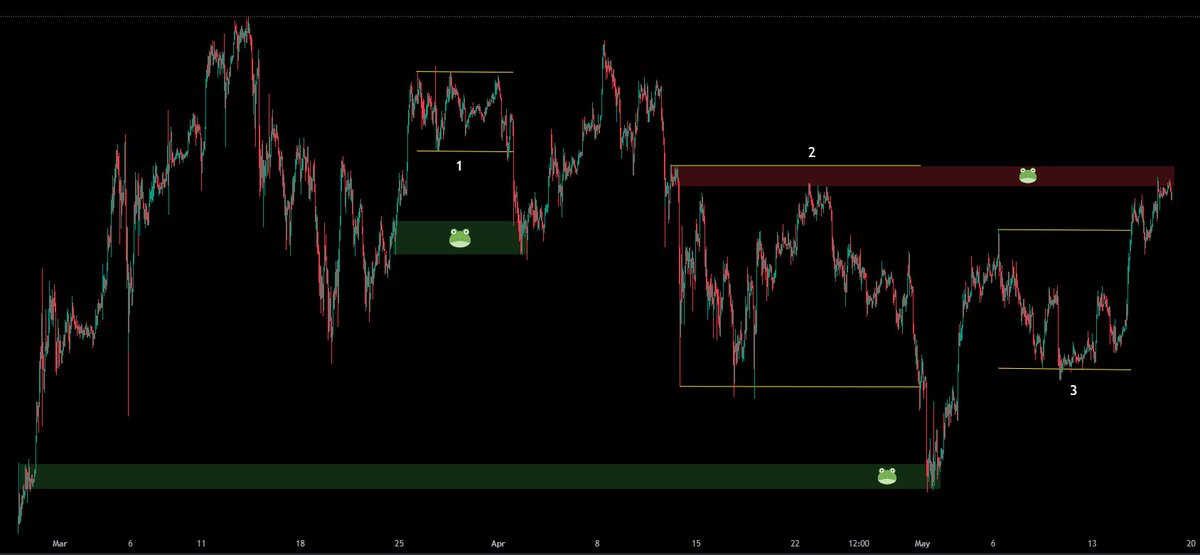
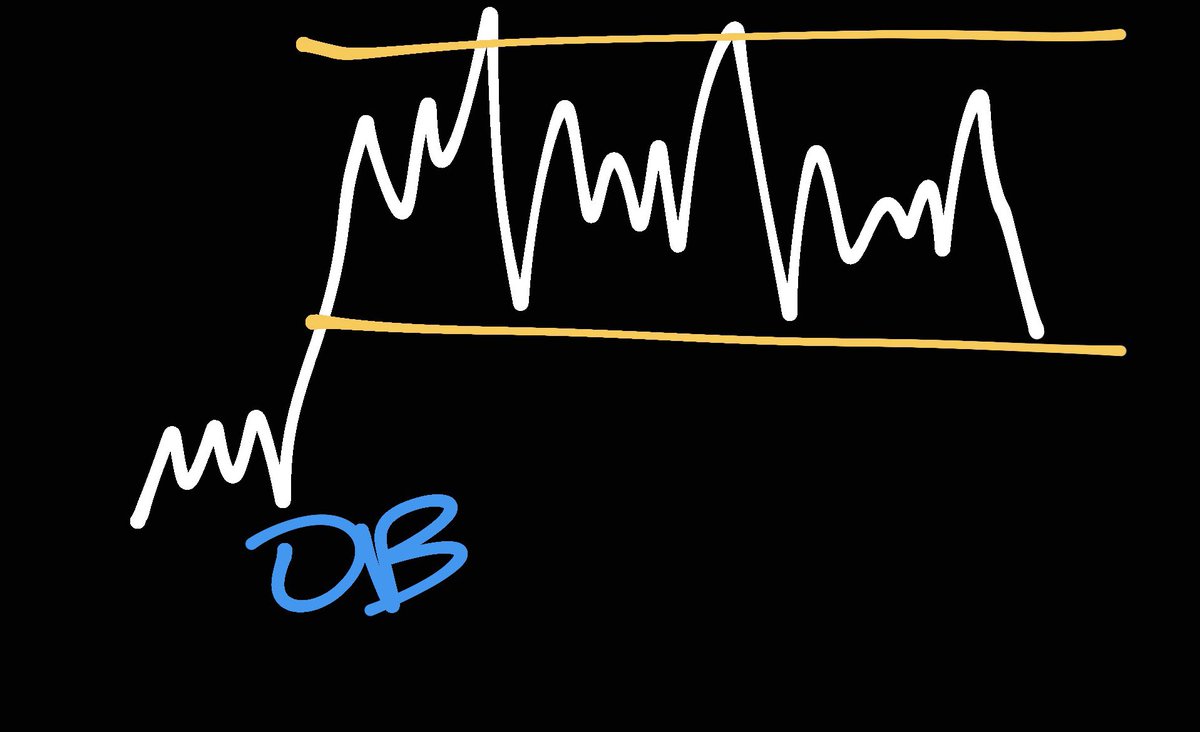
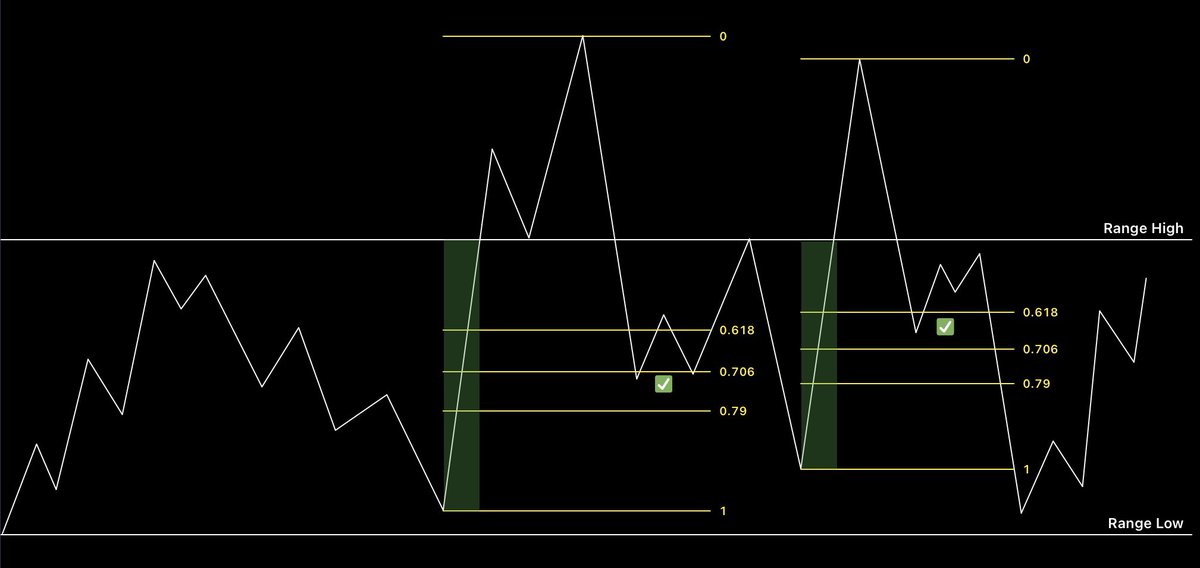
Model 6 | GP inside IMB
GP: Golden pocket
IMB: Imbalance
If you’ve the basic knowledge of fibs, you’d see that my fibs are a lil custom. It’s because they’ve been slightly tweaked to create sniper entries.
Now lets get on to the chart, ever came across one of these where the low & highs just keep swinging & you wonder wether your range was even right all along?
The green boxes are marking out the big green dildos without any retracement. Many people like to use FVG’s in this case; but they’re too wide to find a good RR setup.
Here’s how it works; the 0.618-0.706 is the entry zone & price slicing through the 0.79 is the invalidation.
Keep in mind the latest structure of the trend & TP timely on the bounce. Imbalances more than often, never reach the local top after a retest.
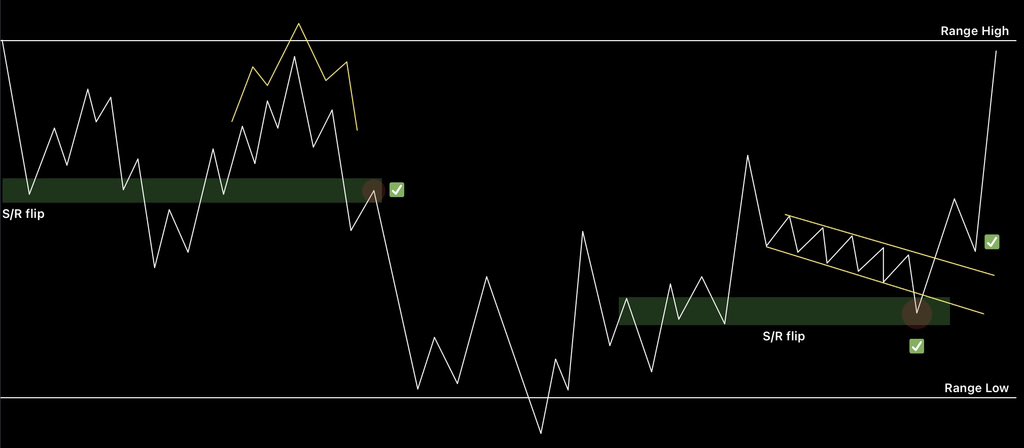
Model 7 | Patterns
This is deemed as beginners thought by some people, although they exist; & well for a reason, you’re just using them wrong.
Step 1: Identify the pattern after the S/R flip because a flip is where the first confirmation for change of trend is present.
On the left you can see the example of H&S pattern formed & the trigger marked once the S/R box bends down.
On the right you can see a shift in trend after sweeping range lows. Once again a bull flag gets formed after the S/R breakout. You can either long the retest on S/R or the basic breakout retest of flag, both work.
Flip the example to other side of each & both will fail because you’ll be trying to force a pattern to work against the trend of individual range pivots.
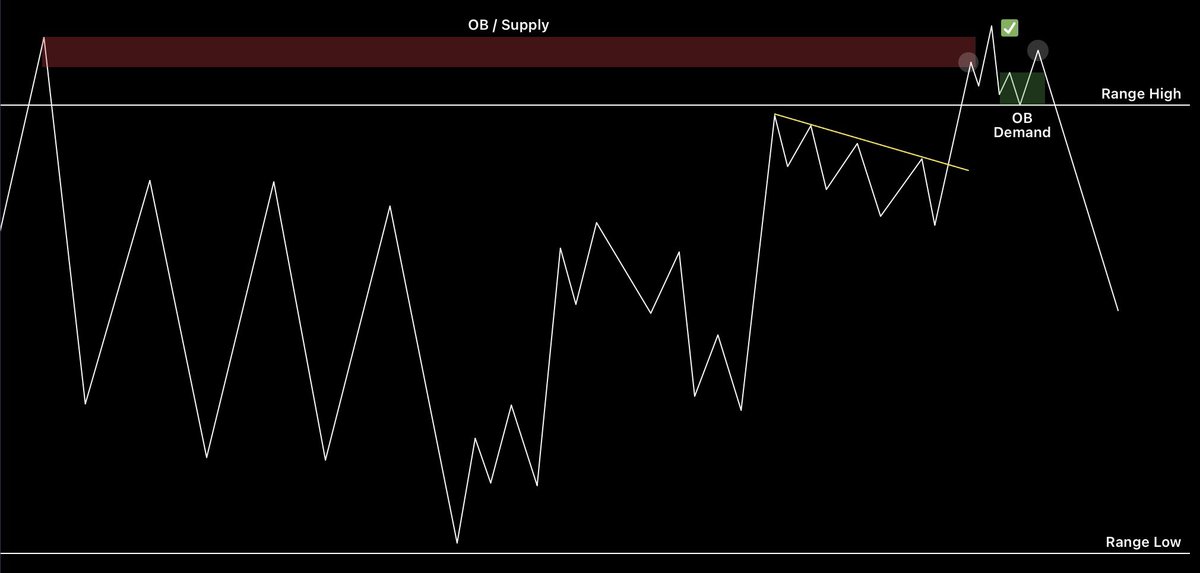
Model 8 | Failed Auction
This is mother of Model 5. You must be aware of this scenario where the trend & breakout confirmation are there but your trade ends up looking like something as drawn.
This is because although your are following the latest momentum, you have neglected the past trend that formed this recent trend. In this case, there’s a HTF OB/Supply zone present right above the range high breakout.
Unless this is broken through, you cannot enter a long & how to trade its inverse is covered in (Model 12).
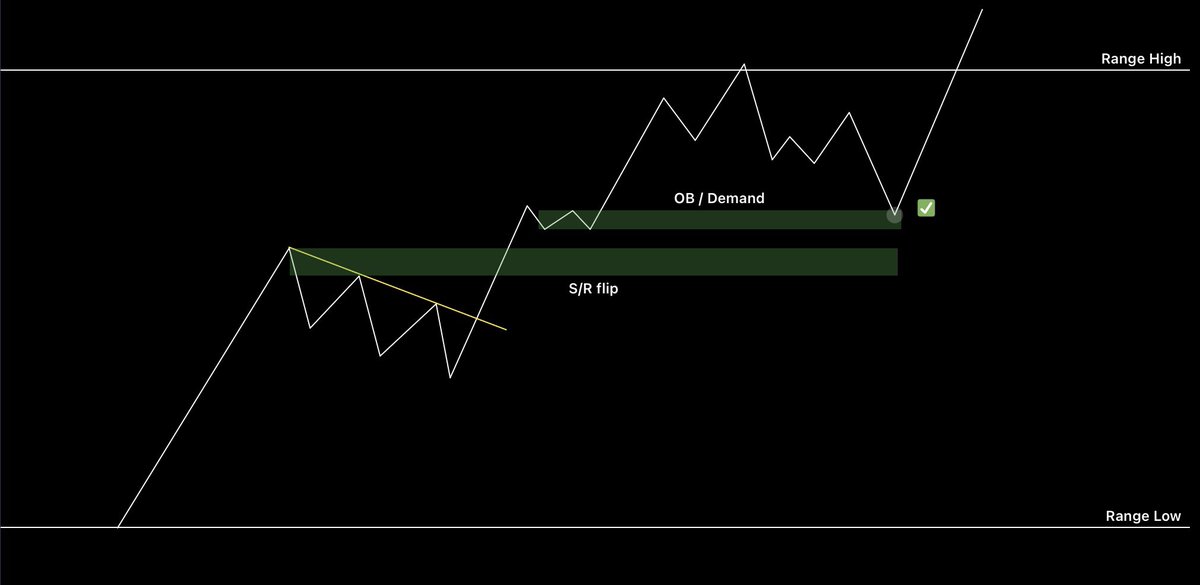
Model 9 | Momentum
This is one of the easiest but the most clueless missed setup by traders of all levels.
Looking at this chart without the OB marked, your first thoughts are an entry on the retest of S/R flip.
Keep in mind that for a S/R level to be valid, it must respect the ratio of trend between continuing & retesting. In this case, had the price came back to S/R, it would’ve shown a small bounce but eventually broke down because look at how much it moved after the trendline break, would it make sense for buyers to come back here after being pushed down so much by sellers again?
Continue with the momentum & by your surprise there will be OB / Demands present slightly above the obvious level you can enter.
Place a hard stop below the S/R as more than half of the trend would’ve been absorbed for failed continuation below that.
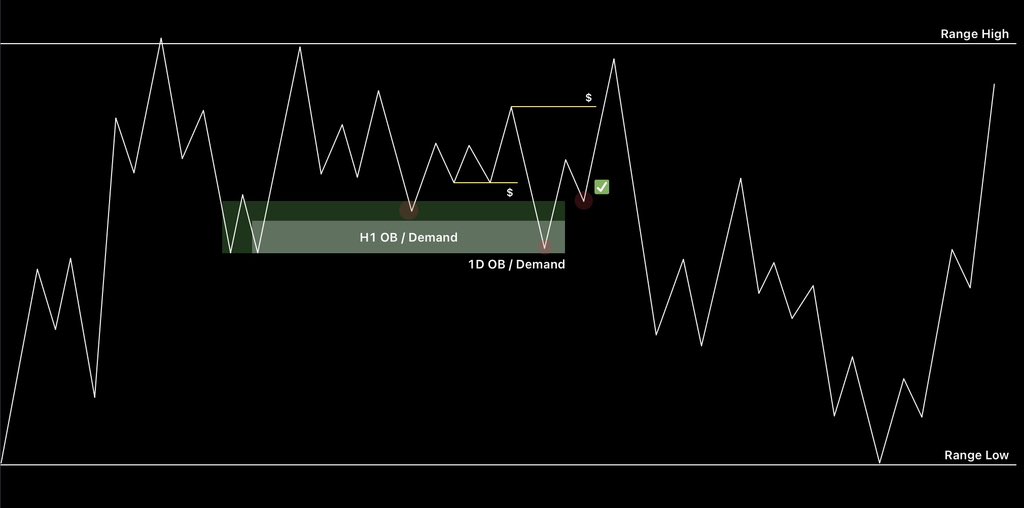
Model 10 | OB over OB
Order-blocks inside Demands or vice versa, you’ll come across some charts that have clustered areas. Fear not cos it’s a rare opportunity for a high RR setup.
Identity the HTF OB or Demand and wait for it to mitigate, price is most likely to chop above it creating poor lows. Identify LTF OB or Demand inside which will be swept next (using the concept of Model 2 & 4).
Place stop below the low of HTF block & target nearest supply or BSL.
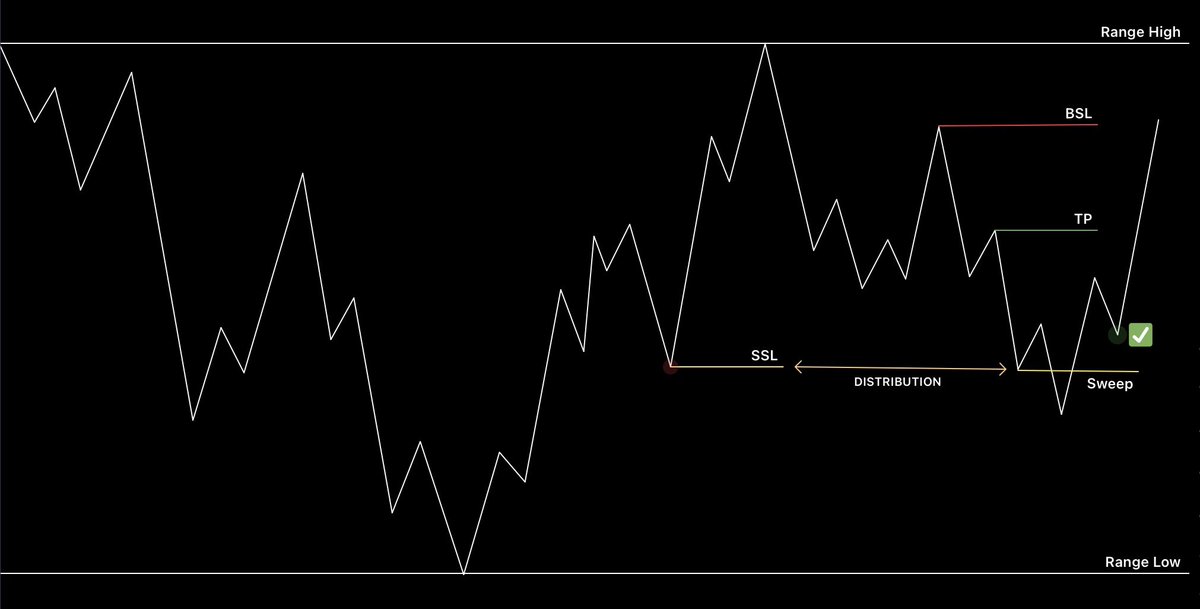
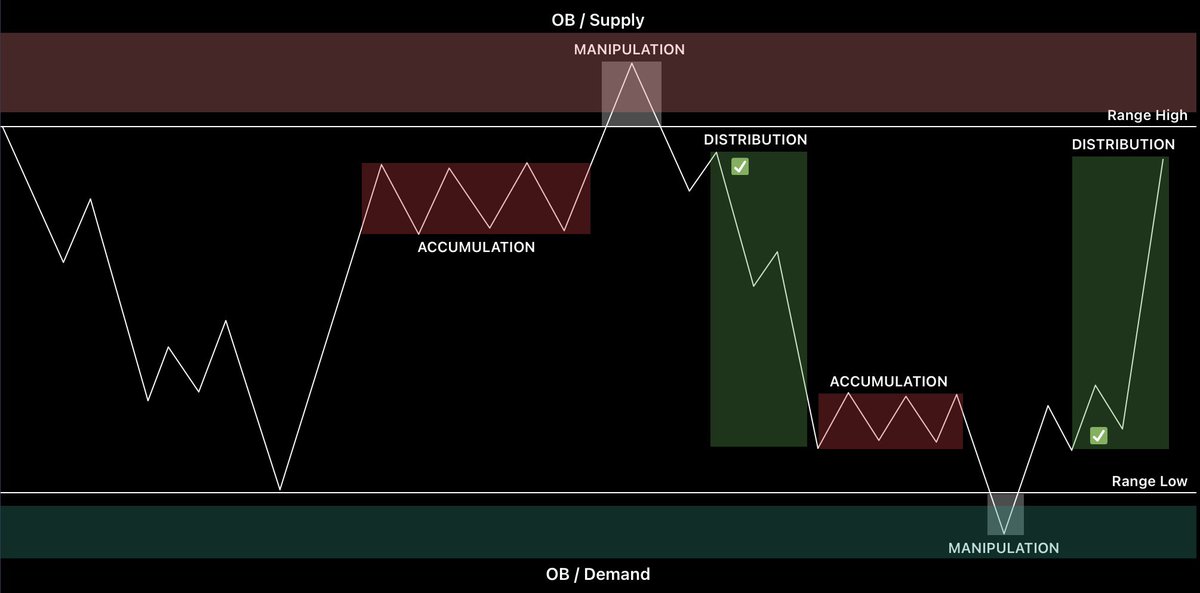
Model 11 | AMD or PO3
Market is against you? Got stopped out? Want to brag a tweet? Fear not because on CT, you’ll find this chart often used by people who have no idea what they’re doing!
For the best AMD, remember Model 4 & 8 to analyze the manipulation to tap into OB or Demand/Supply for a reversal.
This setup is most often used to find 360 trend reversals before distribution phase but you can always enter on the confirmation of price accepting inside the phase completely.
Enter inside Distribution and place a hard stop below the manipulation low, target the opposite side of the range.
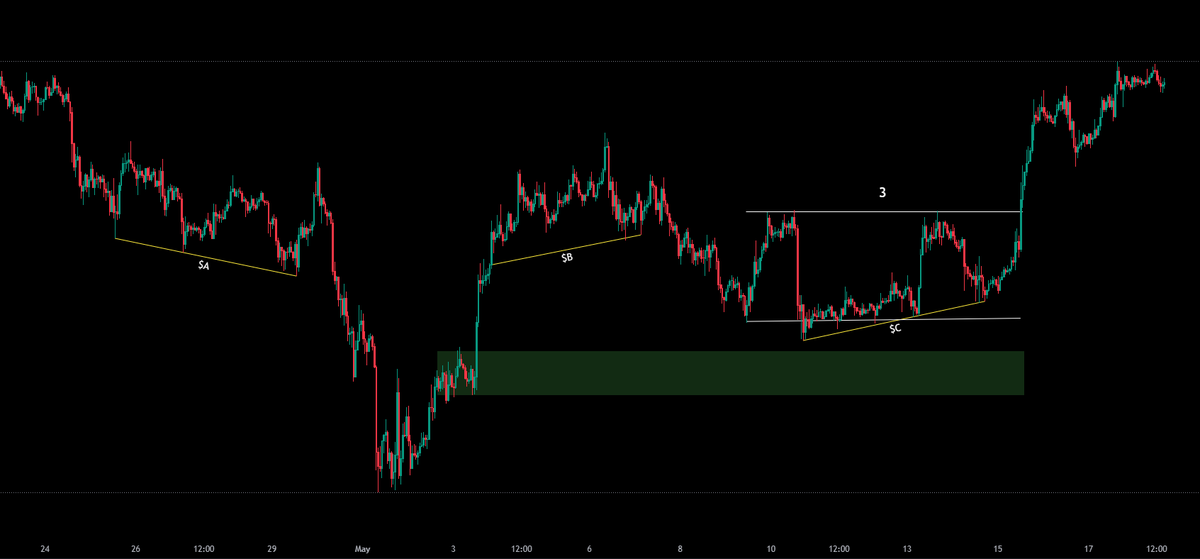
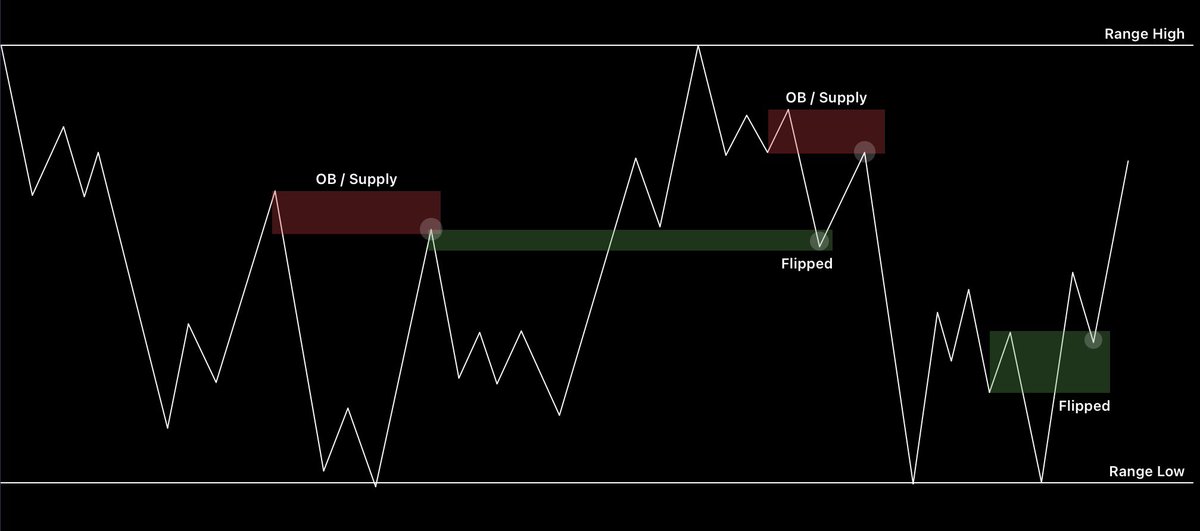
Model 12 | Supply Flip
Last but not the least, as a spot trader there comes a point where no trade makes sense as the overall trend is down.
In that case I wait for both LTF & HTF OB / supply zones to flip & provide a confirmation to scalp to next nearest resistance.
The stop goes below the first rejection point of the supply & most often, I use manual price acceptance below it to absorb any wicks.
If you enjoyed it, Like & Retweet to reach more people!
Also let me know your thoughts & results after testing these models by making a quote tweet, so I can find your testimonials easily!
If you’d like to, turn on both tweet + reply notifications for my daily analysis & setups.
Also let me know your thoughts & results after testing these models by making a quote tweet, so I can find your testimonials easily!
If you’d like to, turn on both tweet + reply notifications for my daily analysis & setups.

Available in video form now:

• • •
Missing some Tweet in this thread? You can try to
force a refresh