Sasha Gusev Profile picture
Jan 26 18 tweets 10 min read Read on X
I've written up a "crash course" on population genetics parameters useful for thinking about recent selection, heritability, and group differences (as part of a longer write-up on these concepts).


I'll summarize the key points here 🧵: gusevlab.org/projects/hsq/#…
Image
A preface: if you're generally interested in population genetics it's better to learn from first principles, and I've linked some useful resources to that end (many free). In particular (spoiler) recent evolution excludes some of the more interesting concepts and personalities. Image
But one downside of the general approach is that it can be hard to get a feel for real time (for example when populations are modeled in terms of 4Ne\mu). Here we'll fix three parameters based on data: time (t=65k years), population size (Ne=10k), and selection (s=~10^-4).
Image
Image
We can start by modeling how genetic variants move under neutral drift: very slowly! In 120k years a 5% allele is expected to accumulate just ~1% of drift variance. We can also think in terms of allele "age", and common variants are VERY old (mostly pre-migration).


Image
Image
Image
Image
Now let's add selection. Under the weak coefficients we see in real data, selection acts very slowly. Most common variants under negative selection will stay common. And new variants under positive selection will stay rare. It would take ~300k years for a 95% allele to go to 1%.

Image
Image
Image
These shifts are even slower under stabilizing selection, where traits move towards a fitness optimum instead of directionally up/down. This is likely the way populations have adapted to changing environments (we'll come back to this later).
Image
Image
Now that we have a model for selection and drift, we can test for whether variants are under selection. It turns out this test is very powerful when selection is strong, even 100 samples is enough. Whereas in the "nearly neutral" range it is effectively undetectable. Image
We can quantify genetic variance using F_ST, a fundamental measure of within versus between population correlations and often misunderstood. Part of the confusion is there are two derivations - Nei's and Hudson's - and they can be meaningfully different.


Image
Image
Image
Image
Under strong assumptions, F_ST can be related to population size and migration, but it is compatible with many different population dynamics in a way that can be non-linear and unintuitive.

Image
Image
Image
Moreover, F_ST is highly dependent on *which variants* are used to estimate it, and this can lead to highly unintuitive results. For example the apparently higher F_ST within chimps than between chimps/humans -- an artifact of how sub-populations are tested.

Image
Image
Image
A useful derivation is that Hudson's F_ST bounds the difference in trait mean between populations under neutral drift. We can confirm this in simulations. For a typical ~10% heritable trait, the (African/European) population difference is at most 1.5% (in either direction). Image
That's under neutrality, but under stabilizing selection, things are constrained even further but in complicated ways. After a shift in the fitness optimum, genetic variation is first rapidly selected on, and then gradually (and mostly arbitrarily) purified out of the population. Image
Between populations with the same fitness optimum, the mean trait value will be more constrained than under neutrality. But, it will also look like genetic variation has changed MORE substantially (e.g. F_ST). Interpretation is even more complicated with environmental shifts.
Image
Image
Finally, this brings us to the Breeder's Equation, which connects heritability and the response to selection under a fixed environment. In controlled breeding experiments (e.g. maize) response can be stable for many generations (consistent with polygenicity and new mutations).

Image
Image
Image
But in natural populations, the response often appears static or even negative (aka the "stasis paradox")! I highlight some examples compiled by Walsh & Lynch: bias in heritability estimates, indirect/environmental confounding, or shifts in the environment are all at play.

Image
Image
Image
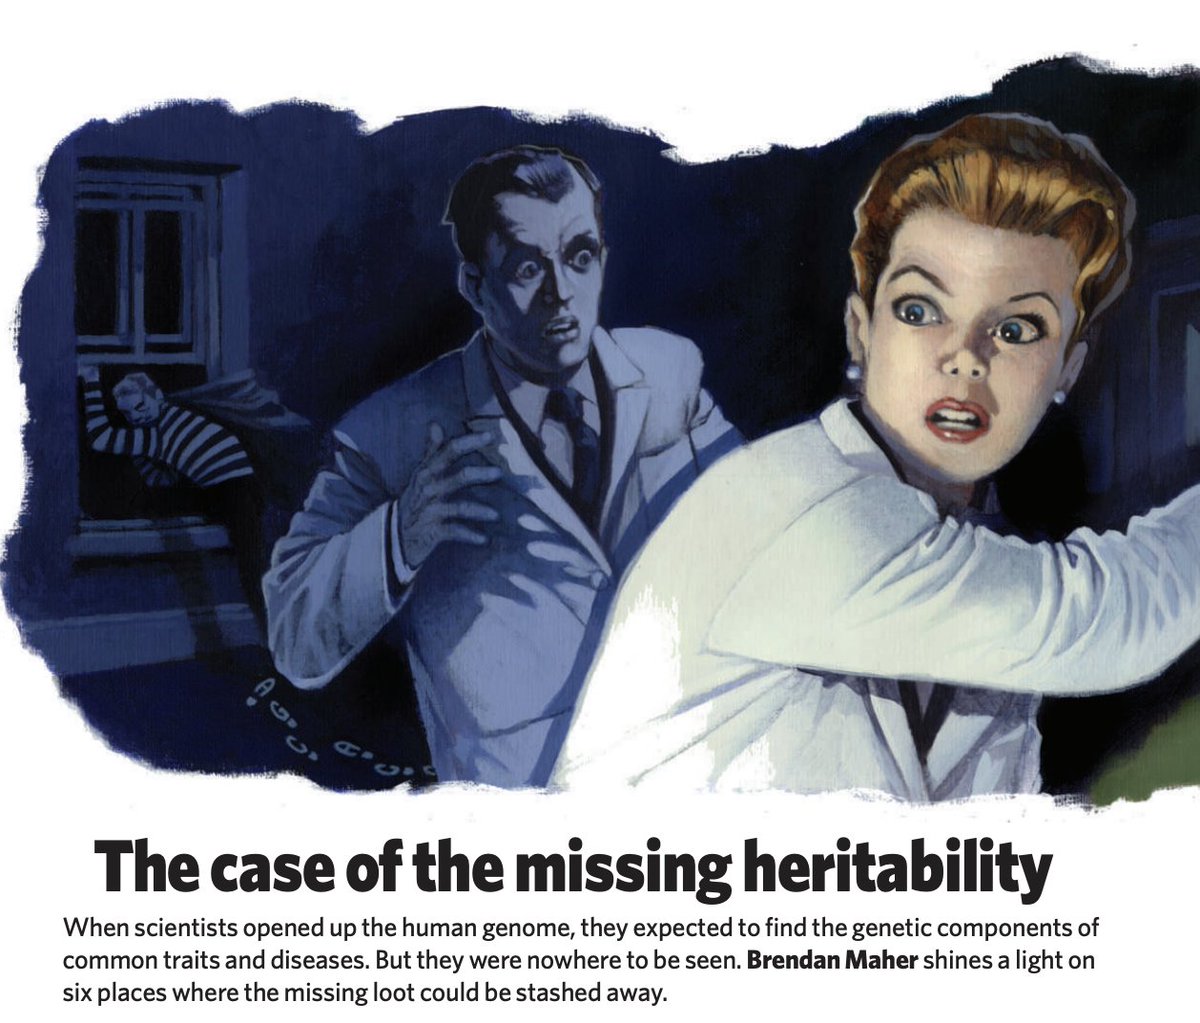
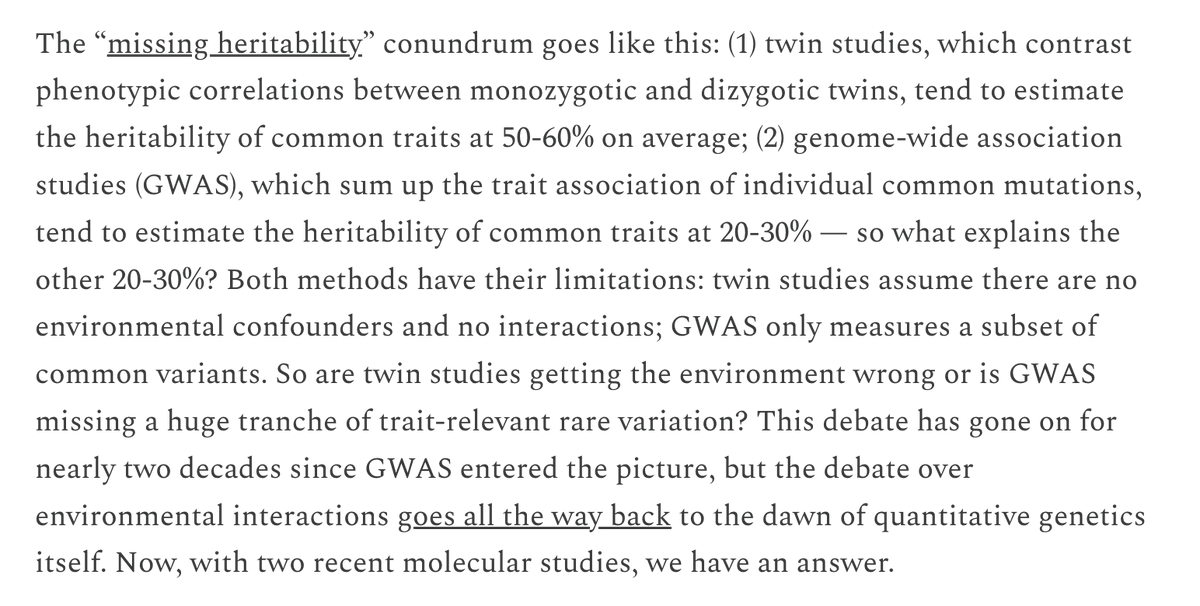
This "missing response" echoes the debate around "missing heritability", where molecular methods often produce lower estimates and identify environmental confounders. I wonder ... are humans more like maize under controlled breeding or like natural evolving populations? /fin
By the way, all the figures and simulations are pretty simple but I've put the code here in case it's useful: . Let me know if you spot an error.github.com/gusevlab/hsq_a…
@threadreaderapp unroll

• • •

Missing some Tweet in this thread? You can try to force a refresh
 

Keep Current with Sasha Gusev

Sasha Gusev Profile picture

Stay in touch and get notified when new unrolls are available from this author!

Read all threads

This Thread may be Removed Anytime!

PDF

Twitter may remove this content at anytime! Save it as PDF for later use!

Try unrolling a thread yourself!

how to unroll video
  1. Follow @ThreadReaderApp to mention us!

  2. From a Twitter thread mention us with a keyword "unroll"
@threadreaderapp unroll

Practice here first or read more on our help page!

More from @SashaGusevPosts

May 12
I've written the first part of a chapter on the heritability of IQ scores. Focusing on what IQ is attempting to measure. I highlight multiple paradoxical findings demonstrating IQ is not just "one innate thing".


I'll summarize the key points here. 🧵 gusevlab.org/projects/hsq/#…
Image
First, a few reasons to write this. 1) The online IQ discourse is completely deranged. 2) IQists regularly invoke molecular heritability as evidence for classic behavioral genetics findings while ignoring the glaring differences (ex: from books by Ritchie and Haier/Colom/Hunt).
Image
Image
Thus, molecular geneticists have been unwittingly drafted into reifying IQ even though we know that every trait is heritable and behavior is highly environmentally confounded. 3) IQ GWAS have focused on crude factor models that perpetuate the "one intelligence" misconception.
Read 21 tweets
Apr 30
It pains me to see facile critiques of GWAS on here from our clinical/biostats friends while the many actually good reasons to be critical of GWAS get little attention. So here's a thread on what GWAS does, what critics get wrong, and where GWAS is genuinely still lacking. 🧵:
Here’s an example of what I’m talking about from Frank Harrell’s otherwise excellent critique of bad biomarker analysis []. This gets GWAS completely wrong. Genome-wide significance is not about "picking winners" or "ranking" the losers. fharrell.com/post/badb/
Image
Genome-wide significance is about identifying variants for which the estimated effect size is *accurate*. And since most traits are polygenic (meaning a large fraction of variants will have some non-zero association) this practically means getting effect *direction* right.
Read 15 tweets
Apr 20
I’ve seen critiques of the poor methodology and cherry-picking in The Bell Curve but I haven’t seen much about the absolutely deranged fever dream of predictions about the coming decades in its closing chapters. It has been 30 years, so let's review. 🧵: Image
Low skill labor will become worthless, attempts to increase the minimum wage will backfire. In the not-too-distant future, people with low IQ will be a ”net drag” on society. Image
“Cognitive resources” in the inner city have already fallen “below the minimum level” and will escalate into a “fundamental breakdown in social organization”. “The Underclass” will become isolated and increasingly unable to function in the larger society.
Image
Image
Read 9 tweets
Mar 29
Unpopular opinion (just look at the QT's) but nearly every "dogmatic, outdated, and misleading" claim about IQ listed here is either objectively accurate or heavily debated dispute within the field itself.

Let's take them one at a time:
"IQ tests were necessarily biased"

One way test bias is evaluated within the field is by testing for strong measurement invariance (i.e. that subtest behavior is consistent across groups). This method is almost never applied in the classic literature or applied poorly (MCV).
When MI is tested for, it fails often enough that test bias should be the first concern when doing any group comparisons [see Dolan et al. for some examples: ]. Test makers work hard to mitigate bias but intelligence researchers often do not.…ltewichertsdotnet.files.wordpress.com/2015/12/dolans…
Read 13 tweets
Mar 1
Some thoughts on the ability to distinguish populations with genetic variation, why that means little for trait differences, and why there are other good reasons to collect diverse data. 🧵
I was pleasantly surprised to see no one mount a strong defense of "biological race" in this thread. Even the people throwing this term around seem to realize it's not supported by data. Instead the conversation shifts to population "distinguishability".

For example, a random twitterer (left) and a professor (right) emphasizing that genetic variation can be used to "distinguish" populations. And it's true, one can aggregate small per-variant differences into genetic ancestry estimates that often correlate highly with geography.
Image
Image
Read 16 tweets
Feb 27
Something I don't want to get lost is that the field is much better now at studying, visualizing, and discussing complex populations than it has ever been, and there are many resources to help do this effectively. A few suggestions below:
The NAES report and interactive on using population descriptors [] and Coop on genetic similarity [].

Carlson et al. [] and Lewis et al. [] on accurate presentation of ancestry.nap.nationalacademies.org/resource/26902…
arxiv.org/abs/2207.11595
nature.com/articles/d4158…
pubmed.ncbi.nlm.nih.gov/35420968/
Borrell et al. [] on race/ancestry in medicine.

Lawson et al. on understanding STRUCTURE []. McVean on understanding PCA [].nejm.org/doi/full/10.10…
nature.com/articles/s4146…
journals.plos.org/plosgenetics/a…
Read 5 tweets

Did Thread Reader help you today?

Support us! We are indie developers!


This site is made by just two indie developers on a laptop doing marketing, support and development! Read more about the story.

Become a Premium Member ($3/month or $30/year) and get exclusive features!

Become Premium

Don't want to be a Premium member but still want to support us?

Make a small donation by buying us coffee ($5) or help with server cost ($10)

Donate via Paypal

Or Donate anonymously using crypto!

Ethereum

0xfe58350B80634f60Fa6Dc149a72b4DFbc17D341E copy

Bitcoin

3ATGMxNzCUFzxpMCHL5sWSt4DVtS8UqXpi copy

Thank you for your support!

Follow Us!

:(