E.J. Antoni, Ph.D. Profile picture
Feb 2 14 tweets 5 min read Read on X
Jan jobs report🧵- here's what you need to know that the talking heads and gov't statisticians won't tell you, including why the real unemployment rate is btwn 6.3% and 7.4%... Image
First the headlines:
Nonfarm payrolls rose 353k last month
Unemployment rate steady at 3.7% (more on that later)
Note that updates to the BLS' data make it difficult to compare Jan '24 to prior months, so this monthly change needs an important qualifier...
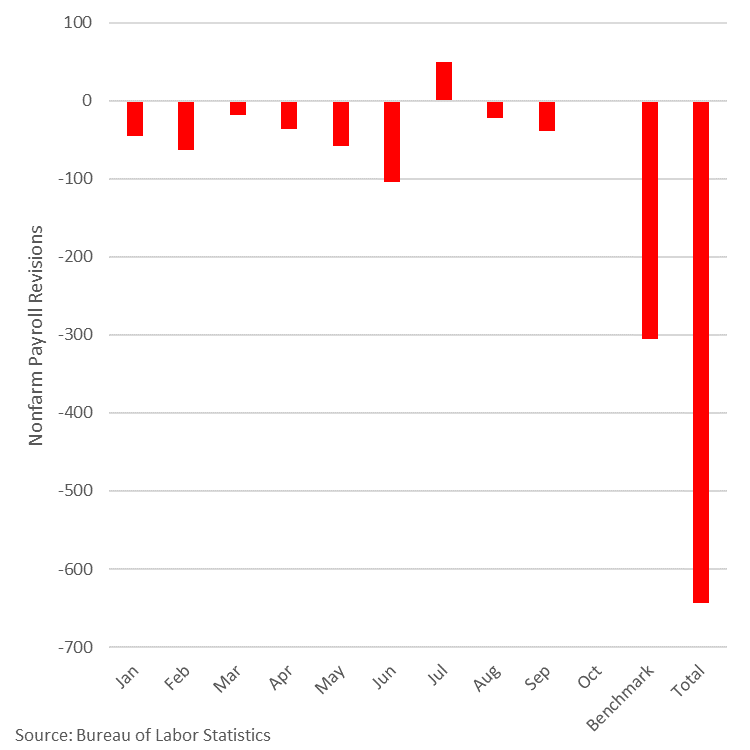
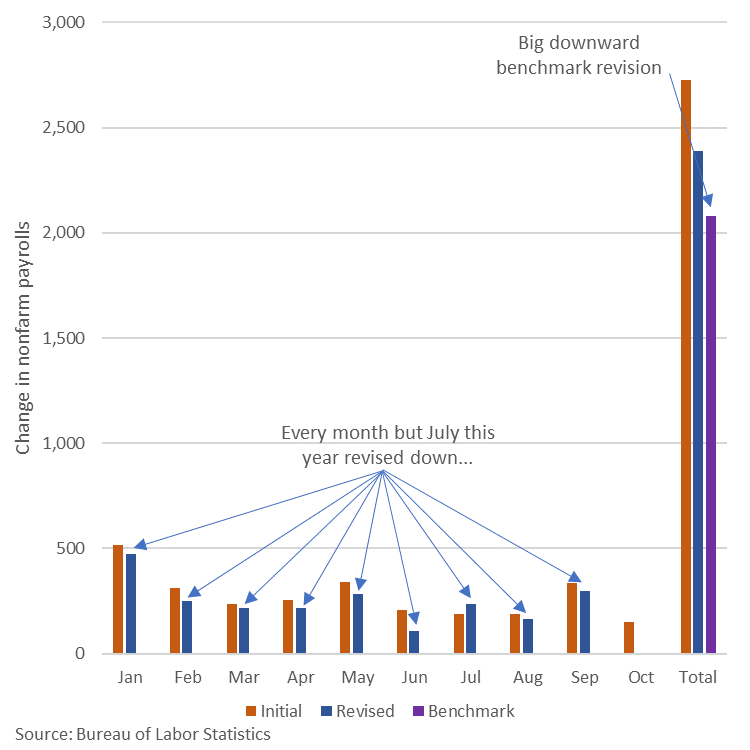
In brief, things once again look good b/c prior periods were revised down; the new seasonal adjustments and other changes reduced the number of payrolls in every month last year except Dec; cumulative monthly difference is -1.3 million w/ average monthly difference -126k... Image
So, do we have more jobs or not? Depends on which survey you look at: establishment survey, which allows for double counting, continues rising while household survey declines - there's an unprecedented gap btwn the 2 right now: Image
Another important divergence is part-time vs. full-time; even after adjusting for seasonal changes which are huge in Jan, economy still lost full-time jobs and only gained part-time jobs... Image
That's a continuation of an established trend: part-time has trended upward fairly consistently while full-time has leveled off; economy has lost ~1.6 million full-time jobs since Jun '23 and replaced them w/ ~1.6 million part-time jobs, which helps explain the next red flag... Image
Weekly hours are plummeting, now down to lowest level since covid lockdowns; aside from abnormalities of '20, it's at the lowest level since the Great Recession w/ housing meltdown and global financial crisis; firms are cutting hours and replacing full-time jobs w/ part-time: Image
As people work fewer hours, their paychecks buy less, even w/ hourly raises, b/c prices are still rising faster than weekly earnings; significantly higher hourly wages still leave workers behind - about 4.3% behind Jan '21... Image
As far as where the jobs are, they have overwhelmingly been created in gov't and gov't dominated/funded healthcare sector - take away both direct and indirect gov't expenditures funded by debt and Y/Y job growth turns negative, pointing to unsustainability... Image
Interesting to note who has the jobs: they've all gone to foreign-born workers; not only are native-born workers way below their pre-pandemic trend, but they're even below the pre-pandemic level (Jan '24 vs. Jan '20): Image
In just the last year, a net 193k native-born workers lost their jobs, while a net 1.2 million foreign-born workers gained jobs (important to use Y/Y comparisons w/ these datasets b/c they're not seasonally adjusted): Image
And the number of people missing from the labor force remains stubbornly high, artificially reducing the unemployment rate... Image
Depending on which methodology you prefer, you can calculate a more realistic unemployment rate that accounts for all of these missing workers: somewhere btwn 6.3% and 7.4% - that's not horrific, but significantly higher than "official" 3.7%... Image
TLDR: economy is still adding jobs, but they're overwhelmingly lower pay, fewer hours, and either directly or indirectly paid by gov't; also, Fed will need to look for a different excuse to cut rates and end QT - another banking crisis would fit the bill perfectly... Image

• • •

Missing some Tweet in this thread? You can try to force a refresh
 

Keep Current with E.J. Antoni, Ph.D.

E.J. Antoni, Ph.D. Profile picture

Stay in touch and get notified when new unrolls are available from this author!

Read all threads

This Thread may be Removed Anytime!

PDF

Twitter may remove this content at anytime! Save it as PDF for later use!

Try unrolling a thread yourself!

how to unroll video
  1. Follow @ThreadReaderApp to mention us!

  2. From a Twitter thread mention us with a keyword "unroll"
@threadreaderapp unroll

Practice here first or read more on our help page!

More from @RealEJAntoni

Jan 11
Dec CPI 🧵...
Inflation rips the stake out of its chest, looses a blood-chilling scream, and tells the Fed it's ready for another round; real weekly earnings are down 4.5% since Jan '21 and things are poised to get worse... Image
First, the headlines:
CPI up 0.3% M/M and 3.4% Y/Y
Core CPI (excludes volatile food & energy) up 0.3% M/M and 3.9% Y/Y
For all the talk of "disinflation," no one seems to have been paying attention to the trend that clearly shows us approaching 3%+ and not the 2% target... Image
Have to briefly mention health insurance, which I did a deep dive on previously; flawed methodology at BLS erroneously drove the index down for whole year, and now it's payback time, w/ index set to regain that ground in the months to come; up 1.1% M/M, down 27.1% Y/Y... Image
Read 13 tweets
Jan 5
Dec jobs report 🧵: there's SO much bad news under the hood of this report, including the economy shedding 1.5 million full-time jobs in a single month, big downward revisions, and a true unemployment rate between 6.4% and 7.5% - here's the truth you should know... Image
First, the headlines: nonfarm payrolls rose 216k on the backs of big downward revisions to previous months and unemployment rate remained unchanged at 3.7% - let's delve into why that rate is so low (hint: 676k people left the labor force in Dec)... Image
LFPR fell hard in Dec, closing the year well below pre-pandemic levels - this is artificially lowering the unemployment rate... Image
Read 18 tweets
Dec 8, 2023
Another round of very mixed data, but in line w/ recession early next year - here's a plan English, deep dive 🧵 on the Nov jobs report, including why the unemployment rate is much higher than the official number: Image
First, headlines: nonfarm payrolls up 199k, as jobs "increased in manufacturing, reflecting
the return of workers from a strike" exactly as expected; unemployment rate down to 3.7% amid surge in household survey employment (seasonal adj problem?)...
Downward revisions to previous data continue w/ Sep's last estimate unsurprisingly revised lower; 1/5 of all jobs initial added this year have been revised away: Image
Read 18 tweets
Nov 28, 2023
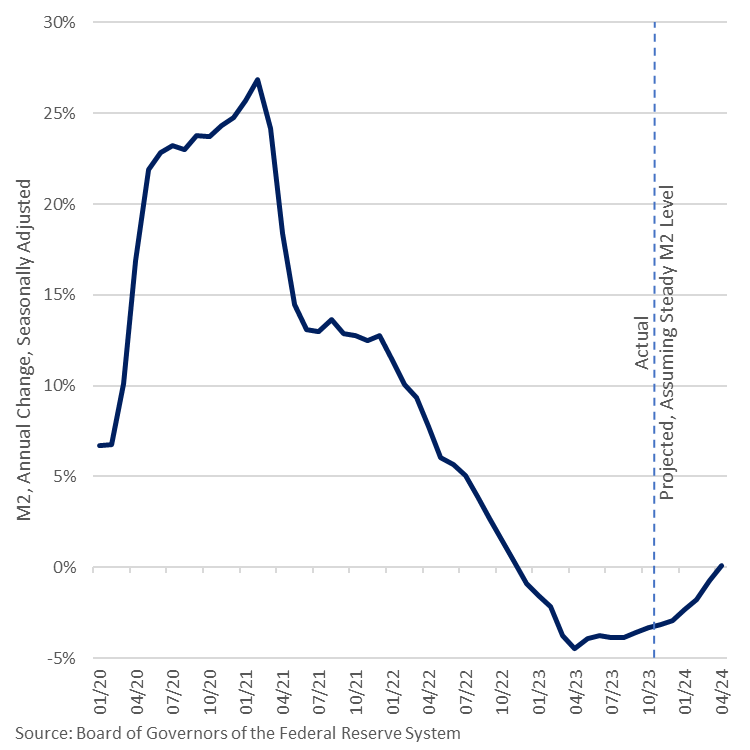
Short 🧵 on the money supply: M2 fell a mere 0.1% M/M in Oct and remains $3 trillion above its pre-pandemic trend; M2 is not "collapsing" as some are claiming: Image
Looking at the weekly figures shows that M2 has moved sideways since mid Apr '23 and is down just 6.0% from all-time record in Apr '22; it's still 35.2% above pre-pandemic level; we have a long way to go in this inflationary cycle: Image
After 6 more months of this holding pattern, the annual change in M2 will be back to zero, and that's assuming the Fed actually stays the course and doesn't yield to political pressure and get us there even faster... Image
Read 4 tweets
Nov 14, 2023
Here's a plain-English 🧵 on the Oct CPI report, including how the typical American family has lost the equivalent of $7,400 in annual pay since Jan '21; oh, and get ready for the most expensive Thanksgiving ever - Turkey isn't the only thing burning this year...
First, the headlines:
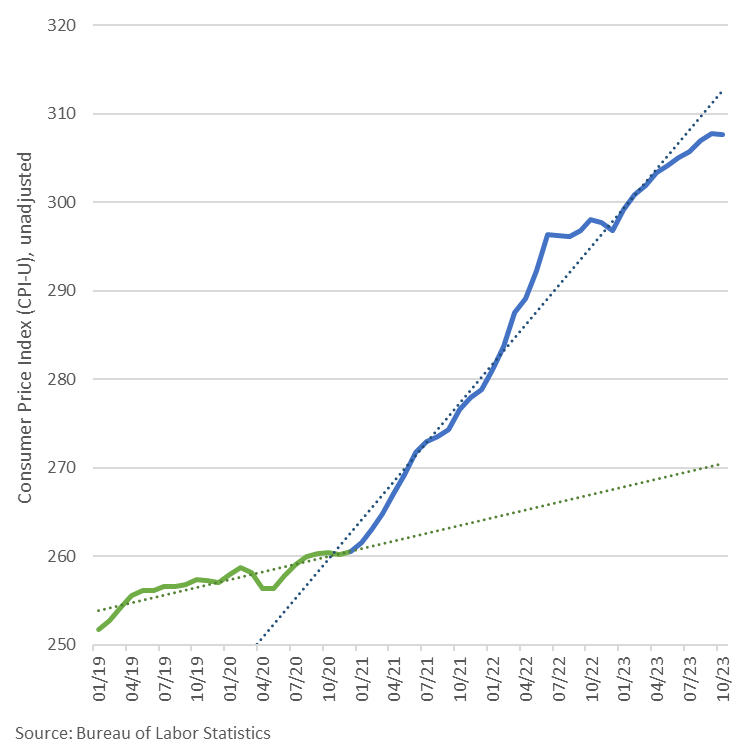
CPI components were mixed for the month with net change less than 0.1% since Sep; index is up 3.2% Y/Y while core (excludes food and energy) is up 4.0%, twice the Fed's alleged 2% target, but no one believes them anymore... Image
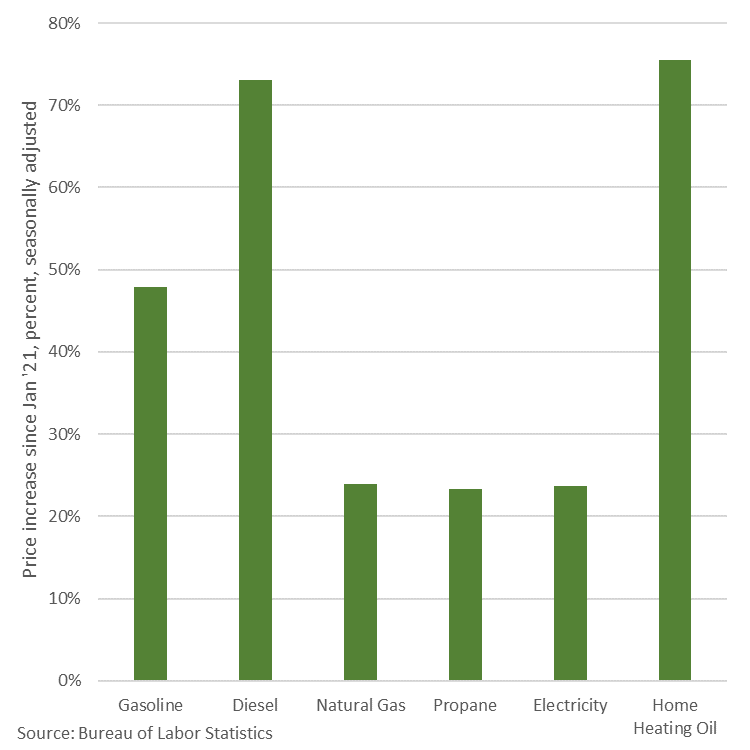
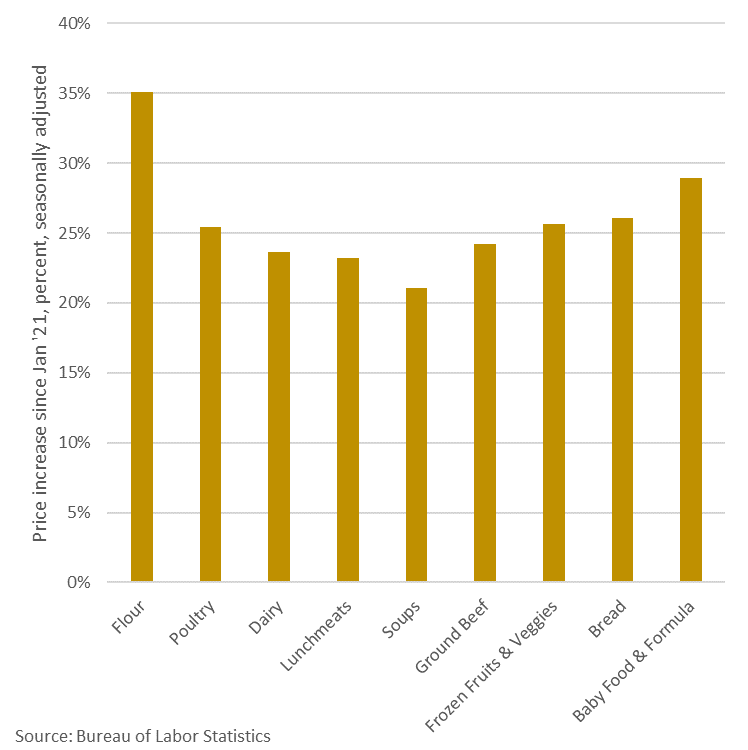
Prices are up over 17% since Jan '21 w/ many consumer staples up much more, like energy and food up over 20%...

Image
Image
Image
Read 11 tweets
Nov 3, 2023
Here's a plain-English 🧵 on the Oct jobs report, that not only points to recession, but that something is seriously wrong w/ BLS' initial data, and it needs to be taken with a BIG grain of salt... Image
First, the headlines:
Establishment survey gained 150k
Household survey LOST 348k, that's the biggest drop since Apr '20 (covid lockdown); it's an unprecedented divergence btwn the 2 surveys; BLS' firm birth/death model added 412k jobs in Oct that likely don't exist: Image
And the establishment survey continues to be revised down - hard - w/ 8 of 9 months revised down in '23; about a quarter of all jobs we initially thought were added this year weren't actually there; for context, the last two times this happened were going into recessions: Image
Read 12 tweets

Did Thread Reader help you today?

Support us! We are indie developers!


This site is made by just two indie developers on a laptop doing marketing, support and development! Read more about the story.

Become a Premium Member ($3/month or $30/year) and get exclusive features!

Become Premium

Don't want to be a Premium member but still want to support us?

Make a small donation by buying us coffee ($5) or help with server cost ($10)

Donate via Paypal

Or Donate anonymously using crypto!

Ethereum

0xfe58350B80634f60Fa6Dc149a72b4DFbc17D341E copy

Bitcoin

3ATGMxNzCUFzxpMCHL5sWSt4DVtS8UqXpi copy

Thank you for your support!

Follow Us!

:(