Ilkka Rauvola Profile picture
Feb 6, 2024 12 tweets 4 min read Read on X
25-49 year olds: Malignant neoplasms (tumors, cancers and lymphomas) (C00-D48)
1/x Image
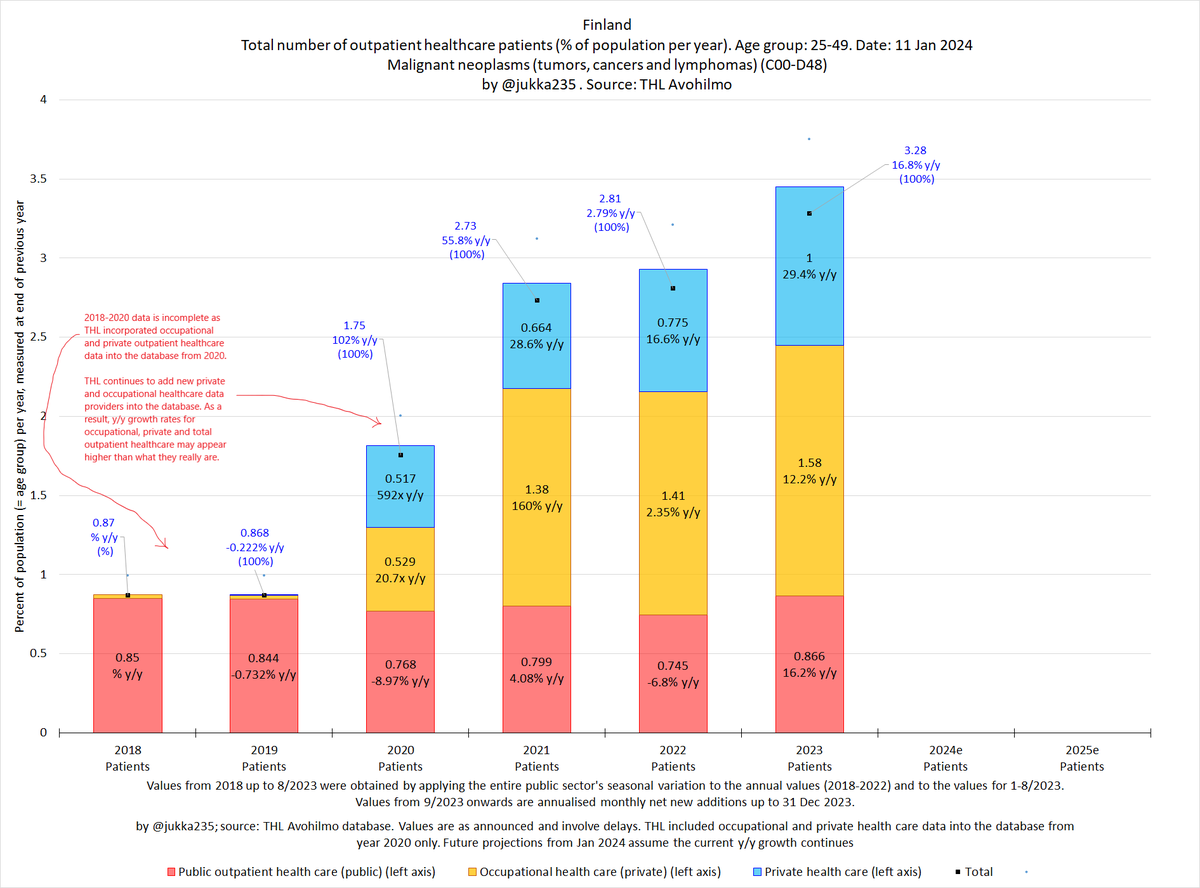
25-49 -vuotiaat: syövät, kasvaimet ja lymfoomat (C00-D48)
2/x Image
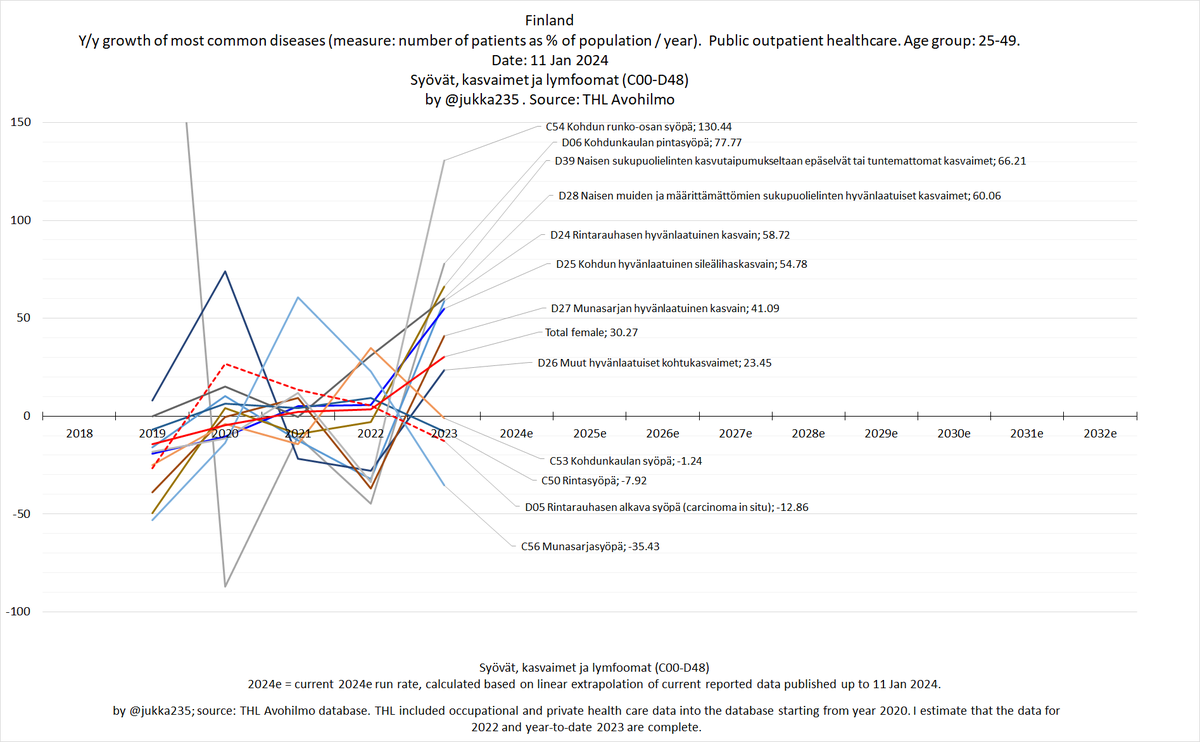
These are the 20 cancers, tumors, and lymphomas experiencing the fastest y/y patient growth in 2023. Together, they account for 12 percent of the total patient count. There is a significant representation of cancers and tumors affecting the female genital region.
3/x Image
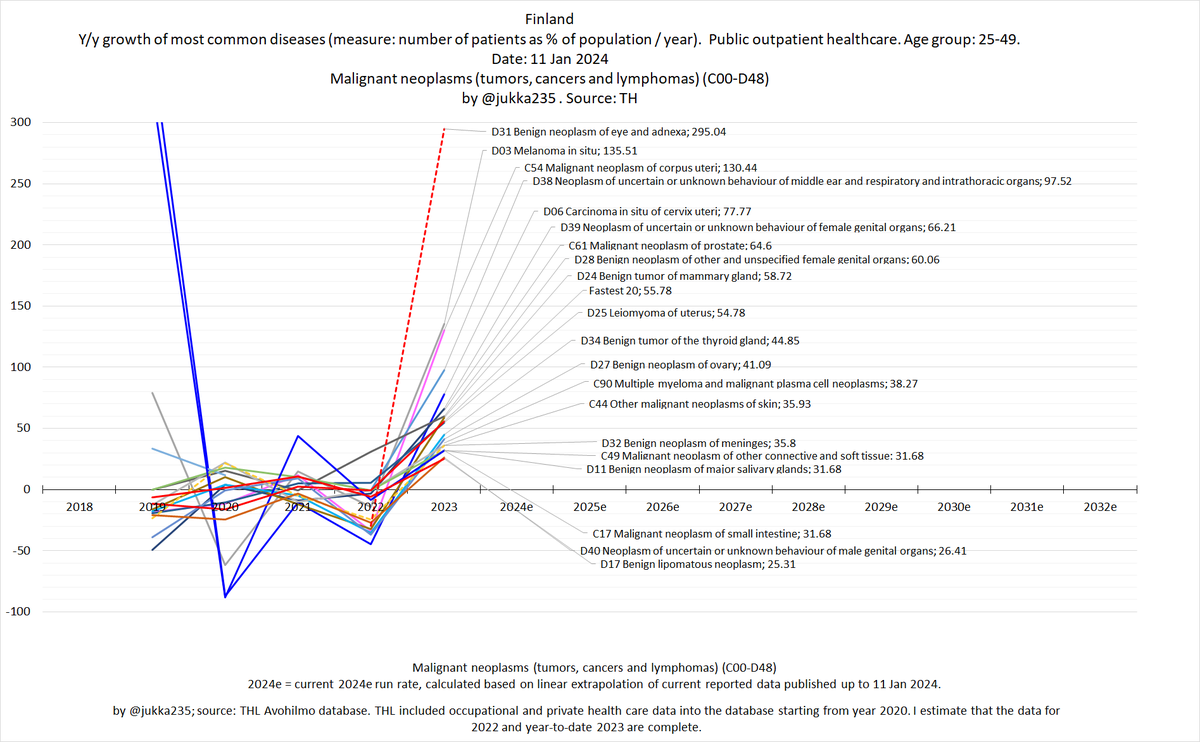
Tässä ovat 20 nopeimmin vuosittain kasvavaa syöpää, kasvainta ja lymfoomaa vuonna 2023. Ne muodostavat noin 12 prosenttia kokonaispotilasmäärästä. Naisten sukuelinten alueen syövillä ja kasvaimilla on merkittävä edustus.
4/x Image
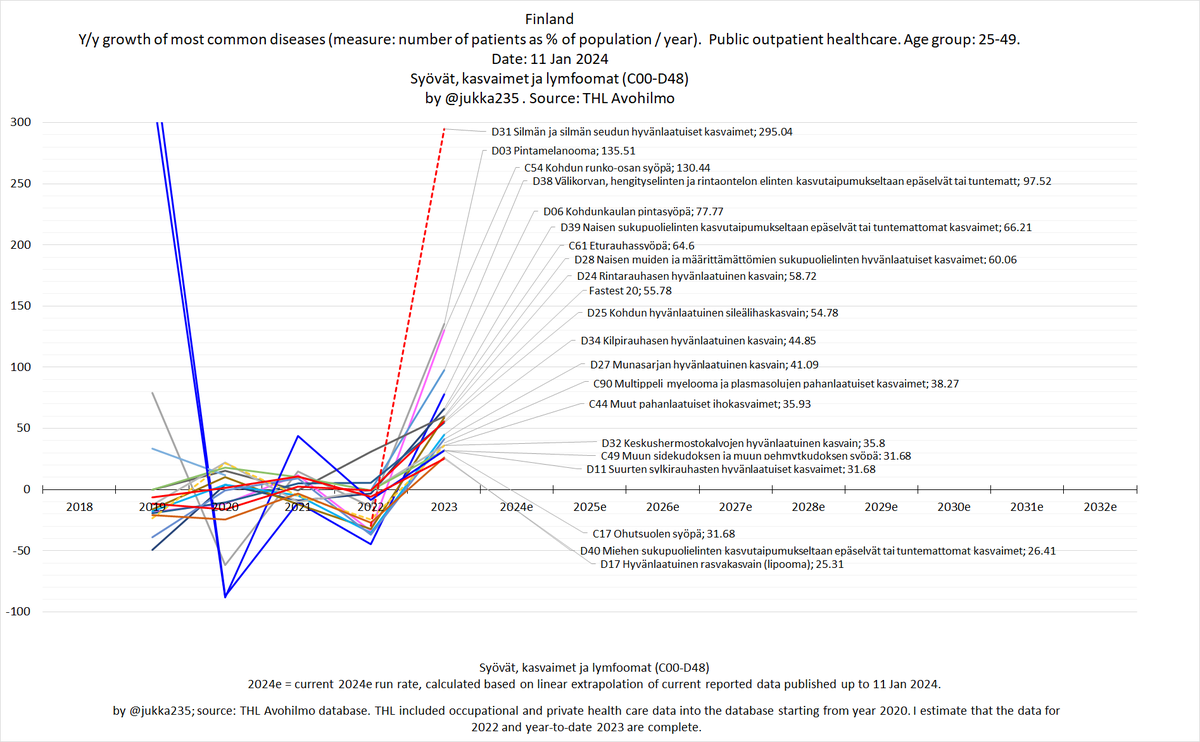
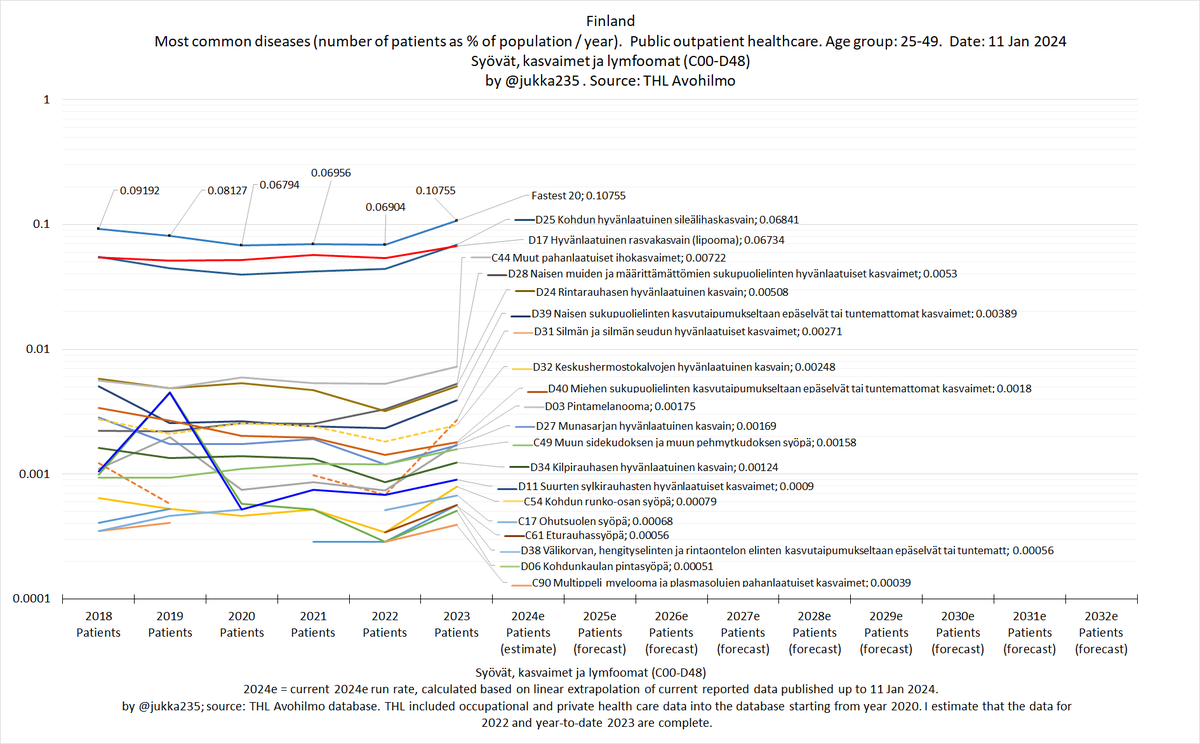
The 20 fastest growing cancers, tumors and lymphomas affect 0.1 percent of 25-49 year population. Weighted average y/y patient growth rate in 2023 is 56 percent per year (= 9 times in five years).
5/x Image
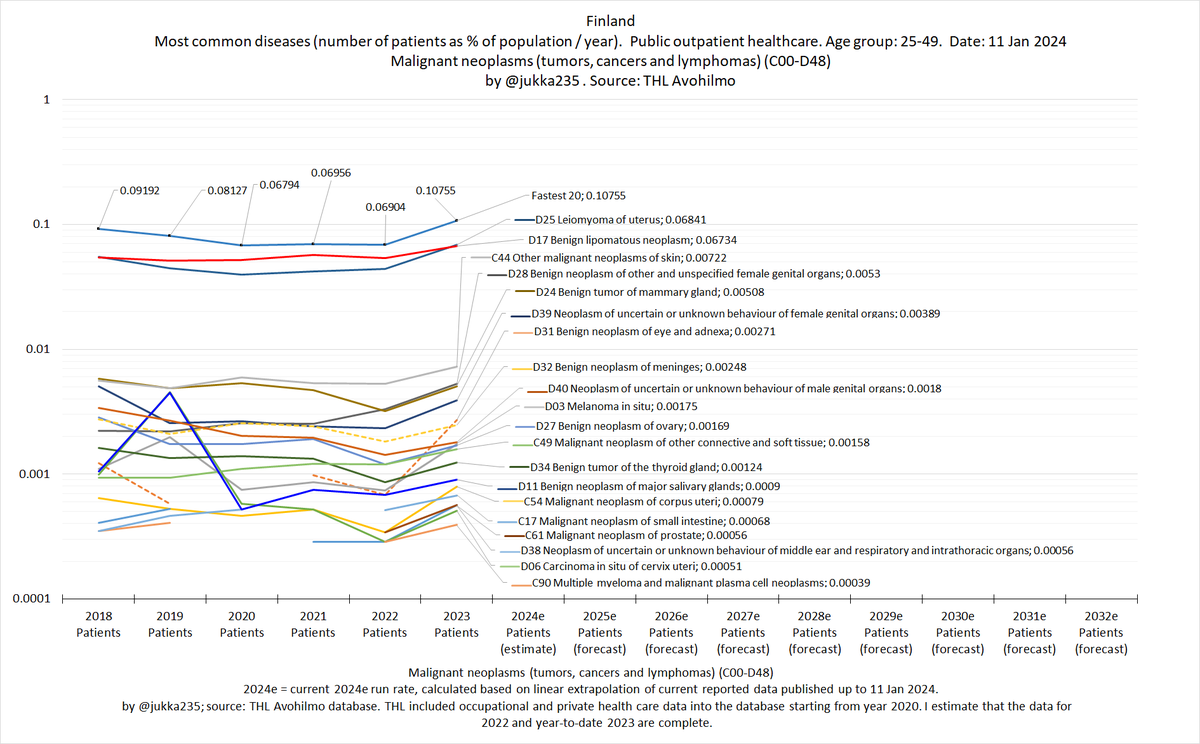
20 nopeimmin kasvavaa syöpää, kasvainta ja lymfoomaa vaikuttavat 0.1 prosenttiin 25–49-vuotiaiden väestöstä. Painotettu keskimääräinen v/v potilasmäärän kasvuvauhti vuonna 2023 on 56 prosenttia vuodessa (= 9-kertaistuu viidessä vuodessa).
6/x Image
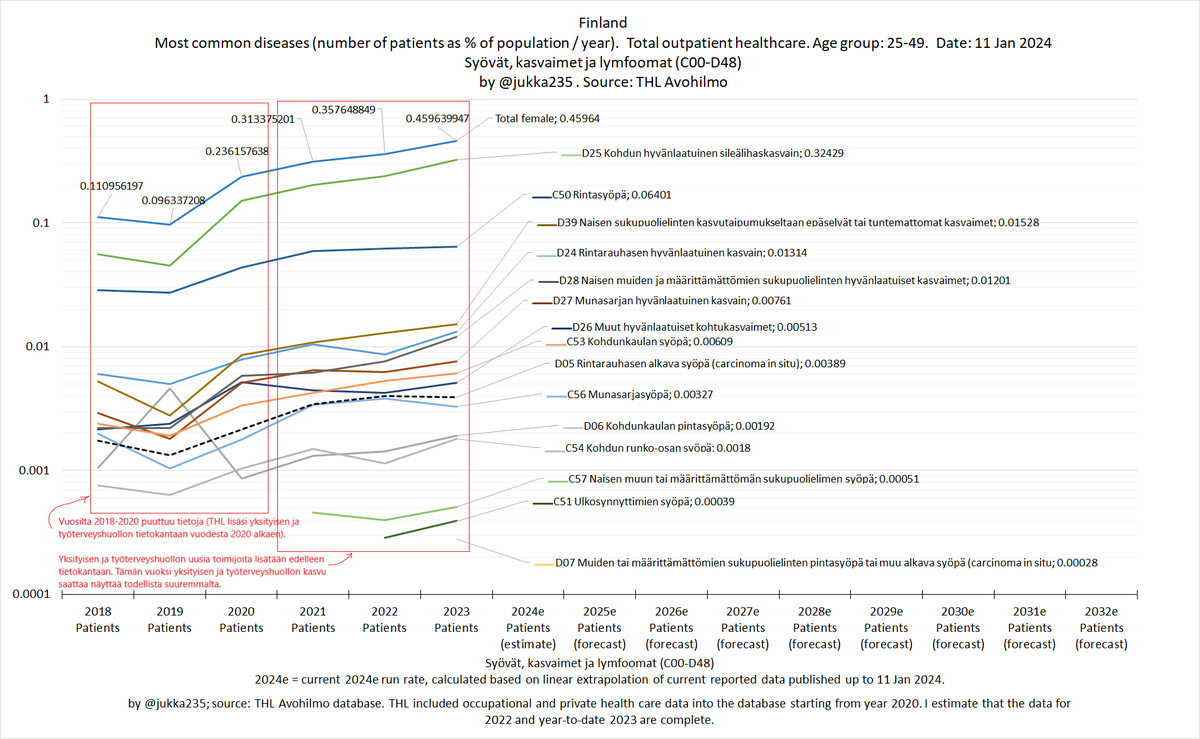
Next, let us review cancers, tumor and lymphomas in the female genital areas. In public outpatient healthcare, most of them have started to show significant y/y patient growth in 2023 (total y/y patient growth rate is 30 percent).
7/x Image
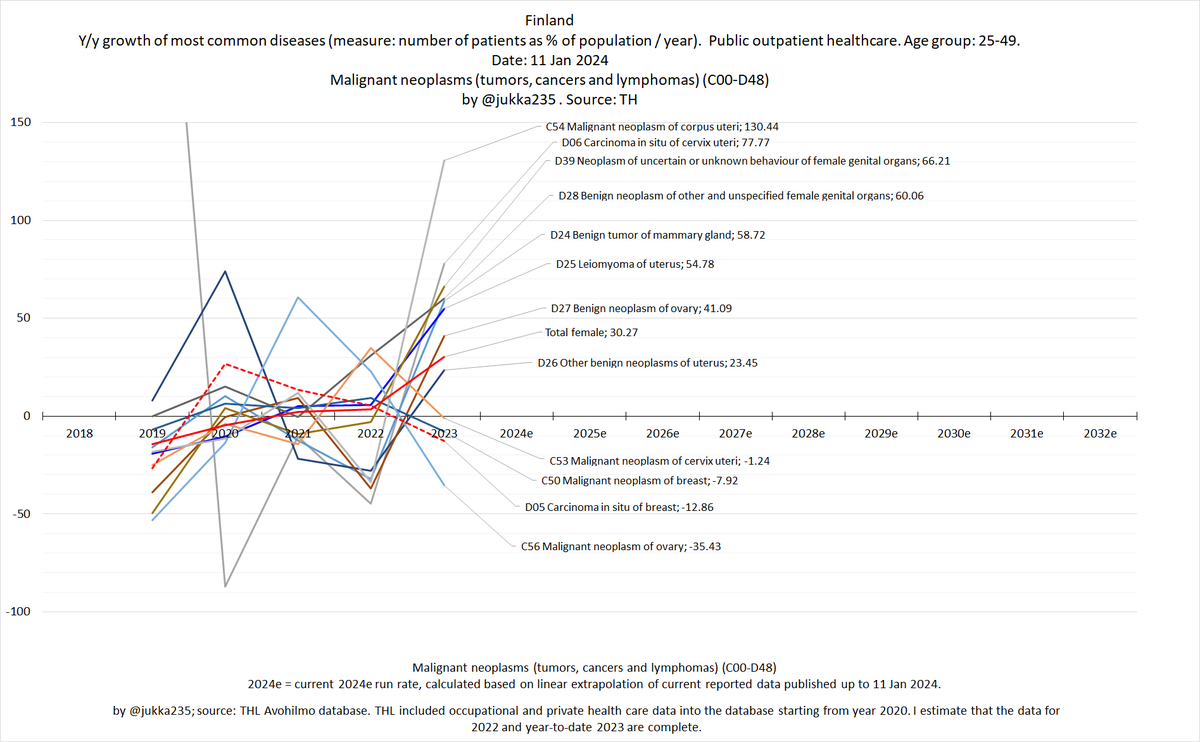
Katsotaan seuraavaksi naisen sukupuolielinten alueiden syöpiä ja kasvaimia. Julkisessa avoterveydenhuollossa useimmat niistä ovat alkaneet osoittaa merkittävää v/v potilasmäärän kasvua vuonna 2023. Keskimääräinen kasvuvauhti vuonna 2023 on 30 prosenttia.
8/x Image
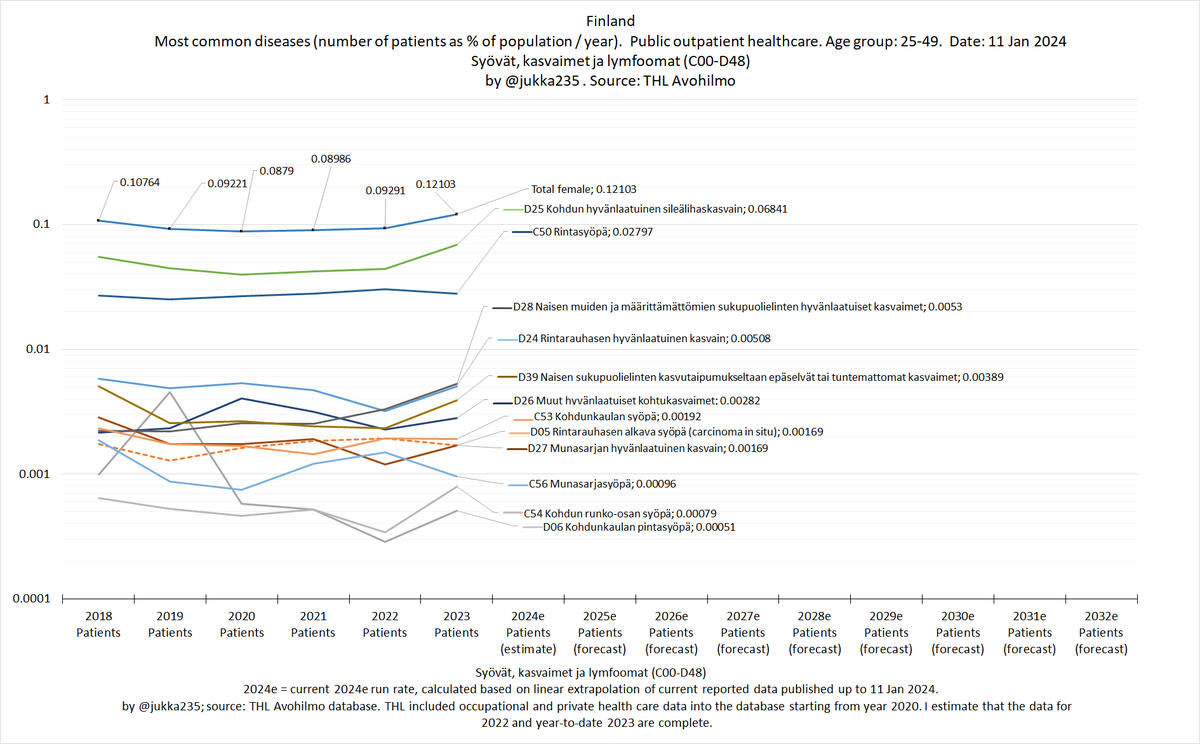
Cancers and tumors in female genital areas affect roughly 0.24 percent of 25-49 year old female population. The figure is growing 30 percent annually (= 10 times in ln(10)/ln(1.3) = 9 years). These figures include public outpatient healthcare only.
9/x Image
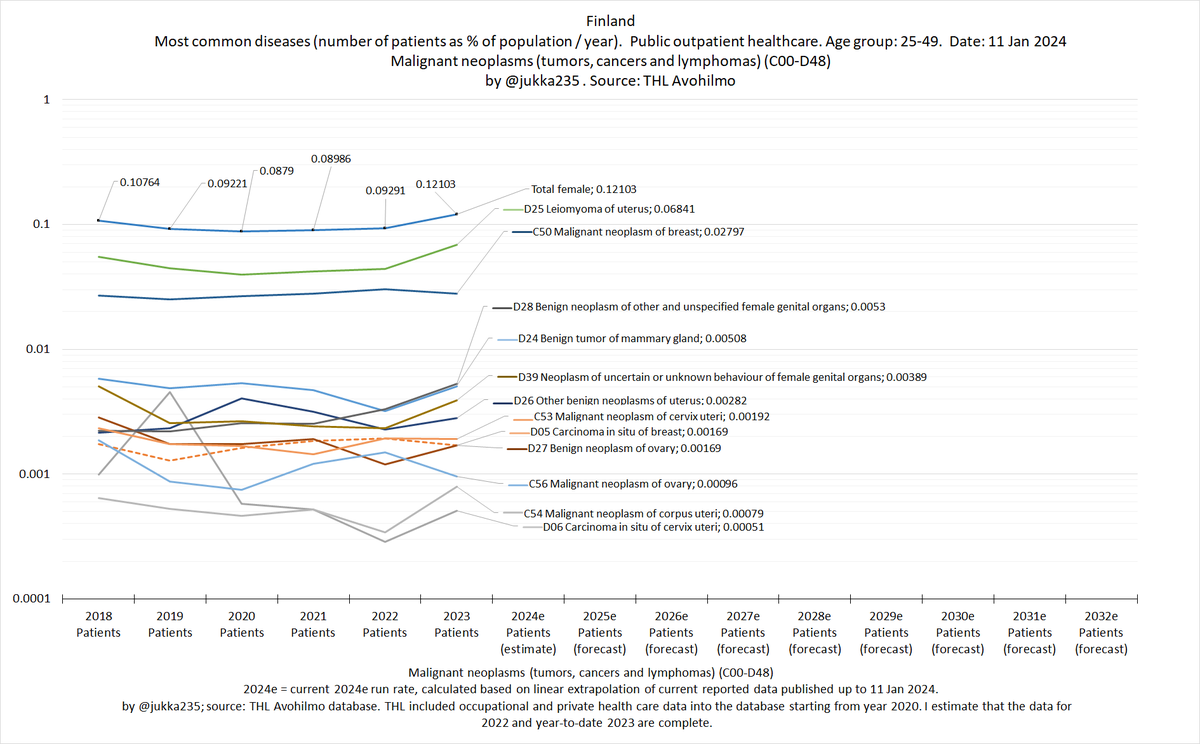
Naisten sukuelinten alueen syövät ja kasvaimet vaikuttavat noin 0.24 prosenttiin 25–49-vuotiaasta naisväestöstä. Luku kasvaa 30 prosenttia vuosittain (= 10-kertaistuu ln(10)/ln(1.3) = 9 vuodessa). Yksityinen ja työterveyshoito puuttuvat näistä luvuista.
10/x Image
In total outpatient healthcare, cancers and tumors in the female genital area affect roughly 0.459x2 = 0.92 percent of 25-49 year old females, and the figure is growing 28.5 percent annually (10 times in ln(10)/ln(1.285) = 9 years).
11/x Image
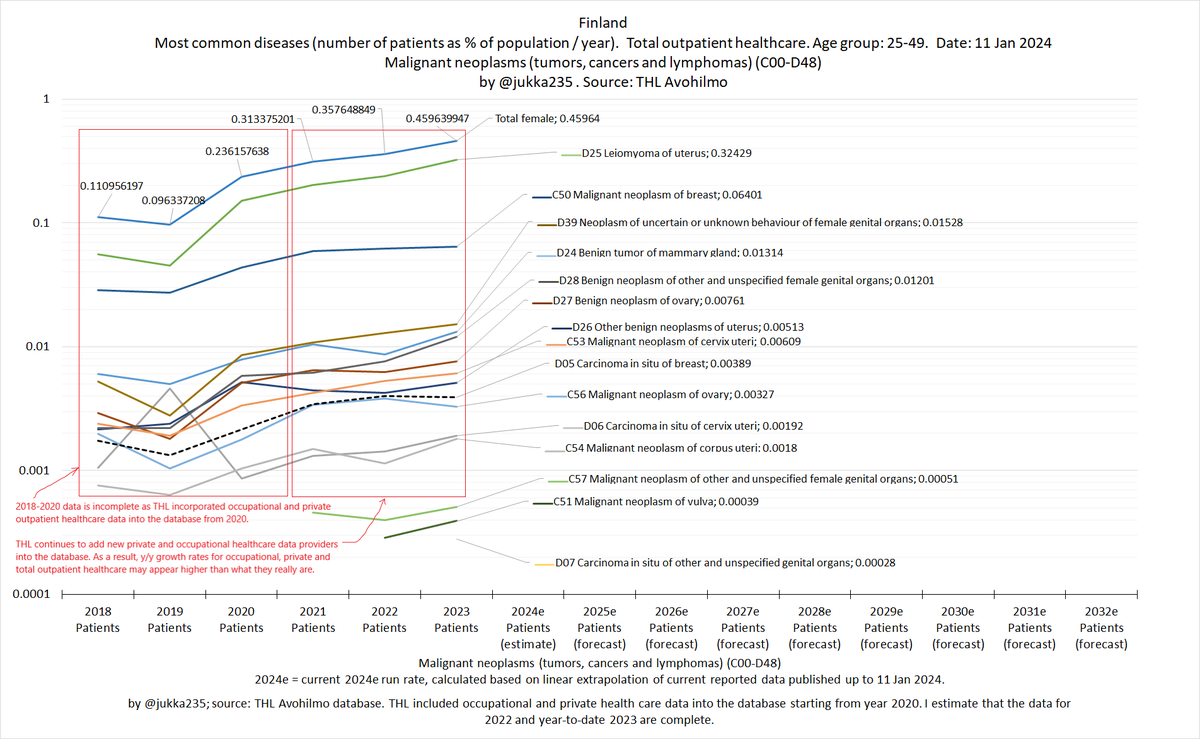
Koko avoterveydenhuollossa naisten sukuelinten alueen syövät ja kasvaimet vaikuttavat noin 0.459x2 = 0.92 prosenttiin 25–49-vuotiaista naisista, ja määrä kasvaa 28.5 prosenttia vuosittain (eli 10-kertaistuu ln(10)/ln(1.285) = 9 vuodessa).
12/x Image

• • •

Missing some Tweet in this thread? You can try to force a refresh
 

Keep Current with Ilkka Rauvola

Ilkka Rauvola Profile picture

Stay in touch and get notified when new unrolls are available from this author!

Read all threads

This Thread may be Removed Anytime!

PDF

Twitter may remove this content at anytime! Save it as PDF for later use!

Try unrolling a thread yourself!

how to unroll video
  1. Follow @ThreadReaderApp to mention us!

  2. From a Twitter thread mention us with a keyword "unroll"
@threadreaderapp unroll

Practice here first or read more on our help page!

More from @jukka235

Feb 13
Mortality in Sweden: Are the causes of death that are increasing among 0-4, 5-9 and 10-14 year olds also rising in older age groups?

Let's find out.
1/x Image
These causes collectively represent all causes of death that are rising among 0-4, 5-9 and 10-14 year olds. Among 0-4 year olds, their average growth rate (2019-2024) is 13.5%.
2/x Image
Among 5-9 year olds the average annual growth rate (2019-2024) is 33.8 percent (10-fold in 7.9 years if this growth rate continues).
3/x Image
Read 18 tweets
Feb 9
Mortality of children aged 0-4 in Sweden.
1/x Image
Among 0-4 year olds, the 19 causes of death with the highest growth (2004 compared with the 1997-2019 average) have increased since 2019 at an average rate of 51% per year.
2/x Image
Among 0-4 year olds, adding the next 18 causes brings the total to the top 37 fastest growing causes of death. Together, these have increased since 2019 at an average rate of 24.6% per year, compared with just 0.6% per year during 1997-2019.
3/x Image
Read 6 tweets
Feb 8
Mortality of 10-14 year olds in Sweden.
1/x Image
Here are the 19 leading causes of death among 10-14 year olds, ranked by their 2024 incidence compared to the 1997-2019 average. Together, they account for 35% of all deaths in 2024.
2/x Image
Here are the next 18 diseases. Combined, these causes represent 60% of all deaths in 2024, and have an average growth rate of 33.7% per year between 2019 and 2024 (10 times in 7.9 years).
3/x Image
Read 8 tweets
Jan 14
This is an important moment.

After more than five years of silence, mainstream media has begun to acknowledge that C19 can harm T cells, and to discuss the consequences that follow. @fitterhappierAJ was one of the first, if not the first, to talk about this.
1/x
Dr. Leonardi has provided a significant amount of direction for me. In particular, he has been interviewed in some excellent articles that have withstood the test of time. Here is one of them.
2/x

thetyee.ca/Analysis/2022/…
We have seen it all.
- in 2020, they said that our health systems are so robust that this disease wouldn't come here
- then they wanted them infected. C19 was de facto allowed to spread in schools. Only a small fraction of <12 year olds received ...
3/x

koronatilastot.fi/fi/rokotukset/Image
Read 8 tweets
Jan 9
Something is causing injuries among young children.
1/x Image
Something changed in 2022. Before that, the numbers were generally falling. Wonder what it could be.
2/x Image
After 2022, 1-6 year olds have overtaken a total of three other age groups (50-64, 15-24 and 65-74 year olds), and are now clearly above the total population average. All injuries (S00-S99).
3/x Image
Read 6 tweets
Jan 9
Developmental delays and disorders (F80-F89).
1/x Image
Between 2020 and 2025e, the number of patients with developmental delay or disorder diagnoses grew at an average annual rate of 21.6% (10x in 11.8 years). The fastest patient growth was seen in pervasive developmental disorders, incl. autism and Asperger syndrome (F84).
2/x Image
Image
Among total population, number of patients with developmental delay or disorder diagnoses is up 2.6 times since 2020. All disorders are showing continued significant patient growth.
3/x Image
Image
Read 11 tweets

Did Thread Reader help you today?

Support us! We are indie developers!


This site is made by just two indie developers on a laptop doing marketing, support and development! Read more about the story.

Become a Premium Member ($3/month or $30/year) and get exclusive features!

Become Premium

Don't want to be a Premium member but still want to support us?

Make a small donation by buying us coffee ($5) or help with server cost ($10)

Donate via Paypal

Or Donate anonymously using crypto!

Ethereum

0xfe58350B80634f60Fa6Dc149a72b4DFbc17D341E copy

Bitcoin

3ATGMxNzCUFzxpMCHL5sWSt4DVtS8UqXpi copy

Thank you for your support!

Follow Us!

:(