ICT Balance Price Range - How To Use Them
A Thread 🧵
A Thread 🧵
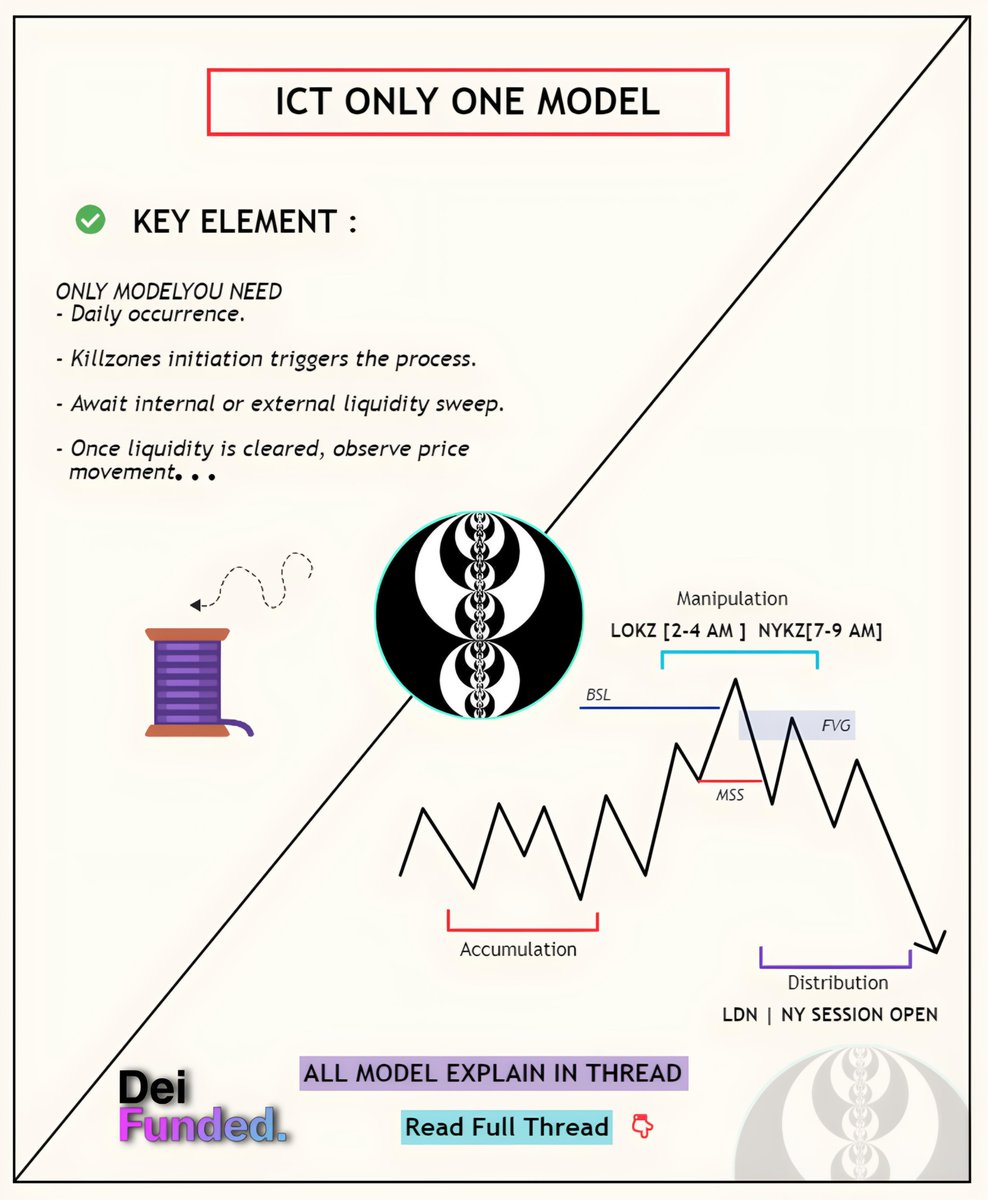
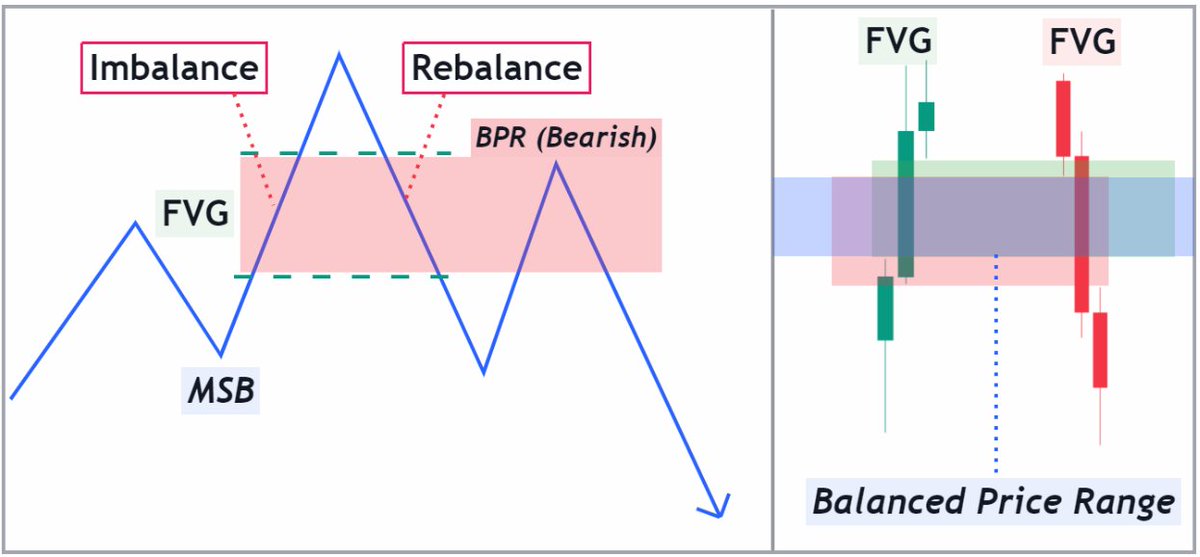
What is Balance price range?
- BPR refers to a specific area in price history where there has been a significant movement to the upside and a significant movement to the downside.
- This can be used as a key level of support and resistance for traders and investors to watch.
- BPR refers to a specific area in price history where there has been a significant movement to the upside and a significant movement to the downside.
- This can be used as a key level of support and resistance for traders and investors to watch.
- The Balance Price Range (BPR) serves as critical support and resistance.
- When the price reaches the upper or lower BPR bounds, it often rebounds.
- Such rebounds indicate possible buying or selling chances.
- When the price reaches the upper or lower BPR bounds, it often rebounds.
- Such rebounds indicate possible buying or selling chances.
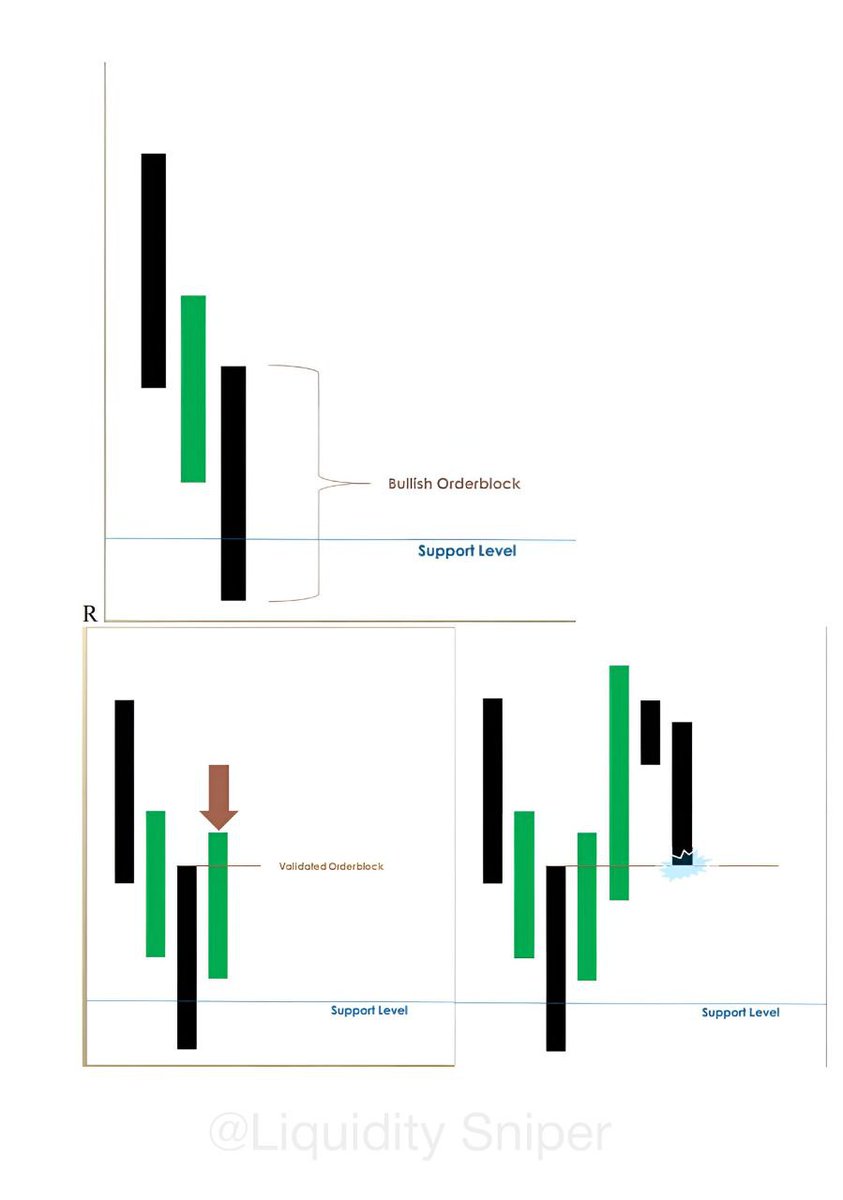
To properly mark BPR, arrangements are made in different steps as mentioned below.
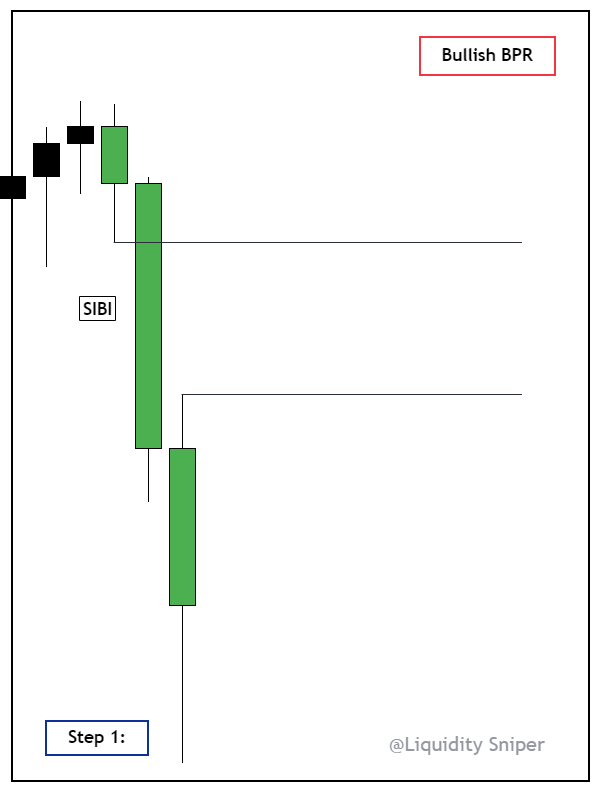
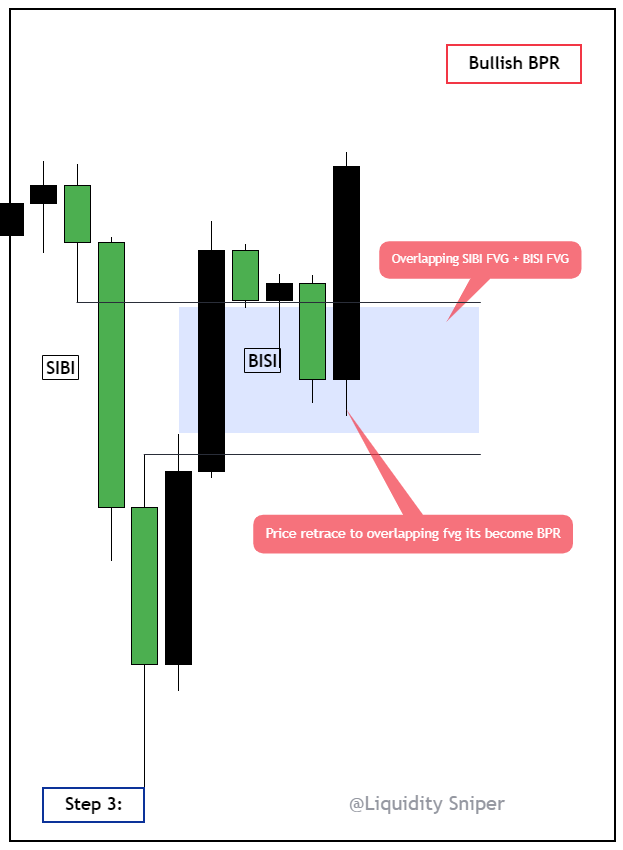
Bullish BPR Example:-
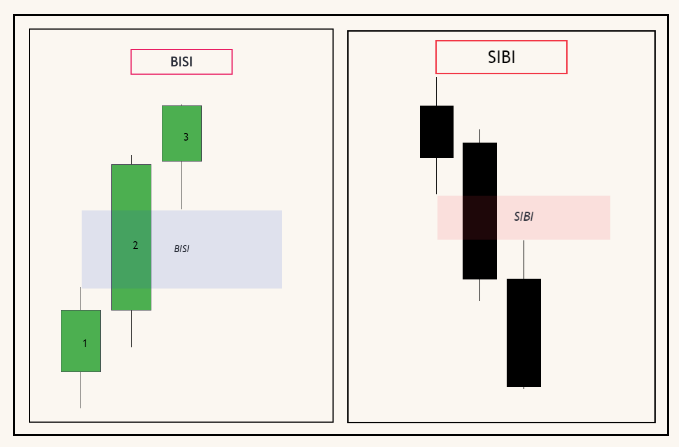
Step 1 : Mark SIBI (FVG)
Bullish BPR Example:-
Step 1 : Mark SIBI (FVG)
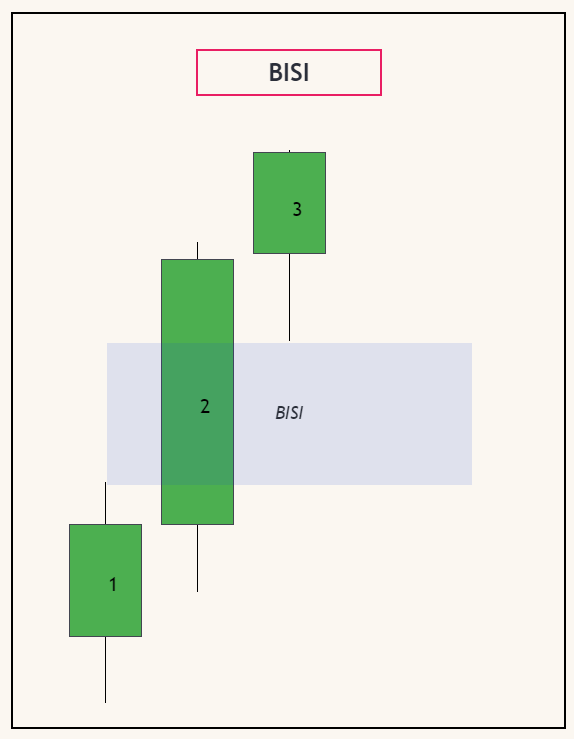
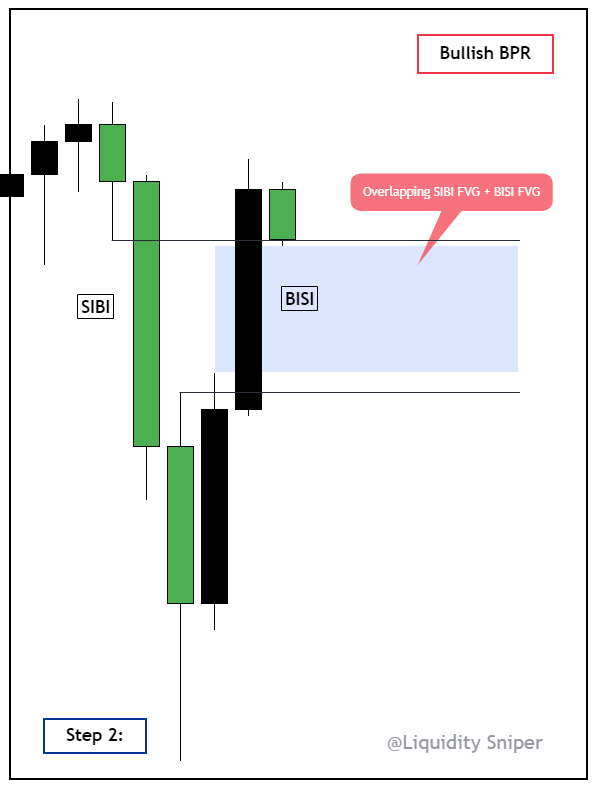
Step 2 : Mark BISI (FVG)
Step 3 : After mark BPR execution
There are two types of Balanced Price Ranges (BPR): Bullish and Bearish BPRs, which can occur on all timeframes.
In this thread, I will explain both types, provide examples, and offer guidance on how to use them for both short-term and long-term trading.
In this thread, I will explain both types, provide examples, and offer guidance on how to use them for both short-term and long-term trading.

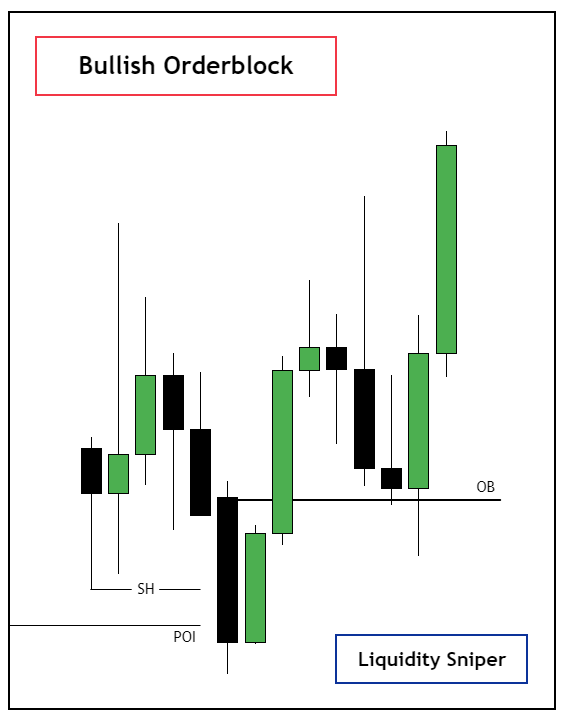
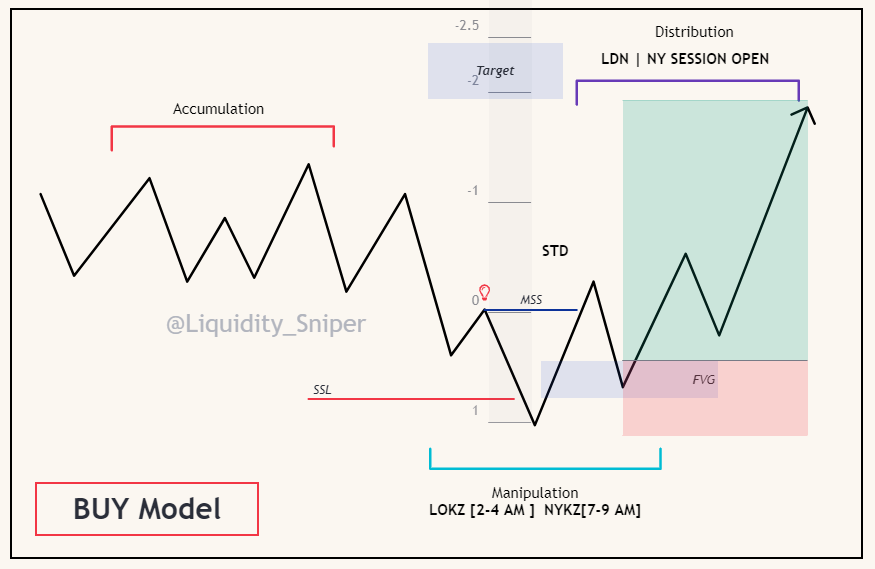
Bullish BPR (+BPR)
- BPR+ occurs when there's an aggressive move down immediately followed by an aggressive move up.
- The move down creates a SIBI FVG, and the move up creates a BISI FVG, which overlaps the SIBI FVG.
- It becomes a BPR once price retests where the FVGs overlap.
- BPR+ occurs when there's an aggressive move down immediately followed by an aggressive move up.
- The move down creates a SIBI FVG, and the move up creates a BISI FVG, which overlaps the SIBI FVG.
- It becomes a BPR once price retests where the FVGs overlap.

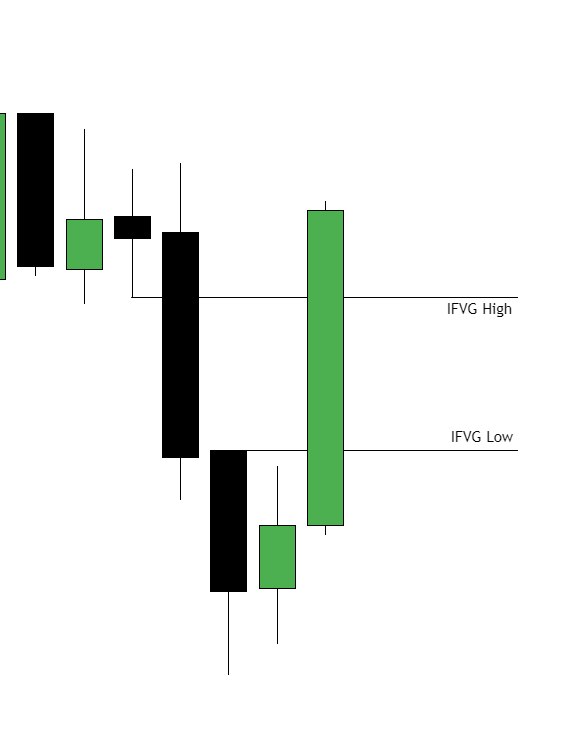
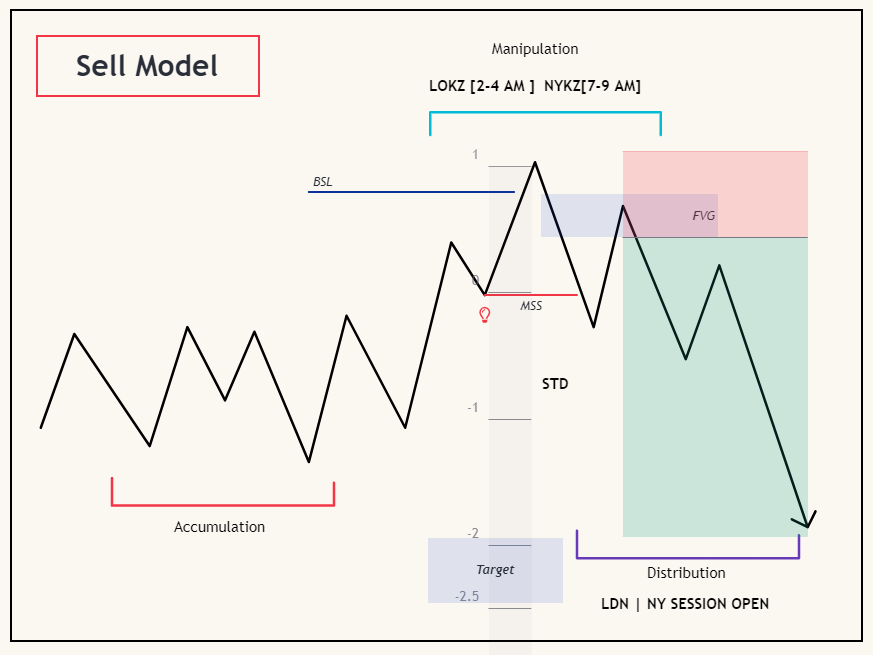
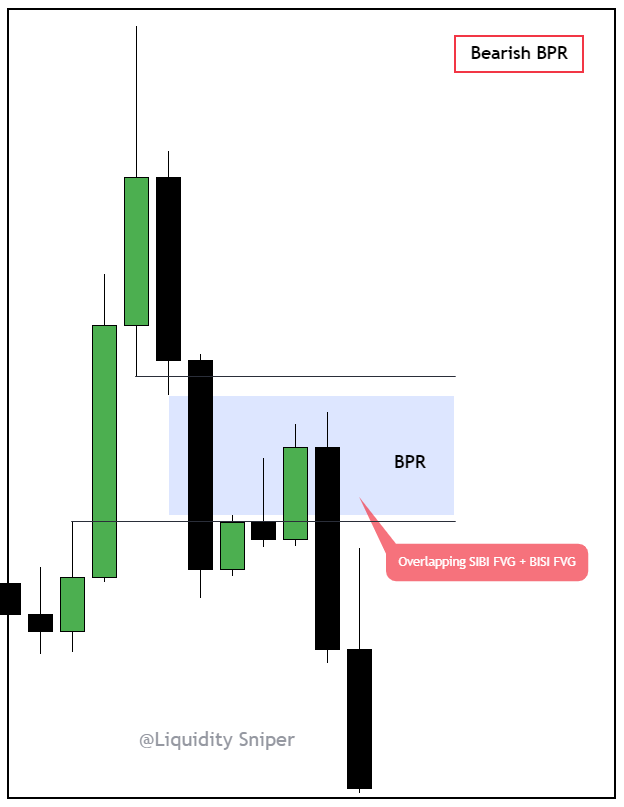
Bearish BPR (-BPR)
- BPR- occurs when there's an aggressive move up immediately followed by an aggressive move down.
- The move up creates a BISI FVG, and the move down creates a SIBI FVG, which overlaps the BISI FVG.
- It becomes a BPR once price retests where the FVGs overlap.
- BPR- occurs when there's an aggressive move up immediately followed by an aggressive move down.
- The move up creates a BISI FVG, and the move down creates a SIBI FVG, which overlaps the BISI FVG.
- It becomes a BPR once price retests where the FVGs overlap.

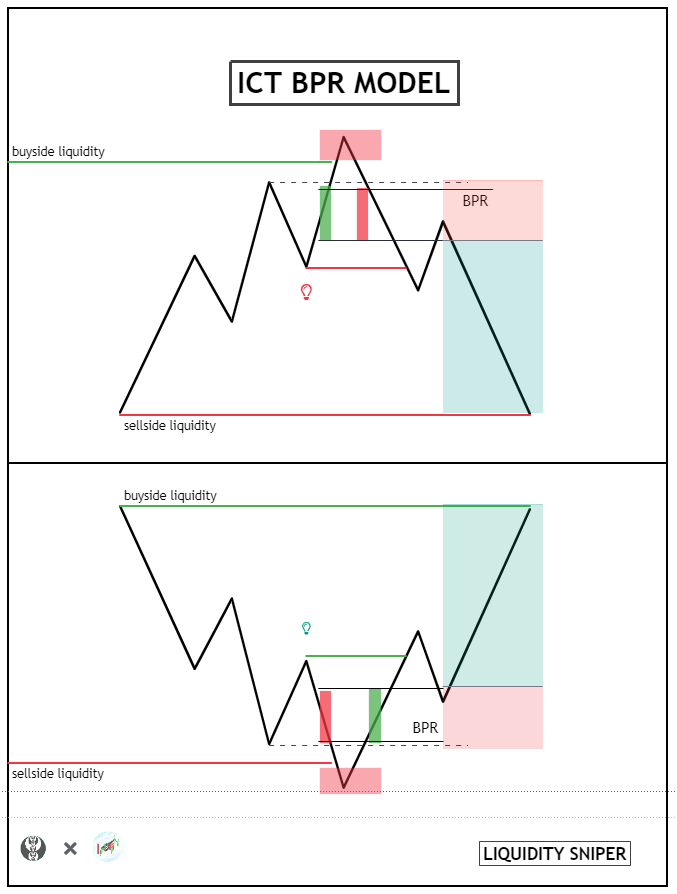
ICT BPR MODEL :
- Wait for price to hit a higher time frame (HTF) resistance level.
- Wait for the price to close below the BPR.
- When the next candle closes below the BPR, anticipate a rapid shift from Buy Side to Sell Side.
- Aim for a profit of at least 2R.
- Wait for price to hit a higher time frame (HTF) resistance level.
- Wait for the price to close below the BPR.
- When the next candle closes below the BPR, anticipate a rapid shift from Buy Side to Sell Side.
- Aim for a profit of at least 2R.
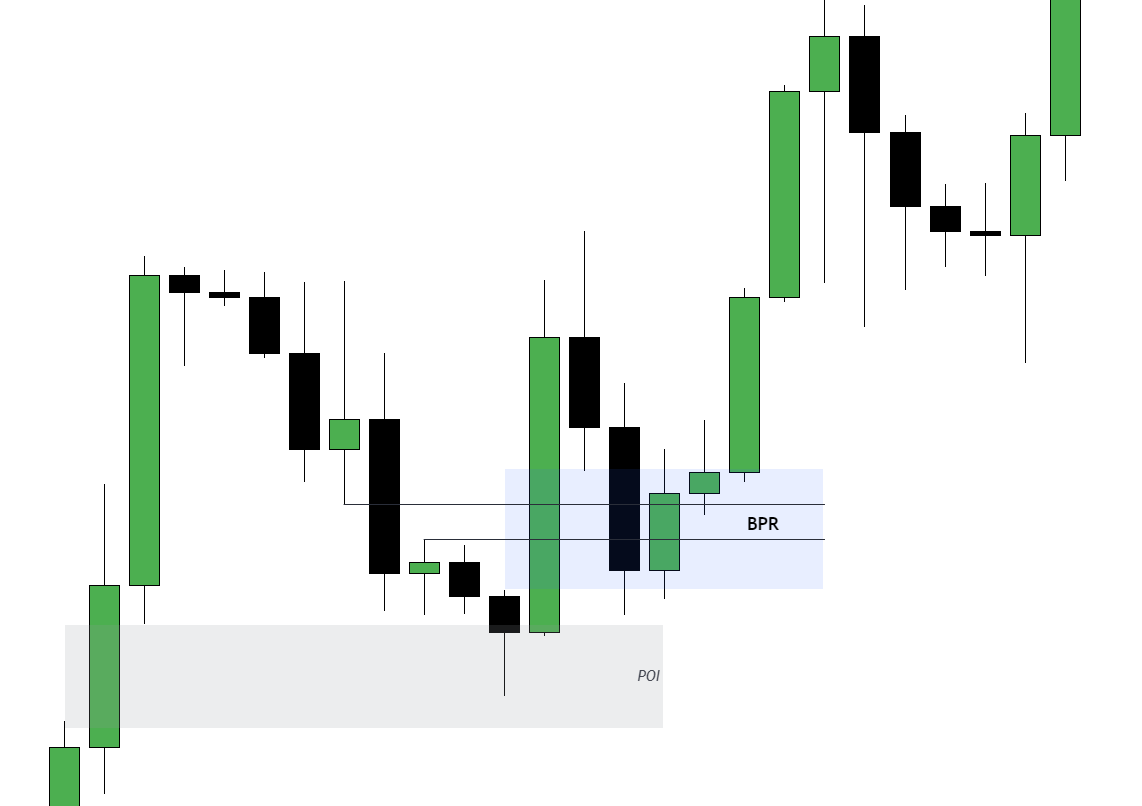
Example :

Example 2 :
Join for Educational content and weekly layout👇 :
t.me/Liquidity_Snip…
t.me/Liquidity_Snip…

• • •
Missing some Tweet in this thread? You can try to
force a refresh