Manufacturing Alpha (XLI, XLE, XHB)
1. Overall, the manufacturing complex remains the weakest link in the macro economy, with pressures
persistent but somewhat moderating. The sector has also been a primary driver of the variation in profitability.
1. Overall, the manufacturing complex remains the weakest link in the macro economy, with pressures
persistent but somewhat moderating. The sector has also been a primary driver of the variation in profitability.
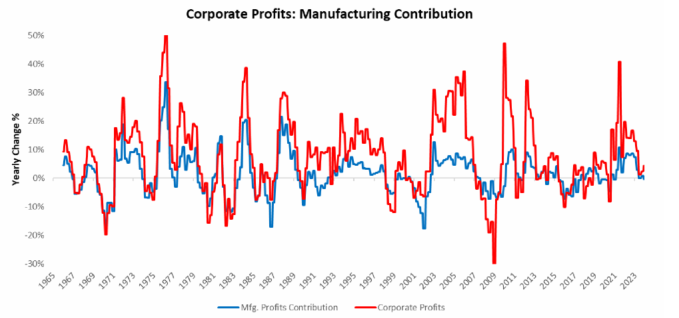
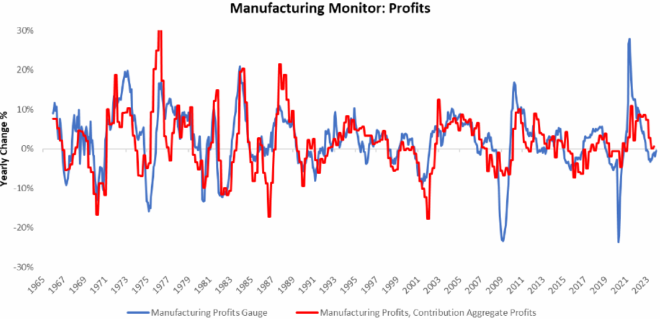
2. We visualize this importance above by showing the contribution of manufacturing sector profits to aggregate corporate profits. As we can see above, manufacturing profits have already begun to weigh on the broader corporate profit picture.
3. If manufacturing profits continue to decline, it will weigh on broader corporate and employment conditions. We assess the drivers of profitability to better understand the dynamics at play.
4. Like any business, profits are a function of the sales generated relative to the costs incurred. At the macro level, the primary driver of these costs tends to be labour costs in the form of wages. Below, we visualize these principal drivers of profitability:
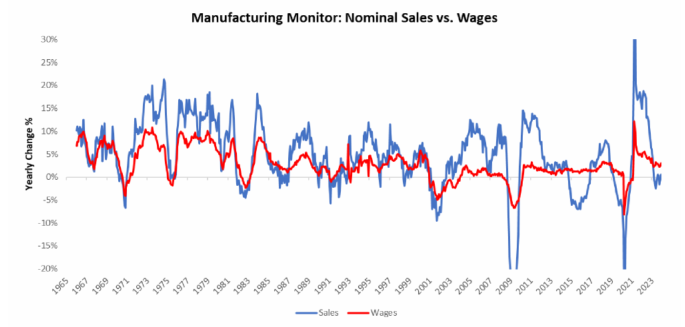
4. As we can see above, wages' resilience relative to sales declines is creating significant pressures on
corporate profitability.
corporate profitability.
5. To better understand the macro drivers of these wage trends, we decompose total labor costs into their constituent drivers- changes in employment, hours worked, and hourly wages. Below we show this decomposition:
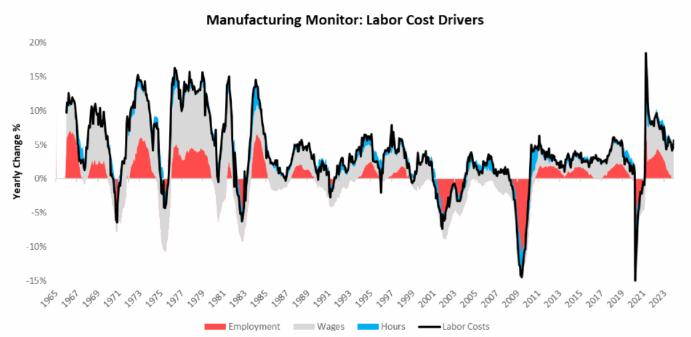
6. Note that the primary driver of wage costs today is hourly wage rates rather than
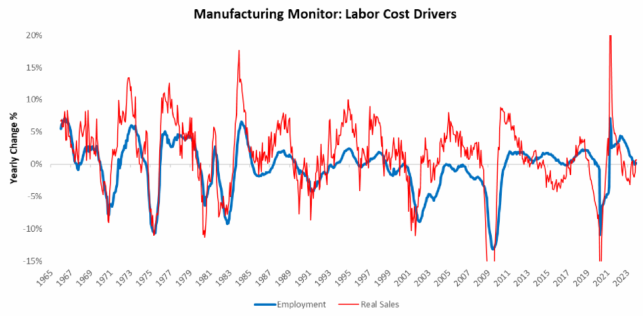
employment. This dynamic reflects a fundamental condition, i.e., the purpose of employment growth is
output growth. With real sales growth muted, employment has followed suit:
employment. This dynamic reflects a fundamental condition, i.e., the purpose of employment growth is
output growth. With real sales growth muted, employment has followed suit:
7. While labor costs driven by employment are variable based on output, labor costs from wage increases
tend to be far more persistent and slow-moving. We isolate changes in wages below:
tend to be far more persistent and slow-moving. We isolate changes in wages below:
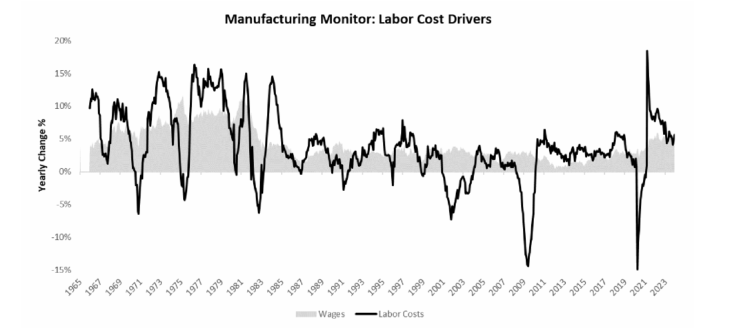
8. Given the stickiness of wages and the large share of labor costs they currently demand, we think it is
reasonable to expect labor costs to be an ongoing pressure on manufacturing profits. Now we turn to underlying measures of demand conditions.
reasonable to expect labor costs to be an ongoing pressure on manufacturing profits. Now we turn to underlying measures of demand conditions.
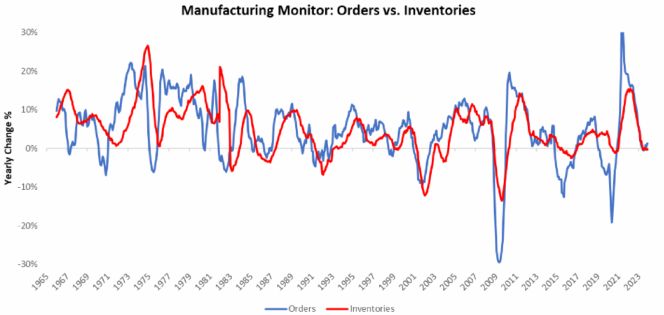
9. Particularly, we look at the growth of new orders and inventories. New orders drive sales, and sustained growth in new orders increases inventories. Excessively large gaps between these two variables are unsustainable and likely to be resolved in favor of new orders.
10. To further understand demand conditions, we now turn to production and capacity utilization measures. Production is the primary engine for the growth of the manufacturing sector over time. However, existing capacity constraints have limited the degree of expansion:
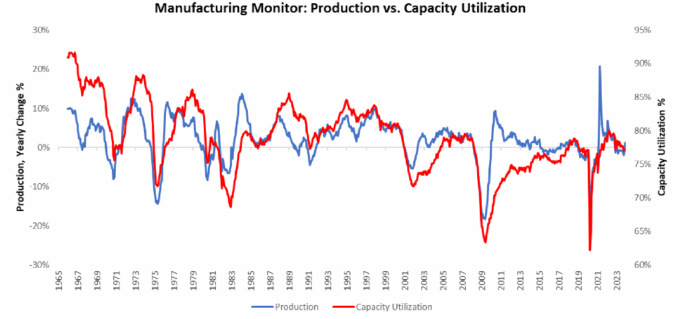
11. Strong moves in production without an increase in total productive capacity are typically unsustainable.
Scanning through these demand and production measures, we see flat conditions in both.
Scanning through these demand and production measures, we see flat conditions in both.
12. Orders and inventories are in sync, suggesting no major disequilibrium; meanwhile, production has declined, and capacity utilization has come off its highs. We see a similar flatling of conditions in our timely PMI measures:
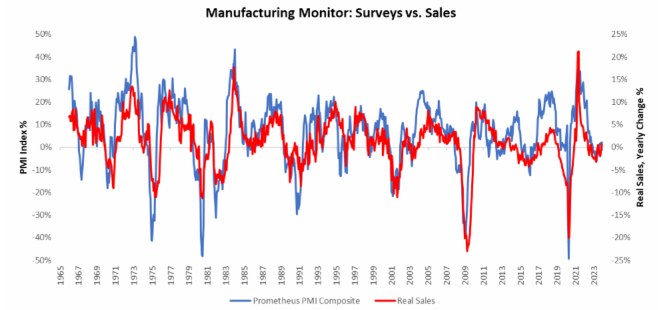
13. While hard data offers significant insights into the mechanical drivers of manufacturing, survey-based
measures (PMIs) can provide insight into where we are in the manufacturing cycle.
measures (PMIs) can provide insight into where we are in the manufacturing cycle.
14. This is because purchasing managers sit at the intersection of demand and supply, and their perception of conditions reflects conditions.
15. We now aggregate and net all of the cross-current from these various drivers of manufacturing into a
single metric to gauge manufacturing profit pressures. Below, we show how this measure has been a good guide for manufacturing's contribution to aggregate profits.
single metric to gauge manufacturing profit pressures. Below, we show how this measure has been a good guide for manufacturing's contribution to aggregate profits.
16. Finally, we visualize market pricing relative to these evolving fundamental trends. Below, we show our manufacturing profits gauge and our long/short basket of manufacturing sensitive vs. insensitive
sectors.
sectors.
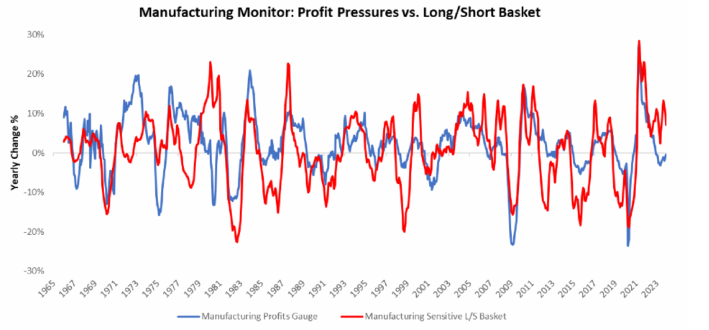
17. As we can see below, trends in this basket are capped by the degree to which profits move. Said
differently, manufacturing outperformance usually requires an accelerating profit cycle.
differently, manufacturing outperformance usually requires an accelerating profit cycle.
18. Overall, manufacturing demand and output have flatlined and could potentially improve. However,
without a significant decrease in wage cost, we think these improvements will unlikely offset the pressures on profitability.
without a significant decrease in wage cost, we think these improvements will unlikely offset the pressures on profitability.
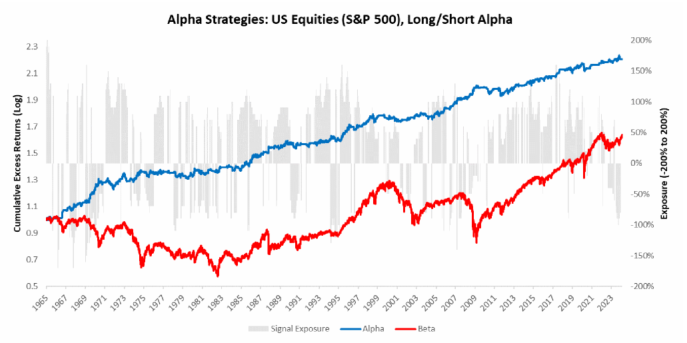
19. As such, we expect the industrial, energy, and materials stocks to underperform the broader index, reflected in our Alpha Strategies. Below, we show the full ensemble of our Alpha Strategies, which trade stocks, bonds, and fixed income vs. the S&P 500.
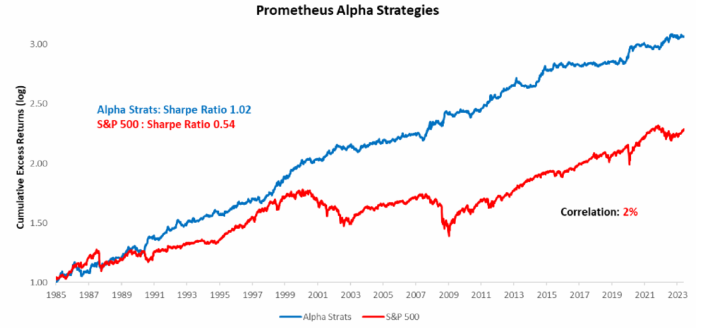
20. Our S&P 500 Alpha Strategy remains flat on its bets on the S&P 500, i.e., broad recession risk remains muted. For alpha generation, we continue to find the most reward/risk in relative value.
Please let us know if you enjoyed this thread. Additionally, make sure to #Subscribe to @prometheusmacro for ongoing insights and institutional-grade analysis. 🔥
• • •
Missing some Tweet in this thread? You can try to
force a refresh