
#Altcoins
Are we facing a Altseason that only happens every few years?
In this thread, I'll show you some charts that indicate that the time could soon come.
1/11🧵
Are we facing a Altseason that only happens every few years?
In this thread, I'll show you some charts that indicate that the time could soon come.
1/11🧵

#Altcoins
The Gaussian Channel for Altcoins has finally changed to green.
This is one of the most bullish signals you can get.
In 2016 and 2020, the green channel gave the ultimate go signal for Altcoins.
2/11
The Gaussian Channel for Altcoins has finally changed to green.
This is one of the most bullish signals you can get.
In 2016 and 2020, the green channel gave the ultimate go signal for Altcoins.
2/11

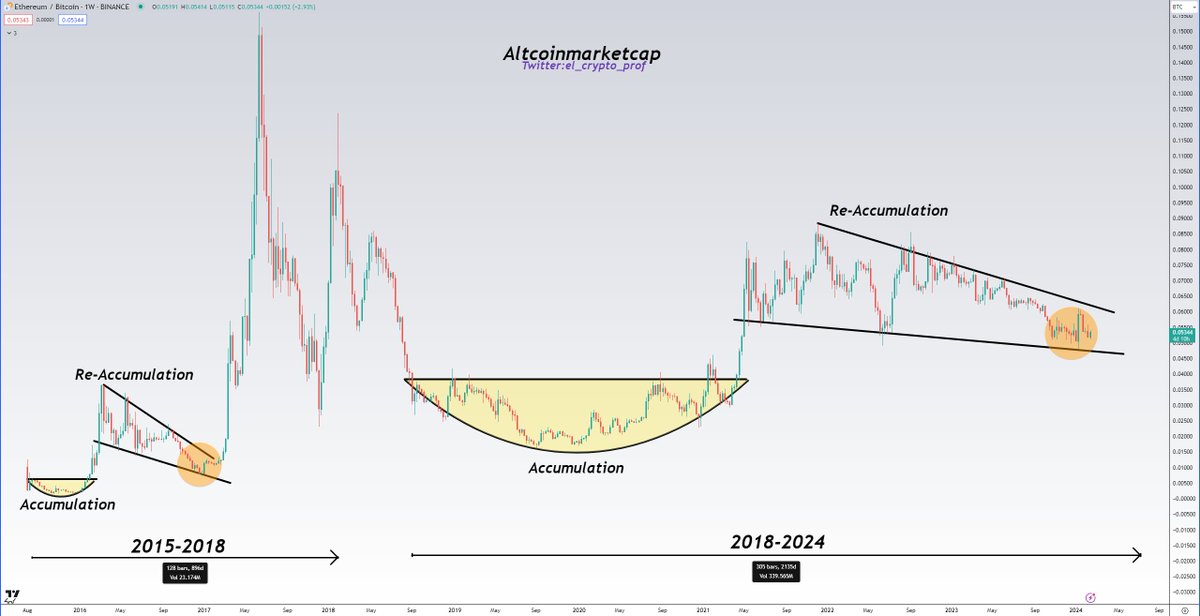
#Altcoins and The Wyckoff Method.✅
I've been sharing the charts for a few weeks now. So far, things are going really well according to plan.
The next upward wave could eclipse everything that has gone before.
Phase E is always the strongest wave.
3/11
I've been sharing the charts for a few weeks now. So far, things are going really well according to plan.
The next upward wave could eclipse everything that has gone before.
Phase E is always the strongest wave.
3/11

#Altcoins
If you look closely, the current Altcoin-Cycle is very similar to the previous one.
The only difference is that this time it will take much longer, as it will be much bigger.
4/11
If you look closely, the current Altcoin-Cycle is very similar to the previous one.
The only difference is that this time it will take much longer, as it will be much bigger.
4/11
#Altcoins
Altcoins are on the verge of a golden cross in the Gooner EMA.
In 2016 and 2020, this signalled the start of a parabolic uptrend.
I know it's not easy, but from this point onwards, doing nothing is the key to success.🗝
5/11
Altcoins are on the verge of a golden cross in the Gooner EMA.
In 2016 and 2020, this signalled the start of a parabolic uptrend.
I know it's not easy, but from this point onwards, doing nothing is the key to success.🗝
5/11
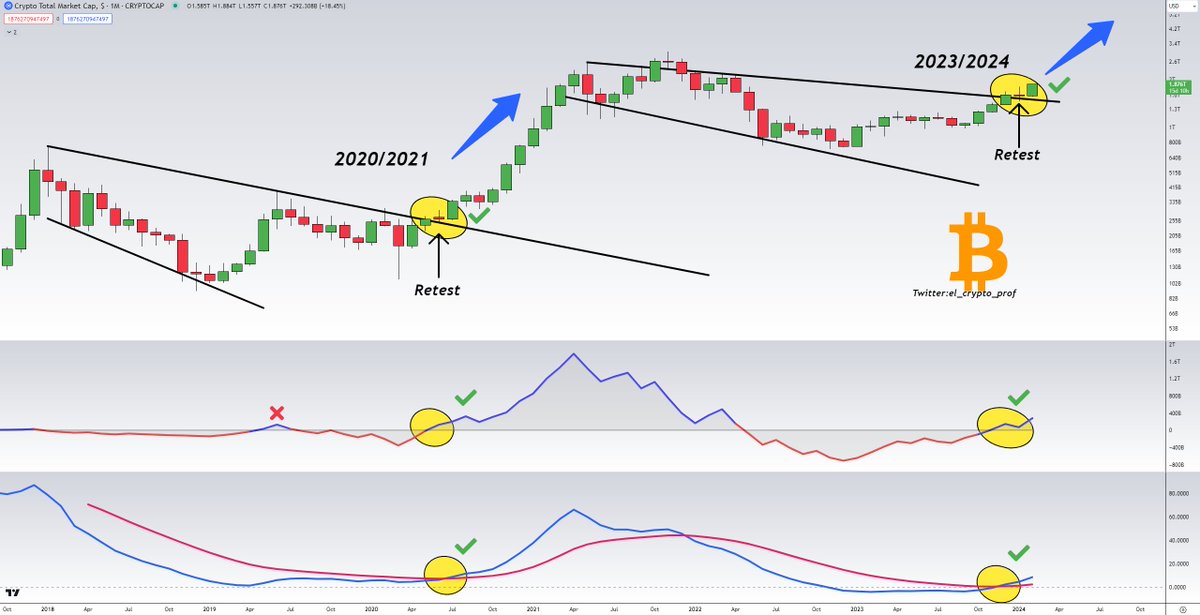
#Altcoins
Can't emphasise it often enough:
-OBV bullish✅
-bullish TSI Cross (monthly chart)✅
-perfect backtest like in 2020
In 2020, the Altcoin Bull started with these signals.
History doesn't repeat itself, but it often rhymes.
6/11
Can't emphasise it often enough:
-OBV bullish✅
-bullish TSI Cross (monthly chart)✅
-perfect backtest like in 2020
In 2020, the Altcoin Bull started with these signals.
History doesn't repeat itself, but it often rhymes.
6/11
#Altcoins
While some are still waiting for 12k #Bitcoin, Altcoins are preparing for a moster run imo.
-Zero line in MACD broken✅
- $BTC has already broken the 0.618 (FIB), Altcoins will follow imo
7/11
While some are still waiting for 12k #Bitcoin, Altcoins are preparing for a moster run imo.
-Zero line in MACD broken✅
- $BTC has already broken the 0.618 (FIB), Altcoins will follow imo
7/11

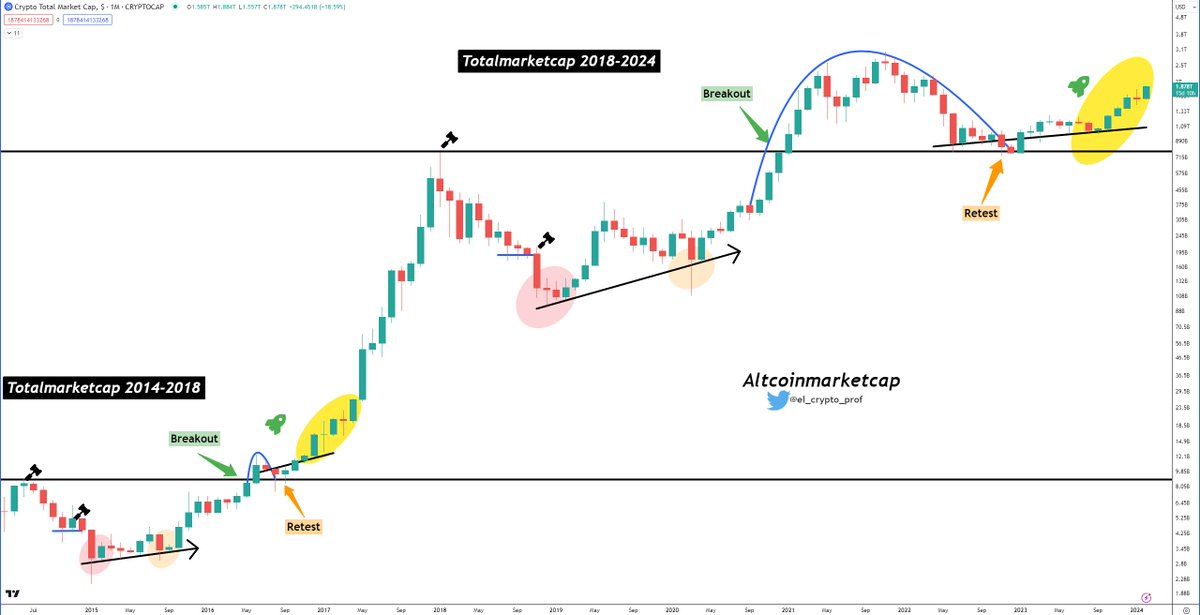
#Altcoins
The biggest Altseason since 2017 is upon us imo.
Anyone who has been following me for a while knows that I didn't just start saying that yesterday. I first published this chart in April/May 2022.
It's just taking longer than the last cycle.
8/11
The biggest Altseason since 2017 is upon us imo.
Anyone who has been following me for a while knows that I didn't just start saying that yesterday. I first published this chart in April/May 2022.
It's just taking longer than the last cycle.
8/11
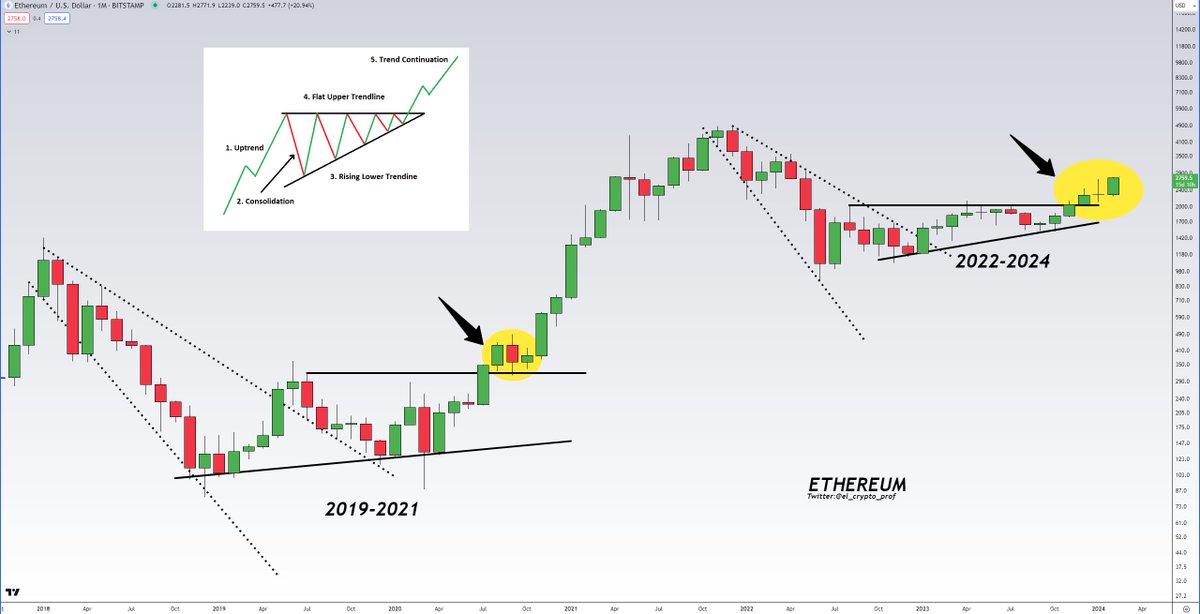
#Ethereum / #Altcoins
-Descending broadening wedge + Ascending Triangle
-Almost identical setup as in 2020.
Ethereum is the leader of all Altcoins. If $ETH goes up, alts will go up even more.
9/11
-Descending broadening wedge + Ascending Triangle
-Almost identical setup as in 2020.
Ethereum is the leader of all Altcoins. If $ETH goes up, alts will go up even more.
9/11
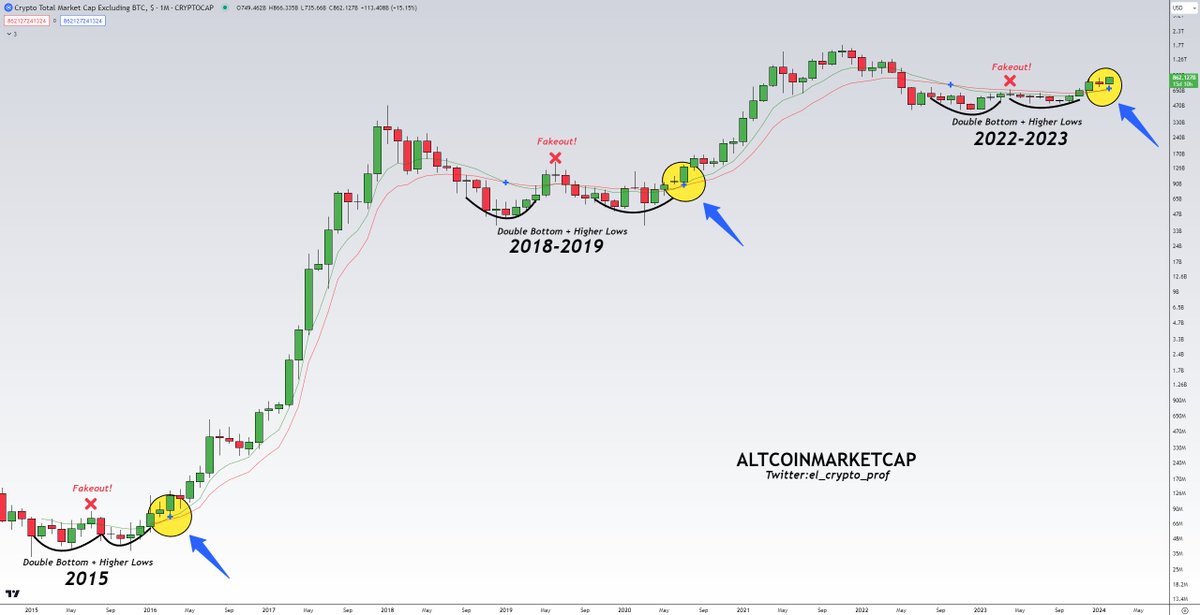
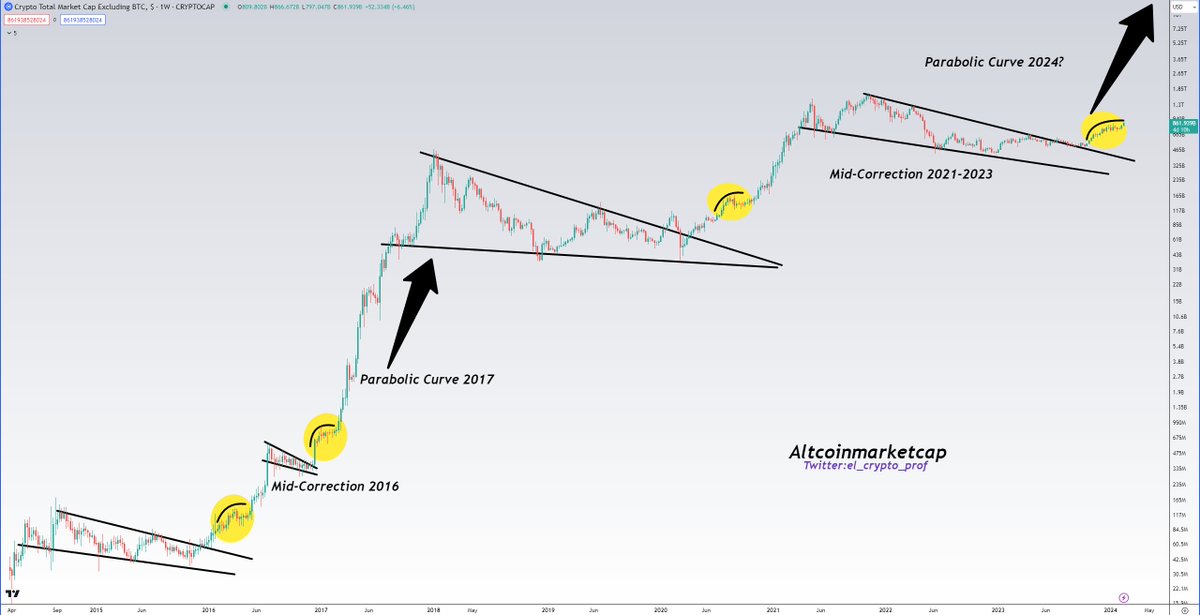
#Altcoins last cycle vs. #Altcoins this cycle.
Do I need to say more?
One of my favourite charts because it's always the same game.
10/11
Do I need to say more?
One of my favourite charts because it's always the same game.
10/11
I hope you are bullish enough now? 🫡
Generational wealth could lie ahead.
And there are many more charts that I'll share. A $BTC thread is also coming soon.
If you liked this thread, please don't forget to follow me @el_crypto_prof. A lot of work goes into this. Thanks❤️
Generational wealth could lie ahead.
And there are many more charts that I'll share. A $BTC thread is also coming soon.
If you liked this thread, please don't forget to follow me @el_crypto_prof. A lot of work goes into this. Thanks❤️
• • •
Missing some Tweet in this thread? You can try to
force a refresh


