🔥Renault Group almost tricked me. In this thread I briefly discuss why the shown 8.1% (H2 23) operating profit margin is 🐴💩 and Renault didn't report a "record breaking" margin. The reported H2 23 margin is actually a rather disappointing 1.5% based on reported H2 operating income of just €389M and €25,527M in revenue. Renault will not show you this number anywhere in their materials! For the FY2023, Renault only gets to 4.7%! This number too Renault won't show you anywhere.
My original post;
1/ Renault showed this slide with a relatively high 7.6% and 8.1% operating margin for H1 and H2 2023 respectively.
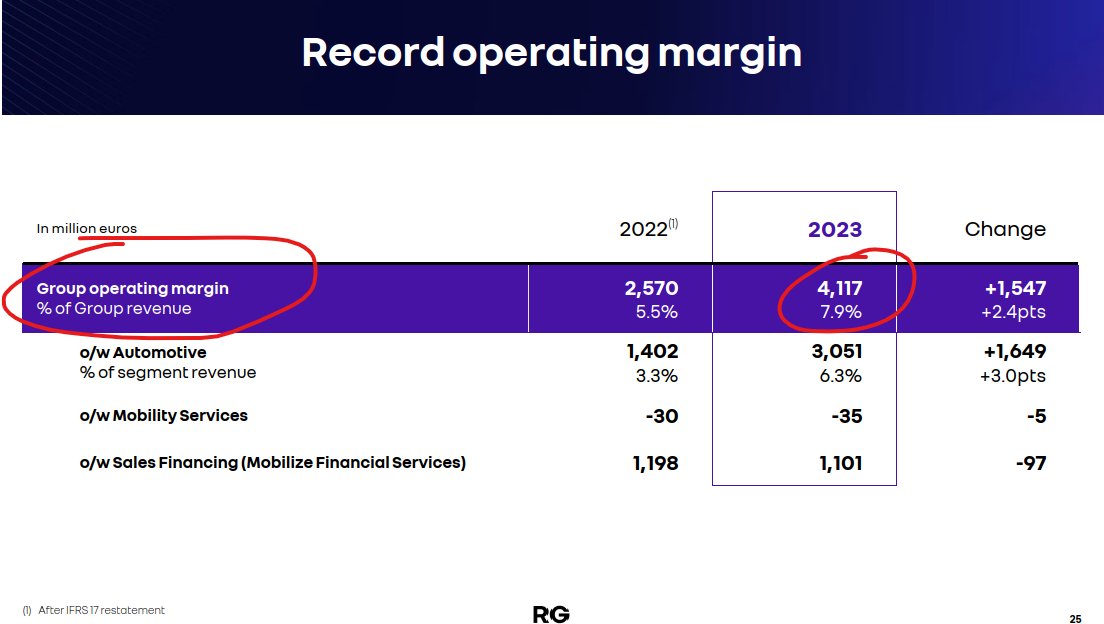
2/These number result in a full year 2023 margin of 7.9% and 'operating profit' of €4,117M (remember those numbers, they become important later)
3/The shown bridge shows a walk from 2022 'operating profit' to 2023. What Renault doesn't tell you is that both numbers are upward adjusted by combined €2,011M (FY22 €379M and FY23 €1,632M!).
4/This shows you just one of the bigger adjustments: 'Horse' with a FY23 impact of €482M. But the €482M explains only 30% of the €1,632M in to get from the shown 'Operating income of €4,117M' to...
5/...the actual reported operating income number of €2,485M. Renault had the audacity to call this item "EBIT" in the presentation. This is factually incorrect as we'll see later. They probably looked at this slide and thought it's too obvious if we call both operating income and people might get confused and may ask questions.
6/This is now a look into the earnings report. Here, the €2,485M is correctly labelled as 'Group operating income'. You will not find this anywhere in the presentation! In the presentation they even use the term "Group operating income", which I find misleading.
7/And then ultimately, voila, we see in the P&L the correct operating income of €2,485M. Some people may think: why the fuss, it's normal to show adjusted numbers. My answer:
First, at what point does it become idiotic when, like in Renault's case, the adjusted numbers over the last few years exceeded actual reported operating income numbers from the P&L by freaking 75%!
Second, good companies provide a full bridge from adjusted to reported (from presentation to P&L). Renault never does.
8/Bottomline: Renault's operating profit numbers are bogus. If anyone wants to compare companies, I'd highly recommend to use the numbers as reported on the income statement!
Lastly, you can see from the income statement number €2,485M and €52,376M that the reported operating margin was only 4.7%.
• • •
Missing some Tweet in this thread? You can try to
force a refresh
In this thread I want to give you an idea just how insane the current government spending is and how far we drifted away from any sustainable fiscal spending.
This is all based on reported numbers and there are no assumptions/forecasts.
In the current fiscal year, the government already spent $4,159 billion. This is for the first 7 months and the fiscal year ends in September.
The latest available data is as of April. The already accrued deficit amounts to over $1 trillion: $1,049 billion.
You can see in the chart how net interest expense has become the #2 largest spending category at $579 billion (for 7 months) after social security ($907 billion) and even exceeded national defense ($536 billion), health ($555 billion), and Medicare ($550 billion).
The deficit is 34% of total receipts! (1049/3110)
In other words: the government spent 34% more than it took in.
Last year, at the same point in the fiscal year (April 2024), the deficit was $855 billion ($194 billion lower) and interest expense was $65 billion lower. Again, this is only for the first 7 months of the fiscal year for an apples-to-apples with the current fiscal year.
The deficit was 29% of total receipts! (855/2964)
The year prior to last year at the same time (April 2023) the government deficit was $925 billion and represented 34% of receipts!
This is a must read for TSLA investors. I shared this thread with subscribers last month.
***
This analysis considers Tesla's existing business (auto, energy, credits, S&O components) but also FSD subscriptions, semi, robotics (Optimus etc), Tesla owner ride hailing , and Tesla ride hailing (Cybercab).
Further, the auto segment includes the LCV (lower cost vehicle) and Cybercab for purchase from 3Q 2026.
1) Scope
The attached is not the full slide pack. I am sharing this shortened version in the interest of time. Outputting all modelled businesses would have delayed this report by a few days.
2) Change in frequency
Since many of you asked, going forward I'll be sharing an updated outlook more frequently in which I'll be adding additional outputs (slides) from the model as they become available.
The primary argument for a more frequent update would be incorporation of latest market data. Market data (ie share price) affect the multiple and hence the implied PT range. Also, more frequent updates help to incoporate lates vehicle sales trends.
3) My PT has changed significantly
My prior PT was based on Elon's October 2024 guidance of "20-30% year-on-year" volume growth in 2025.
The new PT's volume estimate is based on sales trends extrapolation and competitive dynamics by market. I've been using the leading global automotive database to derive a volume estimate based on the world's 11 major sales regions by model based on market share. At time of my prior PT this was not available to me.
Old PT: I will cover all changes separately with a detailed review of key drivers. There are various other drivers, ie not only volume.
4) In this thread
Slide 1-9: summary slides of key financial outputs.
Slide 10-13: step by step derivation of price target.
Slide 14: price target.
Slide 15-16: revenue, gp, and gm overview by business line.
Slide 17-19: auto, energy, S&O key drivers.
Slide 20-21: R&D and SG&A.
This is a 37-page financial deep dive into Tesla's Q1 results. I shared this report with subscribers the day after Tesla released results (April 22).
If you invest in Tesla consider subscribing to my research to be kept up-to-date on the company's financials.
In this thread I explain briefly why Hyundai turned into a zombie company.
Hyundai was the most cash burning automaker globally in 2024 with a negative free cash flow of $11.8 billion. In the fourth quarter of 2024 alone, Hyundai burned $5.4 billion. To fill the capital hole, Hyundai raised net $15B in capital in 2024 (financing cash flow).
Negative free cash flow was driven by a lack of operating cash flow (OCF). Hyundai's 2024 OCF was negative $4.2 billion.
Hyundai's negative free cash flow was further increased by $7.6B in capital expenditures.
The key takeway is that VW is done in China. This business won't provide upside to the group.
VW is simply not competitive in the BEV and quickly growing EREV segment while ICE market is shrinking rapidly.
This makes VW increasingly vulnerable to weakness in other geographies.
How is this relevant to investors?
[🔐subs only]
[the following thread as shared with subscribers on March 11, 2025]
***
VW Group's China business went from a cash cow to a non-needle mover.
This chart shows trailing 12 months China income: you can see how the decrease has been accelerating. VW Group's China JV income dropped to just $0.4B over the last 4 quarters.
This chart shows the quarterly income from the China business. You can see how both 2Q and 4Q were loss-making. 4Q is by far the strongest sales month in China. 1Q 2025 will be likely loss-making as well.