Brad Setser Profile picture
Feb 27, 2024 8 tweets 3 min read Read on X
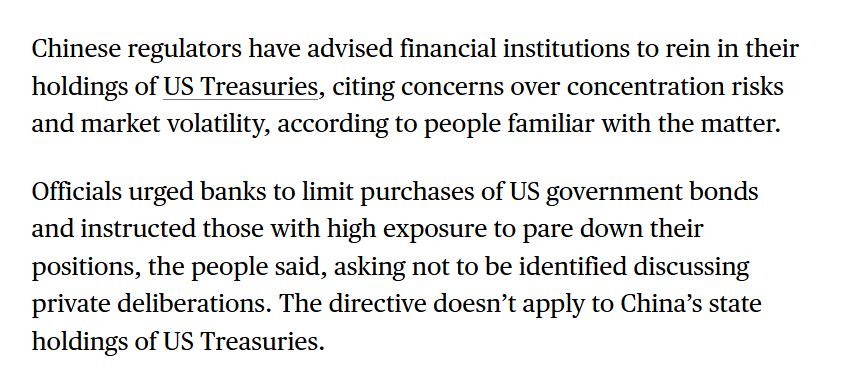
A chart that illustrates how it is fundamentally impossible for China to construct a block centered around the developing world that replaces the US/ EU ...

there is an obvious problem, namely the size of China's surplus

1/x
Image
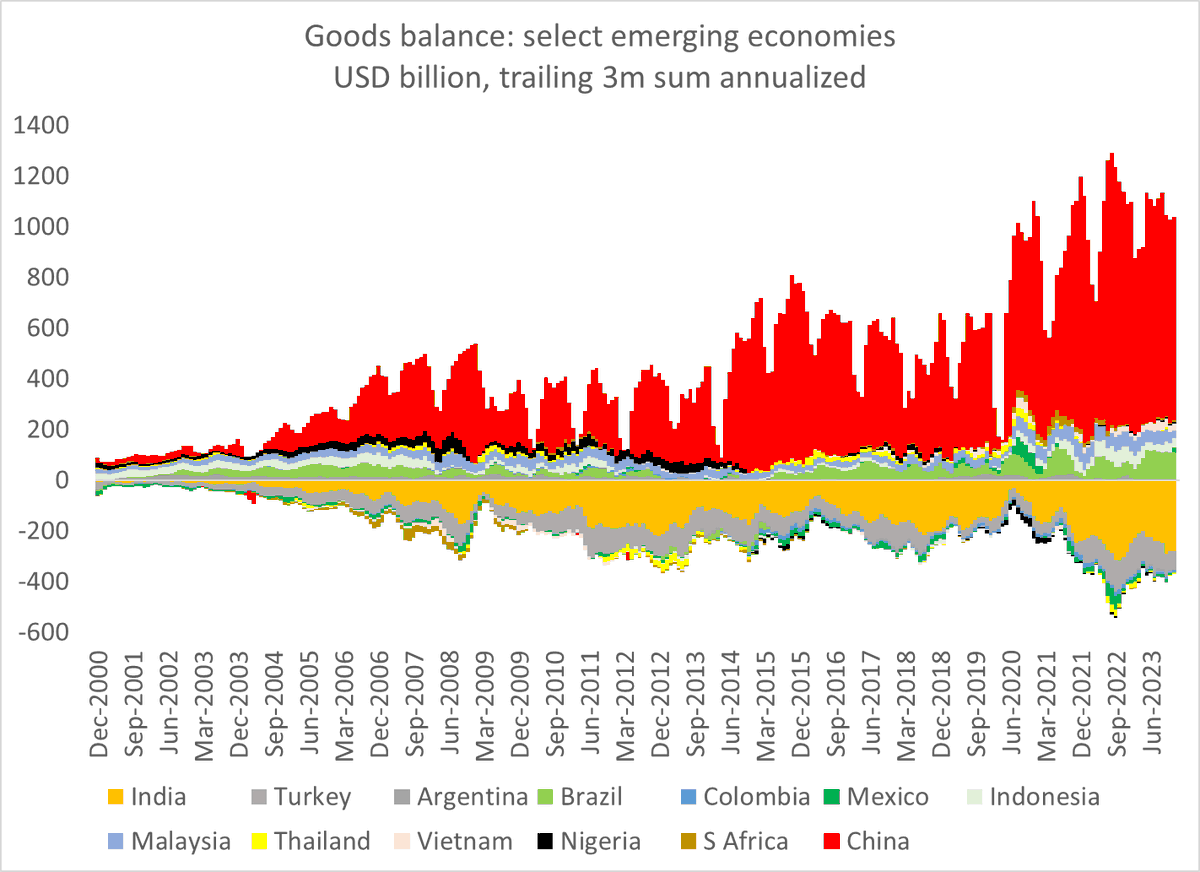
Here is the same chart without China -- it looks totally different. That's the point.

Note one other thing: the big deficits are in India and Turkey.

2/ Image
That is a real problem for a Sinocentric block that aims to replace the US and Europe as a source of end demand. India is absolutely not prepared to run bigger deficits with China -- and Turkey really needs to bring its deficit down.

3/
India, remember, didn't join China's trade deal (unlike say Japan ... ) and is exceptionally worried that Chinese exports are undermining its own manufacturing sector. Turkey competes with China in the EU market and isn't gonna give up the EU for China ...

4/
The bigger point of course is that the world cannot really decouple so long as there are enormous surpluses and deficits across different parts of the global economy (and different political blocks)

5/ Image
This point is I think obvious to @michaelxpettis, me/ & others who think about "global" demand and supply imbalances. But it is not at all intuitive to the world of trade and commercial diplomacy -- and to my surprise no longer obvious to the "it's all fiscal" IMF! Image
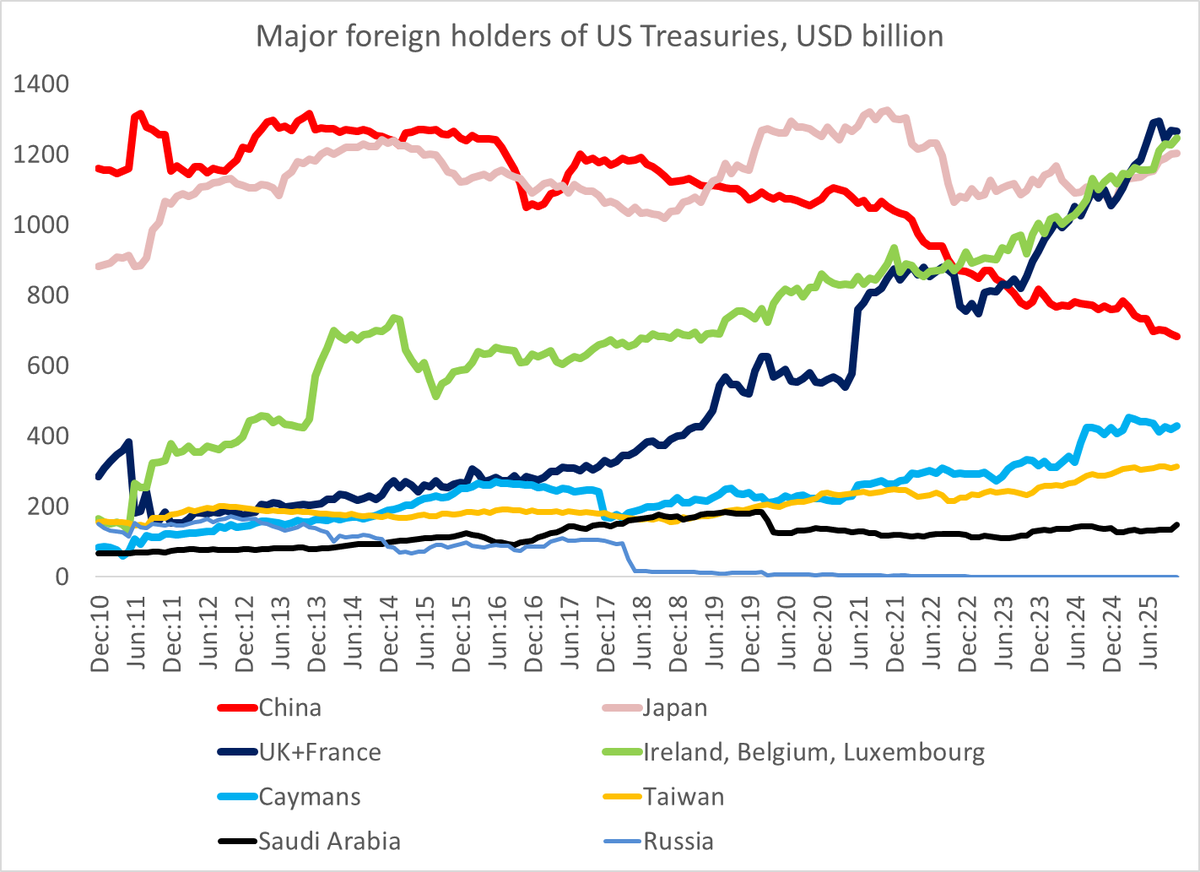
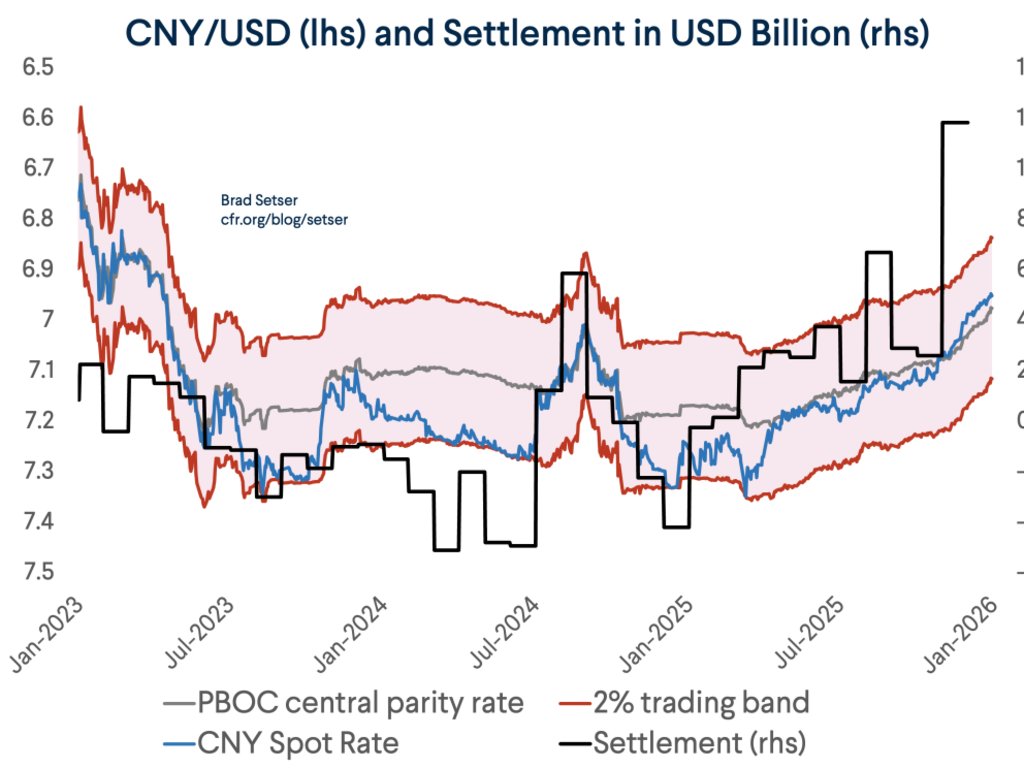
@michaelxpettis ps i think the goods data tells the story more cleanly/ with fewer distortions than the broader data showing the current account (note I don't trust the Chinese current account number & current account data is more distorted by tax). But the CA numbers say the same thing Image
@littlebigfis and BoP based thinking is a lost art -- sadly, even at the IMF, where the norm is now "it is all fiscal" ...

• • •

Missing some Tweet in this thread? You can try to force a refresh
 

Keep Current with Brad Setser

Brad Setser Profile picture

Stay in touch and get notified when new unrolls are available from this author!

Read all threads

This Thread may be Removed Anytime!

PDF

Twitter may remove this content at anytime! Save it as PDF for later use!

Try unrolling a thread yourself!

how to unroll video
  1. Follow @ThreadReaderApp to mention us!

  2. From a Twitter thread mention us with a keyword "unroll"
@threadreaderapp unroll

Practice here first or read more on our help page!

More from @Brad_Setser

Oct 2
Have the tariffs reduced the trade deficit? The answer is actually not obvious ...

The headline data misleads because of massive swings in the pharmaceuticals balance and the gold balance

1/ many Image
If you look at goods trade net of pharma and gold, imports are down a bit from earlier in the year (consistent with a tariff impact) but the base earlier in the year was inflated by a bit of front running

2/ Image
Recent monthly deficits (last data point is July, August will likely be down but this calculation takes the detailed data) are running a bit below last year in recent months -- but the YTD numbers are still driven by q1 (front running)

3/ Image
Read 7 tweets
Oct 1
One of the arguments I made at last week's Federal Reserve (Board +FRBNY) Conference on the international role of the dollar is that the dollar's share of reserves gets too much attention, and the absolute stock of reserve holdings gets too little ...

1/many Image
Central banks did add a bit to their Euro holdings in dollar terms (or rather, they didn't sell euros just because the euro rose against the dollar in q2). But the bigger story is that dollar holdings are basically constant ...

2/ Image
There has been essentially no flow from foreign central banks/ reserve managers into dollars in the last year plus -- and global reserve growth has also stalled ...

3/ Image
Read 12 tweets
Oct 1
Thanks Glenn. Always appreciate your input.

A simple explanation of the changes that China made back in 2021 might help others understand the issue, and why many people (even some at the IMF) question the size of China's reported current account surplus. 1/
The adjustments made to the data lowered the "BoP" goods surplus relative to the customs balance --

it though is easy to replicate the old methodology and report what the surplus would be absent the new "survey" rather than customs based methodology

2/ Image
This methodological shift is lowering the reported surplus by about $250b (over a pp of GDP) relative to what it would be with an unchanged BoP methodology. And the reasons why the new approach has generated a lower number haven't really been explained 3/
Read 10 tweets
Oct 1
Saudi Arabia's balance of payments break even oil price is now in the 90s. With oil in the 60s, a large current account deficit should now be baked into the calculations of the desert kingdom

1/ Image
The reasons for the deficit are well known: new cities in the desert don't come chief, and the PIF is spending a lot on other projects as well ...

2/ Image
Don't tell President Trump as he seems to expect hundreds of billions if not trillions of gold plated investment will be coming in from the Gulf --

Saudi outward investment has slowed as borrowing covers the current account

3/ Image
Read 5 tweets
Oct 1
A good (upper level) essay question for a course on international economics (if folks still teach the balance of payments these days)

China's reported errors and omissions have collapsed. Does this make China's balance of payments data more or less accurate?

1/ Image
A junior (BoP) analyst question -- how does the renewed rise in foreign asset accumulation by the state banks relate to the reported current account surplus?

a: it increased, as more reported outflows implies a higher surplus if reported errors needs to be zero

2/ Image
Another junior BoP analyst question: why is the fall in reported errors (hot money outflows) correlated with the fall in reported FDI inflows -- with both collapsing in 2022?

3/ Image
Read 6 tweets
Sep 30
One of the (many) annoying things about China's new (after 2021) balance of payments data is that the adjustment relative to the underlying customs and services data isn't constant. The q2 reported surplus even tho the underlying customs data showed a bigger surplus

1/many Image
That gap had shrunk in q3 and q4 of last year, and in q1 -- but it widened again in q2 (see the chart below)

2/ Image
Or, put differently, the gap between the surplus implied by the underlying data (which has long tracked the customs surplus plus the tourism deficit) is about as big as the underlying surplus -- annualized both are around $500b

3/ Image
Read 15 tweets

Did Thread Reader help you today?

Support us! We are indie developers!


This site is made by just two indie developers on a laptop doing marketing, support and development! Read more about the story.

Become a Premium Member ($3/month or $30/year) and get exclusive features!

Become Premium

Don't want to be a Premium member but still want to support us?

Make a small donation by buying us coffee ($5) or help with server cost ($10)

Donate via Paypal

Or Donate anonymously using crypto!

Ethereum

0xfe58350B80634f60Fa6Dc149a72b4DFbc17D341E copy

Bitcoin

3ATGMxNzCUFzxpMCHL5sWSt4DVtS8UqXpi copy

Thank you for your support!

Follow Us!

:(