This is the SEED school, a 100% Black public boarding school in DC.
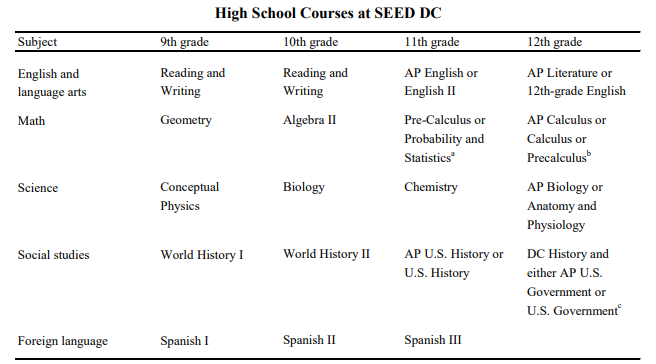
These disadvantaged students here enjoy a rigorous study schedule and a spending per student of 63000$ per year, comparable to some of the best schools in the country.
So, how and what do they do? Thread🧵
These disadvantaged students here enjoy a rigorous study schedule and a spending per student of 63000$ per year, comparable to some of the best schools in the country.
So, how and what do they do? Thread🧵

First SEED takes its unique place as being the first school of its kind, SEED was chartered almost 30 years ago and has been serving mostly Black kids in Washington DC.
They enroll mostly disadvantaged students, only 23 percent of applicants live in a two-parent household and 62 percent live with their mother. 75 percent of students qualify for free lunch.
Students here report more motivation and interest in their studies than their peers at other local schools; compared to their peers, SEED students report:
-Doing 4 more hours of homework a week
-Receiving more tutoring from adults
-Participating in student leadership activities
-More academic motivation
-Doing 4 more hours of homework a week
-Receiving more tutoring from adults
-Participating in student leadership activities
-More academic motivation
Because there are a limited number of seats the school holds a lottery. It is random so we can fairly compare the students who won and were given the opportunity for the school and those who did not.
This gives us insight into the school's effect on all manner of outcomes.
This gives us insight into the school's effect on all manner of outcomes.
As you can see there are few significant differences between the groups.
Given that, the school sadly has performance comparable to that of the surrounding public schools.
Given that, the school sadly has performance comparable to that of the surrounding public schools.
The PARCC is an assessment given to DC students, it is scored on a scale from 1-5 where a 4 is meeting expectations.
Overall, for the SEED high school, the percentage of students who achieved a 4 or higher for the years available was:
ELA: 2.4%-12%
Math: 4%- 7%
Overall, for the SEED high school, the percentage of students who achieved a 4 or higher for the years available was:
ELA: 2.4%-12%
Math: 4%- 7%
For the NWEA MAP assessment, the average student performance ranges around the 30th percentile, sometimes higher.
This is not good for a school.
This is not good for a school.
For the AP tests that the students take I was only able to find evidence that one student from one year has received a passing score.
That student received a 3 (out of 5) and was the only one to do so out of the 26 test takers that year. (3.8%)
That student received a 3 (out of 5) and was the only one to do so out of the 26 test takers that year. (3.8%)
Also in terms of lottery comparison, the school saw little change in risky behavior. In fact, the only significant difference was where the SEED group performed worse: general risky behavior.
In fact, there was no significant difference in pregnancy/ fathering a child at 26.7%
In fact, there was no significant difference in pregnancy/ fathering a child at 26.7%
Overall SEED lottery winners are no more likely to attend college or graduate high school.
There isn't much in the way of measured positive long-term effects.
There isn't much in the way of measured positive long-term effects.
And in general, the presence of charter schools has a small effect on other schools in the area.
https://x.com/cremieuxrecueil/status/1762185955216171262?s=20
Also, check out my charts of MAP testing for more on student performance in general:
https://x.com/notcomplex_/status/1756755531828498922?s=20
• • •
Missing some Tweet in this thread? You can try to
force a refresh


