CryptoSoulz Profile picture
Mar 2, 2024 7 tweets 4 min read Read on X
In this THREAD I will explain KILLZONES.

1. What are “KILLZONES”?
2. ICT Killzones
3. High probability setups with Killzones
4. How to trade Killzones
5. Protective SL

🧵(1/7) Image
1. What are “KILLZONES”?

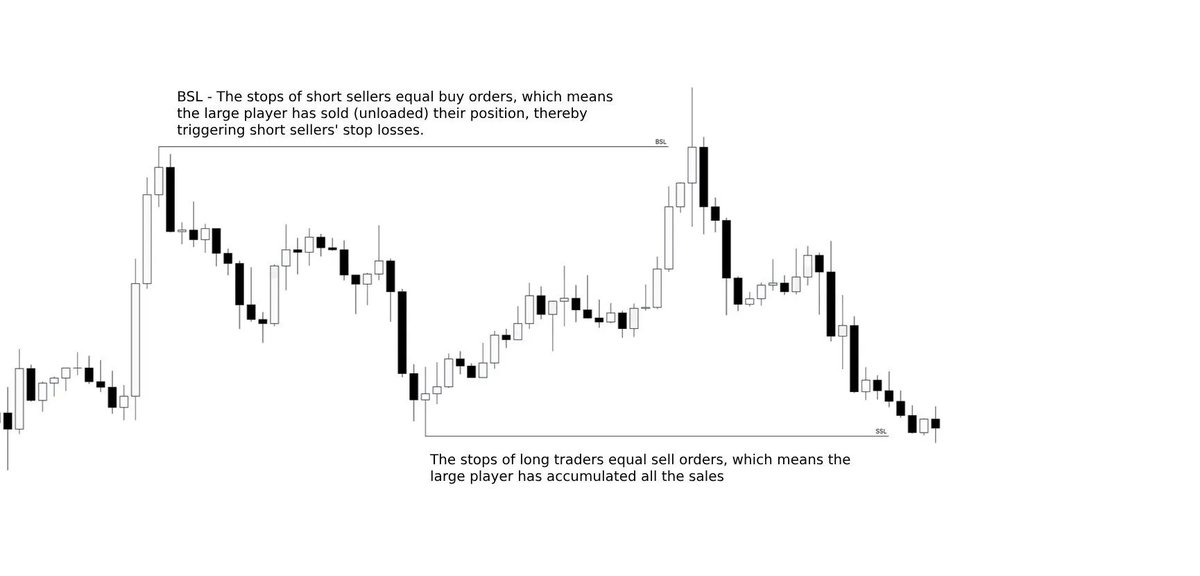
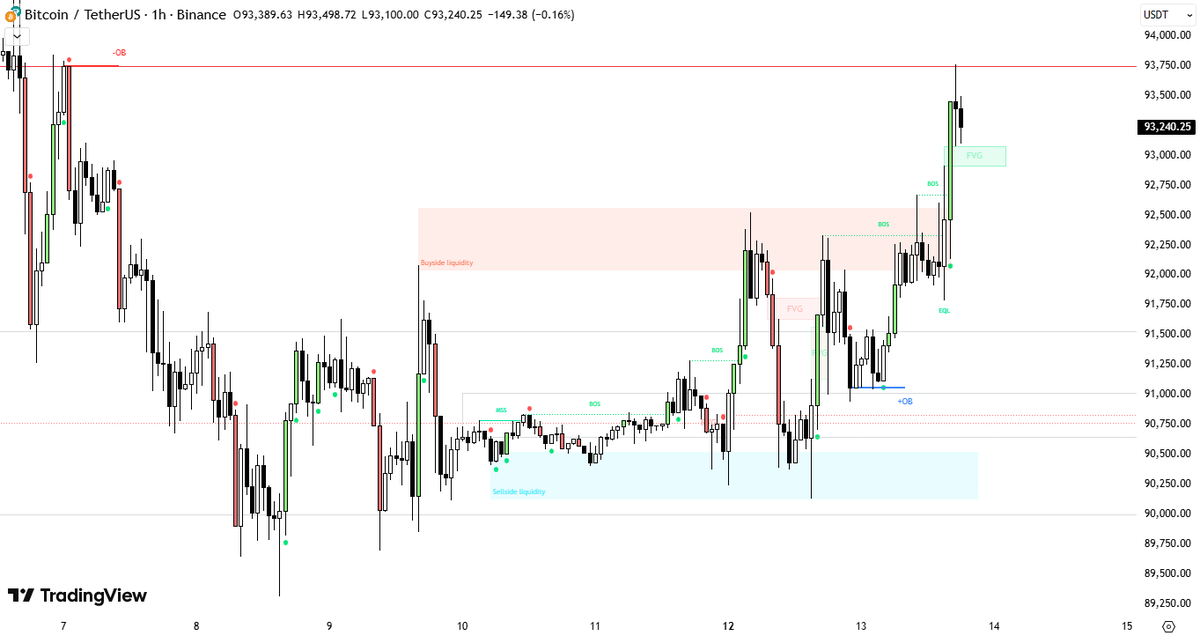
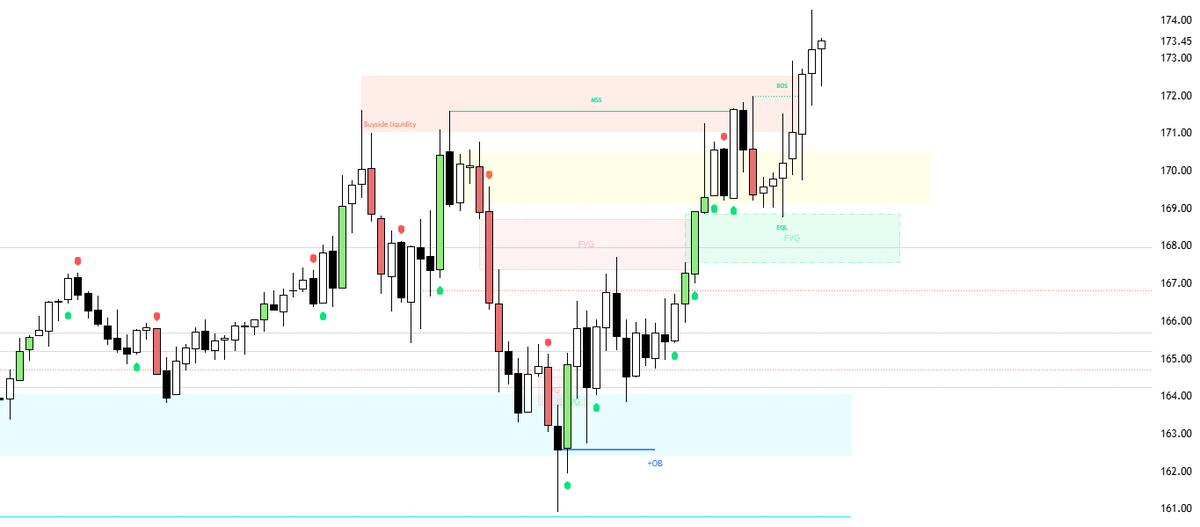
The Killzones are periods of intense market activity where the price action is at its most volatile.

This volatility can lead to significant price movements, which provide traders the opportunity to make profits.
Image
Image
2. ICT Killzones (Indices and FX)

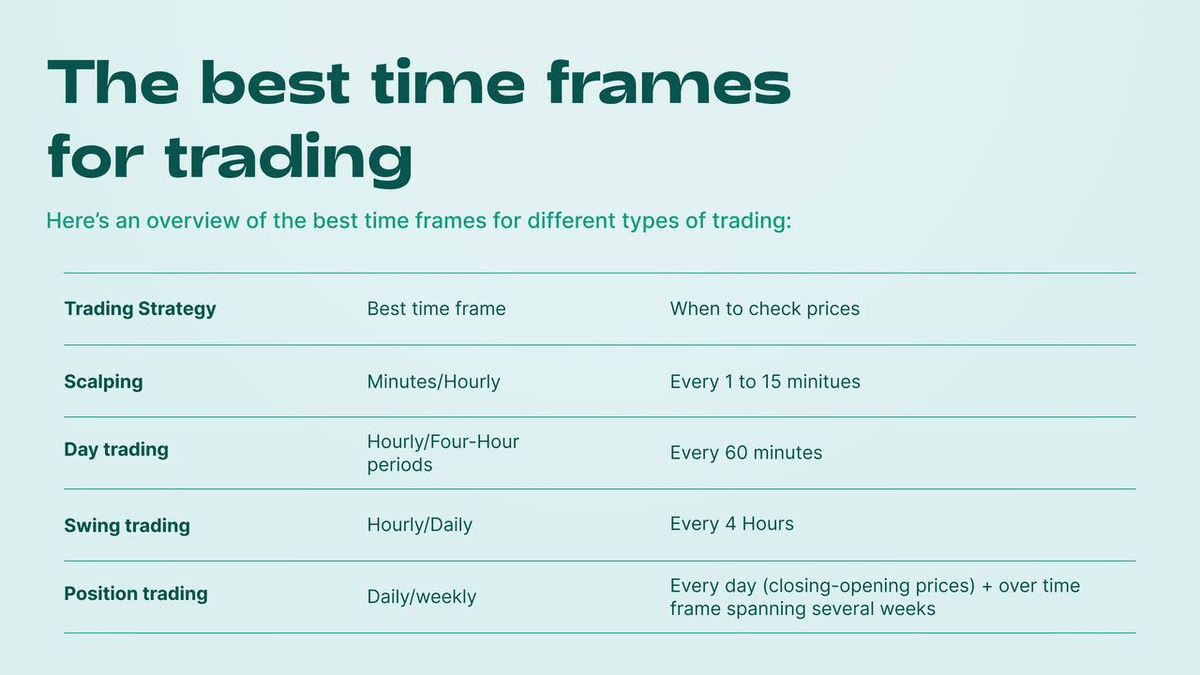
The FX market operates 24H a day but is divided into several major sessions.

Each with its own characteristics and levels of activity.

These sessions are the Asian, London, and NY sessions.
Image
Image
3. High probability setups with Killzones:

- Mark and label the Killzones and trade ONLY within that time window.

- Identify the trend of the current market

- Wait for the price to align with time. And liquidity/volume to kick in

- Enter trades only within that time window
Image
Image
4. How to trade Killzones:

1. Identify the trend:

Determine the trend of the price. Bullish or bearish?

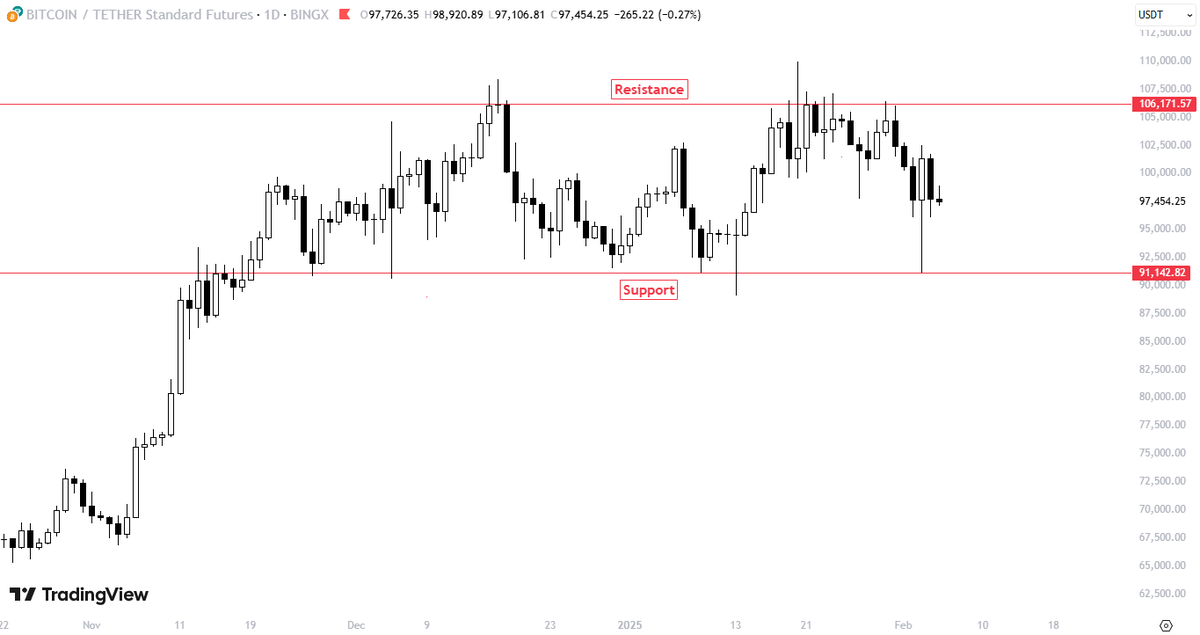
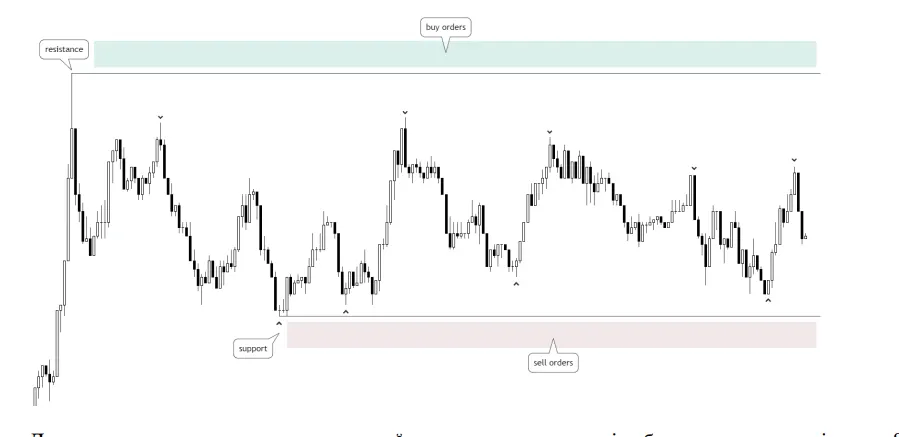
2. Identify the Asian Range:

Study the price movement during the Asian session

Notice if the price has formed a range, characterized by clear highs and lows.
Image
Image
4.1 How to trade Killzones:

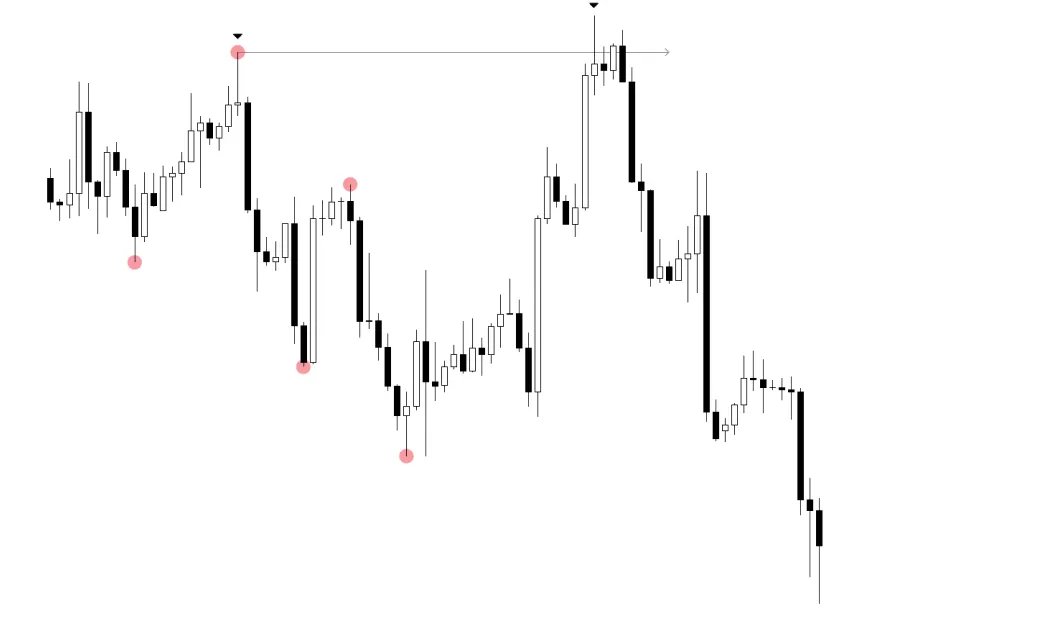
3. Look for false breakouts Against the Trend:

In the London or NY sessions, watch for price movements that breaks out of the Asian session’s range.

4. Take the trade:

After spotting a false breakout, take your trade during London or NY sessions. Image
5. Protective SL:

It’s key to set a protective stop loss in kill zones, especially during stop hunting.

This technicals tools will help you determine the best placement for your stop loss:

- Order Block
- Supply and Demand Zone
- FVG
- Key Levels
- Swing Levels Image

• • •

Missing some Tweet in this thread? You can try to force a refresh
 

Keep Current with CryptoSoulz

CryptoSoulz Profile picture

Stay in touch and get notified when new unrolls are available from this author!

Read all threads

This Thread may be Removed Anytime!

PDF

Twitter may remove this content at anytime! Save it as PDF for later use!

Try unrolling a thread yourself!

how to unroll video
  1. Follow @ThreadReaderApp to mention us!

  2. From a Twitter thread mention us with a keyword "unroll"
@threadreaderapp unroll

Practice here first or read more on our help page!

More from @SoulzBTC

Aug 2
In this THREAD I will explain “Pullbacks”

1. What is a Pullback?
2. What is a Retracement?
3. What is a Reversal?

🧵(1/14) Image
1. What is a Pullback?

A pullback refers to a temporary price decrease or pause within a larger upward trend.

It's a short-term retracement that doesn't signify a change in the overall direction of the trend. Image
1.2 What is a Pullback?

Pivots can be defined as significant Highs or Lows that act as potential reversal or support/resistance points.

Pivot point analysis helps traders identify pullbacks. Image
Read 14 tweets
Jul 30
In this THREAD I will explain “Fibonacci”

1. Fibonacci Retracement
2. How to draw Fibonacci Levels?
3. Fibonacci Ratios

🧵(1/12) Image
1. Fibonacci Retracement

Fibonacci levels are used to identify potential Support and Resistance levels on price charts.

These levels are expressed as percentages (23.6%, 38.2%, 61.8%, and 78.6%)

Traders use these levels to identify potential entry and exit points Image
1.1 Fibonacci Retracement

In a Fibonacci retracement uptrend, levels like 23.6%, 38.2%, 50%, 61.8%, and 78.6% act as potential support areas.

These levels are used to identify potential areas where the price might pause or reverse during a pullback within the uptrend. Image
Read 12 tweets
Jul 28
In this THREAD I will explain “Liquidity”

1. What is Liquidity?
2. IRL and ERL
3. FVG
4. Premium and Discount Zones

🧵(1/12) Image
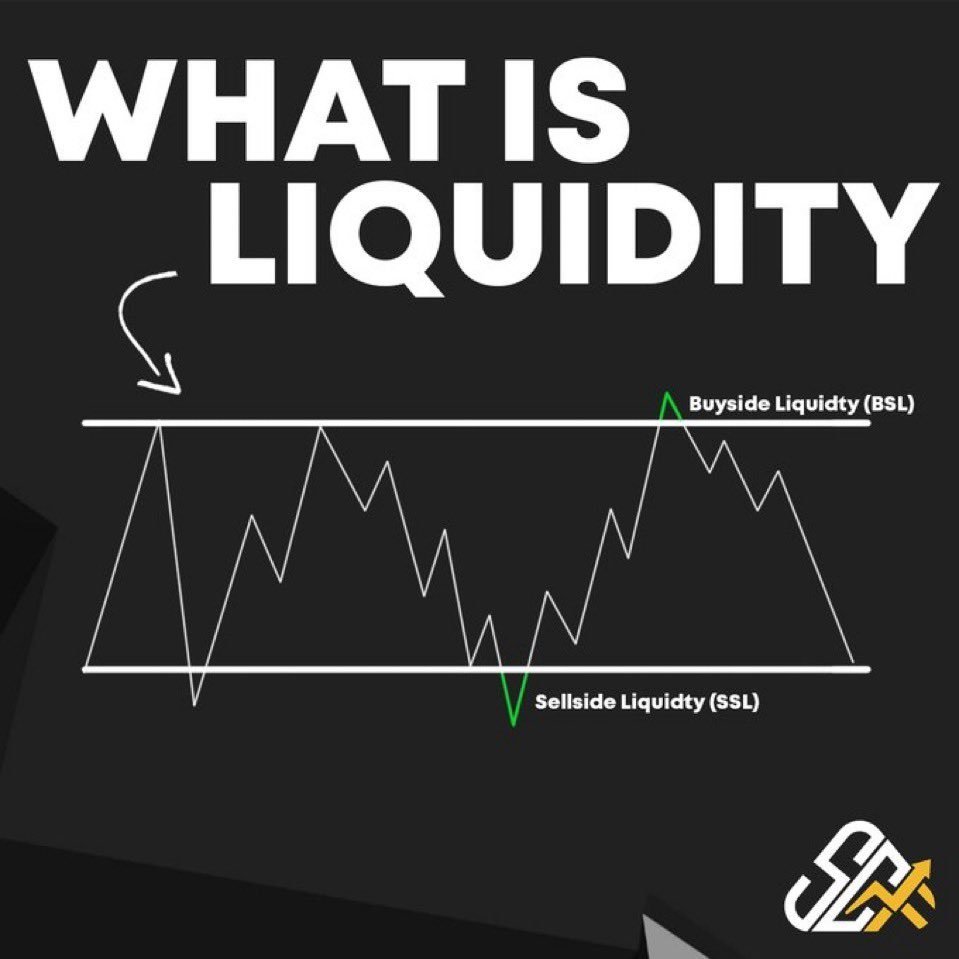
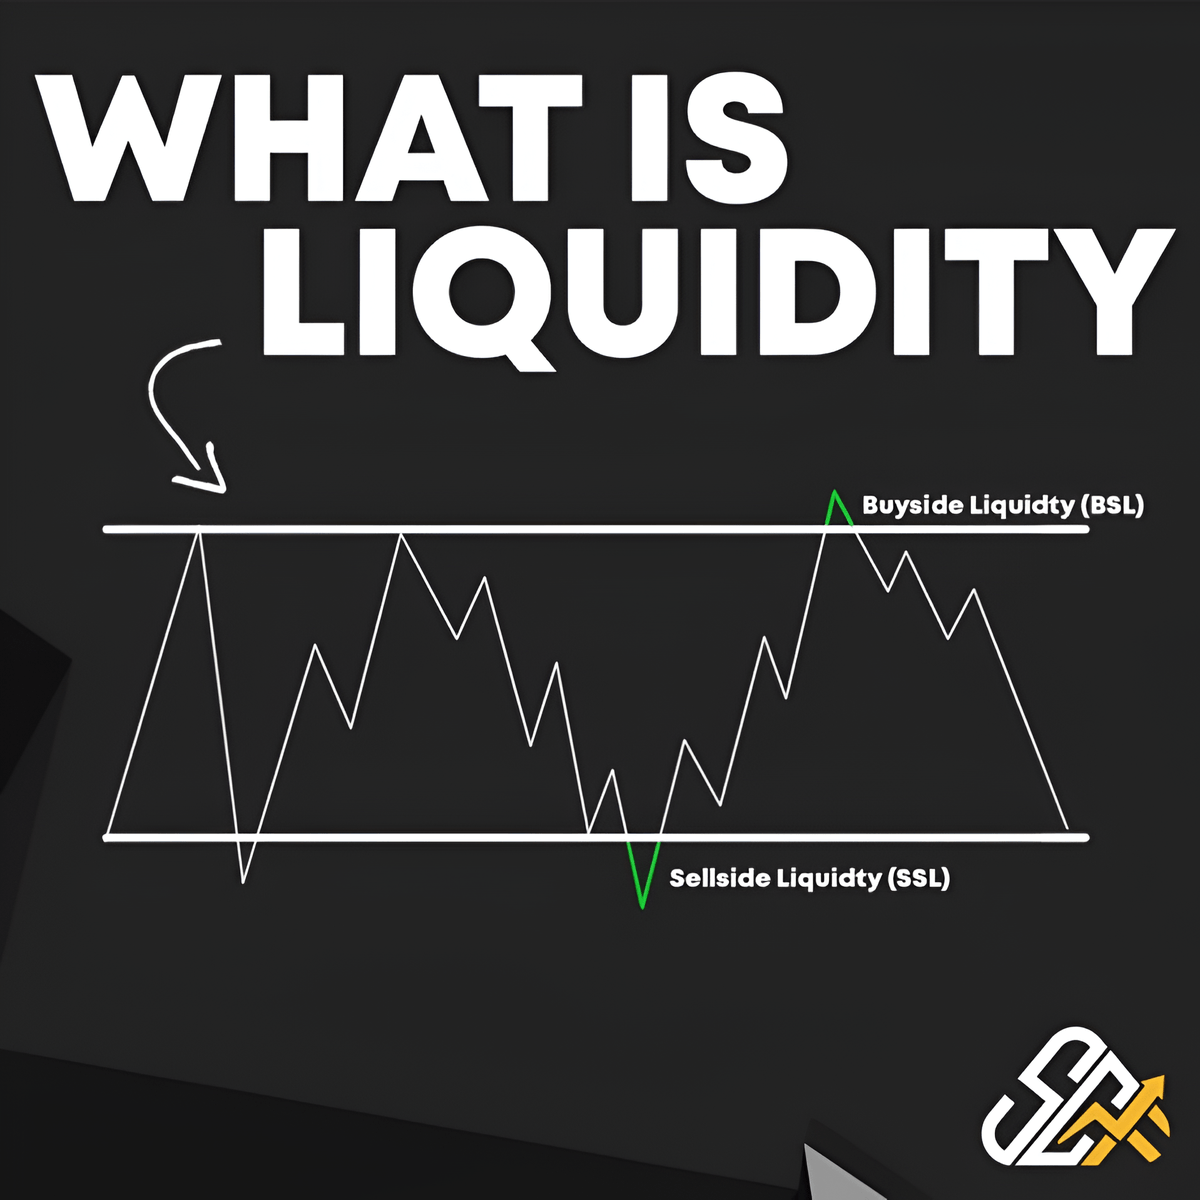
1. What is Liquidity?

Liquidity refers to how easily an asset can be bought or sold on the market without significantly impacting its price.

We have 2 types of Liquidity.

Buy Side Liquidity and Sell Side Liquidity. Image
1.1 What is Liquidity?

Buy Side Liquidity refers to the availability of buy orders in the market that can be filled by sell orders.

It’s a key area where smart money targets retail traders stop loss

These zones often occur above resistance levels or swing highs Image
Read 12 tweets
Jul 15
In this THREAD I will explain “Basic Trading Indicators”

1. MACD
2. RSI and Stochastic
3. OBV
4. ATR

🧵(1/17) Image
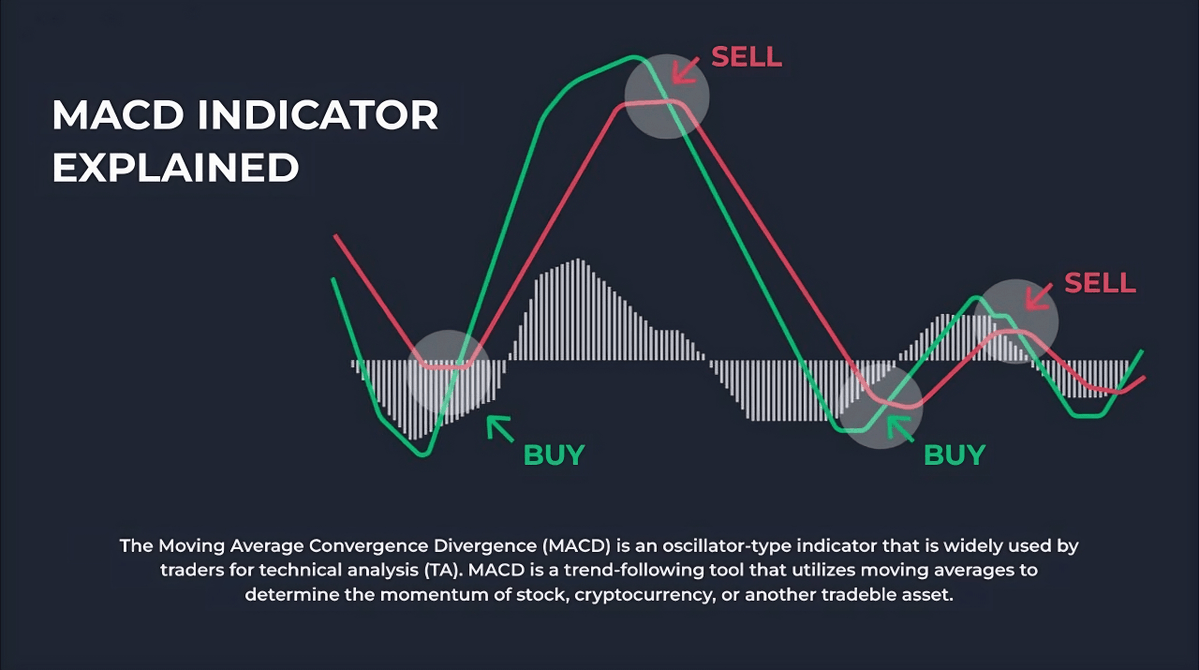
1. MACD

It’s a trend following technical indicator that shows a difference between two lines, the MACD line and the Signal line.

The MACD line is calculated by subtracting a 26-day exponential moving average from a 12-day exponential moving average. Image
1.1 MACD

How to trade using MACD Indicator?

When MACD crosses the Signal line, it is perceived as the start of a new trend.

Falling below the Signal line indicates the signal to sell and rising above it suggests that it is time to buy. Image
Read 17 tweets
Jul 10
In this THREAD I will explain “Price Action”

1. Volume
2. Trends
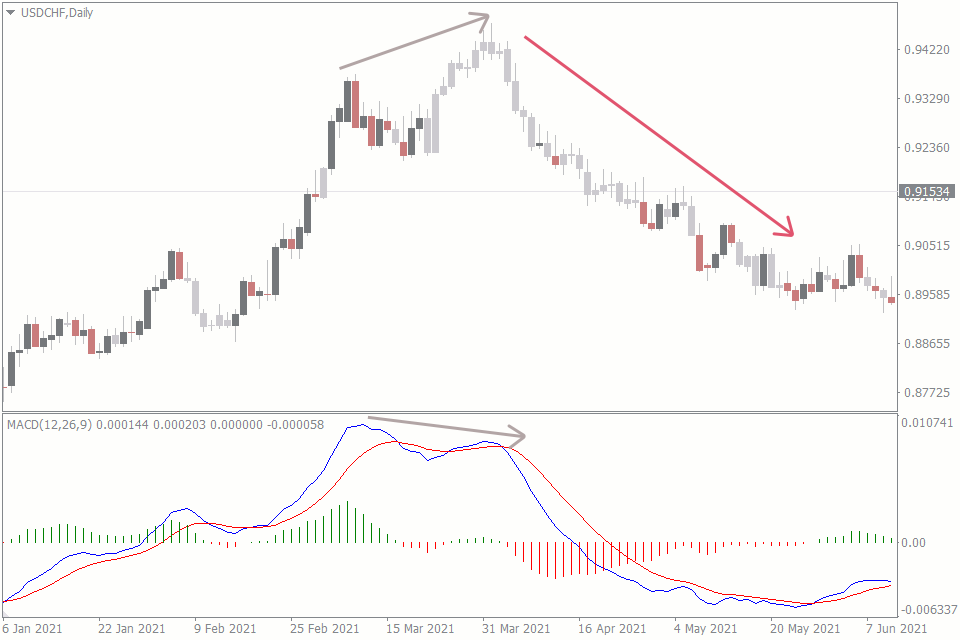
3. Divergence

🧵(1/17) Image
1. Volume

Volume refers to the total amount of a cryptocurrency that has been traded within a specific period.

It's a crucial metric for understanding market activity, liquidity, and potential price movements.

High volume suggests strong buying and selling interest. Image
1.1 Volume

When comparing price and volume patterns, you’ll want to determine whether they align. If so, the probabilities favor an extension of the trend

If price and volume disagree, the underlying trend is not as strong this is called a volume divergence Image
Read 17 tweets
Jul 8
In this THREAD I will explain “Fibonacci”

1. Fibonacci Retracement
2. How to draw Fibonacci Levels?
3. Premium and Discount Zones

🧵(1/14) Image
1. Fibonacci Retracement

Fibonacci Retracement levels are used to forecast when price corrections will end and start an uptrend.

Also to forecast when sellers will enter the market and start a downtrend. Image
Image
1.1 Fibonacci Retracement

In an uptrend, Fibonacci Retracement Levels can be used to identify potential areas of Support.

To apply Fibonacci in an uptrend, draw the tool from the Swing Low to the Swing High.

Watch for price to pull back to 38.2%, 50%, or 61.8% levels. Image
Read 14 tweets

Did Thread Reader help you today?

Support us! We are indie developers!


This site is made by just two indie developers on a laptop doing marketing, support and development! Read more about the story.

Become a Premium Member ($3/month or $30/year) and get exclusive features!

Become Premium

Don't want to be a Premium member but still want to support us?

Make a small donation by buying us coffee ($5) or help with server cost ($10)

Donate via Paypal

Or Donate anonymously using crypto!

Ethereum

0xfe58350B80634f60Fa6Dc149a72b4DFbc17D341E copy

Bitcoin

3ATGMxNzCUFzxpMCHL5sWSt4DVtS8UqXpi copy

Thank you for your support!

Follow Us!

:(