CryptoSoulz Profile picture
Mar 2 7 tweets 4 min read Read on X
In this THREAD I will explain KILLZONES.

1. What are “KILLZONES”?
2. ICT Killzones
3. High probability setups with Killzones
4. How to trade Killzones
5. Protective SL

🧵(1/7) Image
1. What are “KILLZONES”?

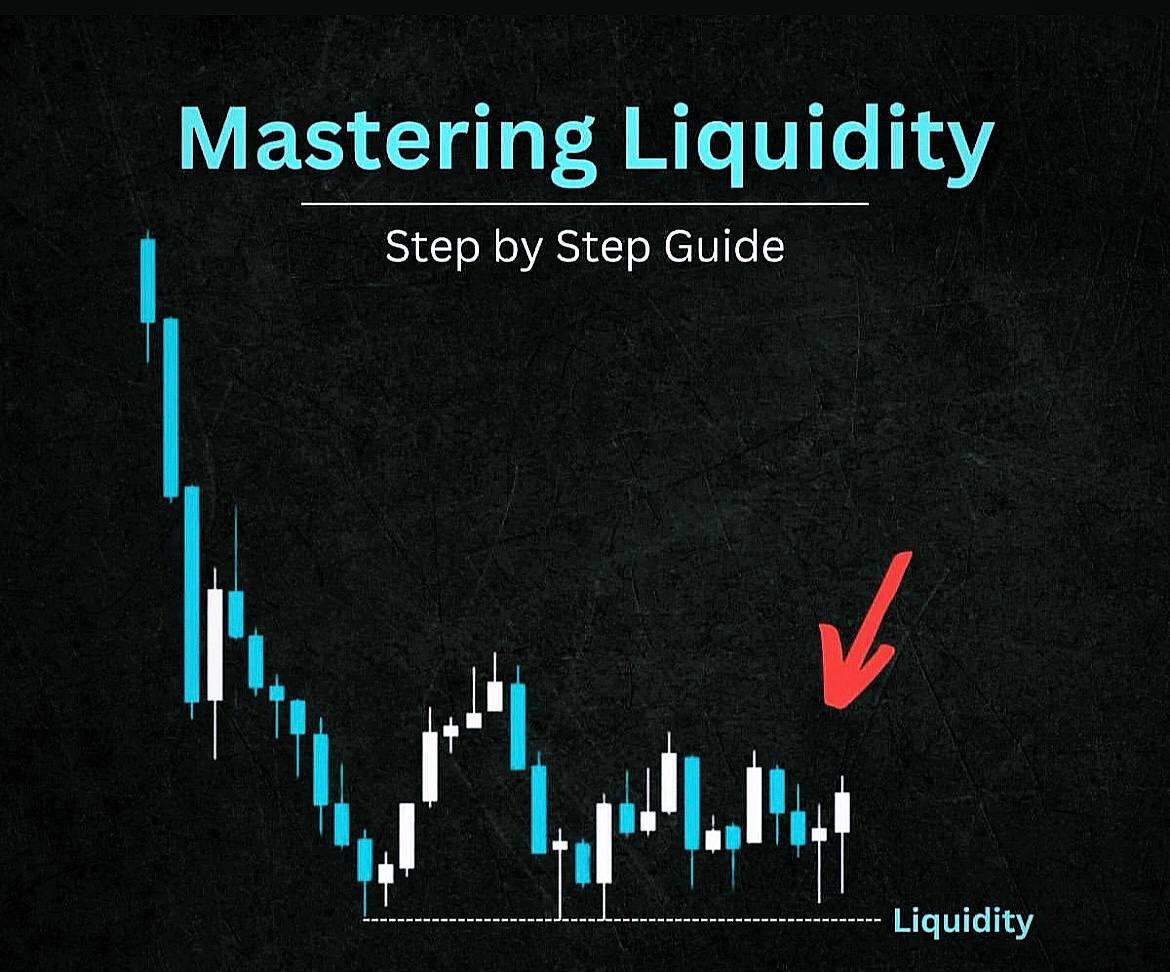
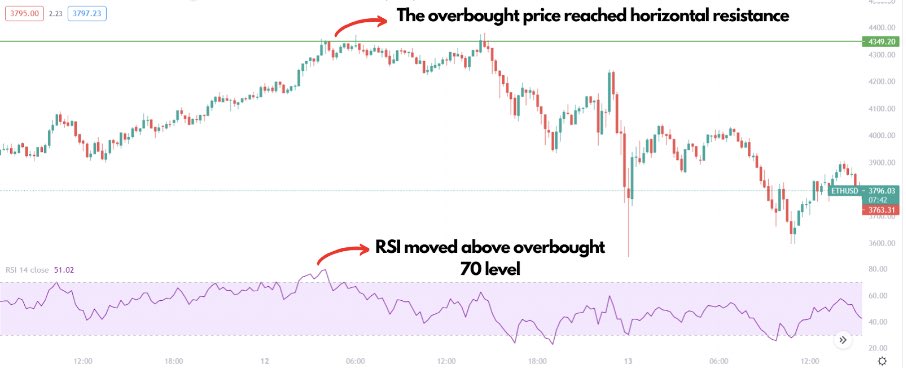
The Killzones are periods of intense market activity where the price action is at its most volatile.

This volatility can lead to significant price movements, which provide traders the opportunity to make profits.
Image
Image
2. ICT Killzones (Indices and FX)

The FX market operates 24H a day but is divided into several major sessions.

Each with its own characteristics and levels of activity.

These sessions are the Asian, London, and NY sessions.
Image
Image
3. High probability setups with Killzones:

- Mark and label the Killzones and trade ONLY within that time window.

- Identify the trend of the current market

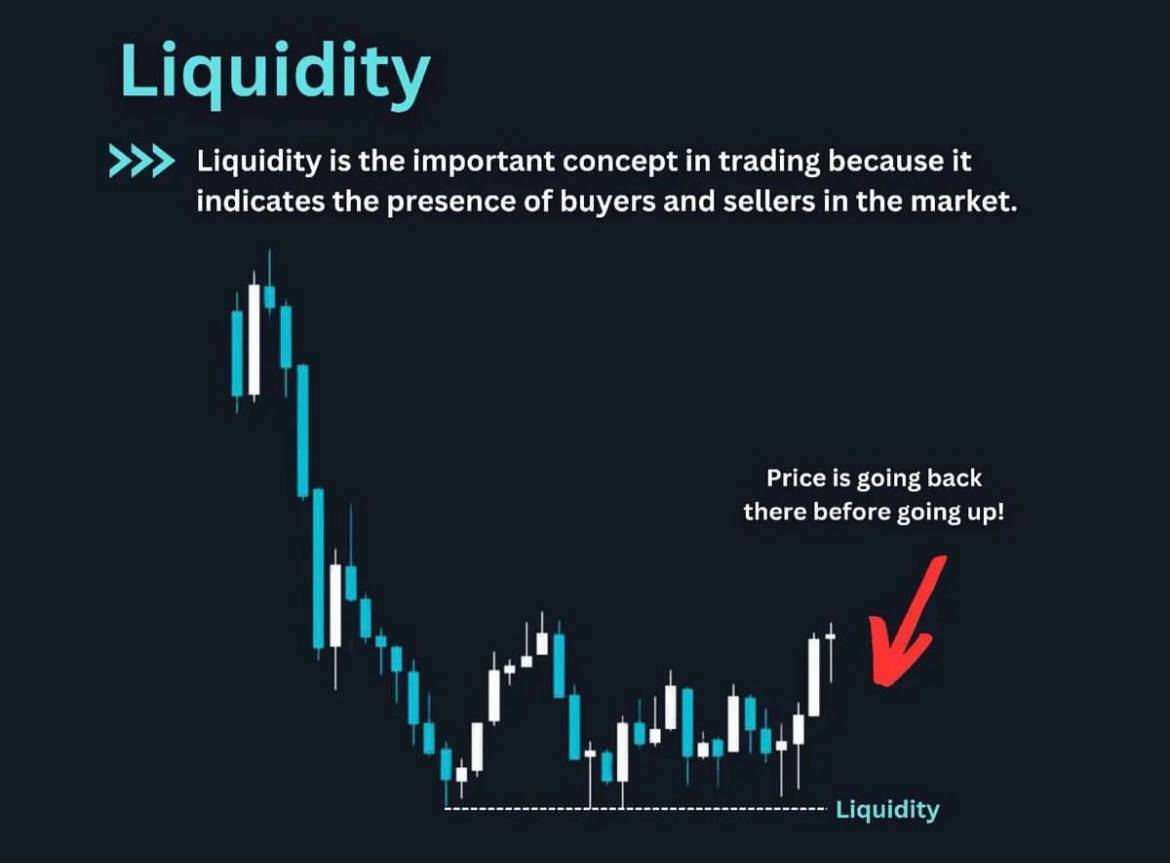
- Wait for the price to align with time. And liquidity/volume to kick in

- Enter trades only within that time window
Image
Image
4. How to trade Killzones:

1. Identify the trend:

Determine the trend of the price. Bullish or bearish?

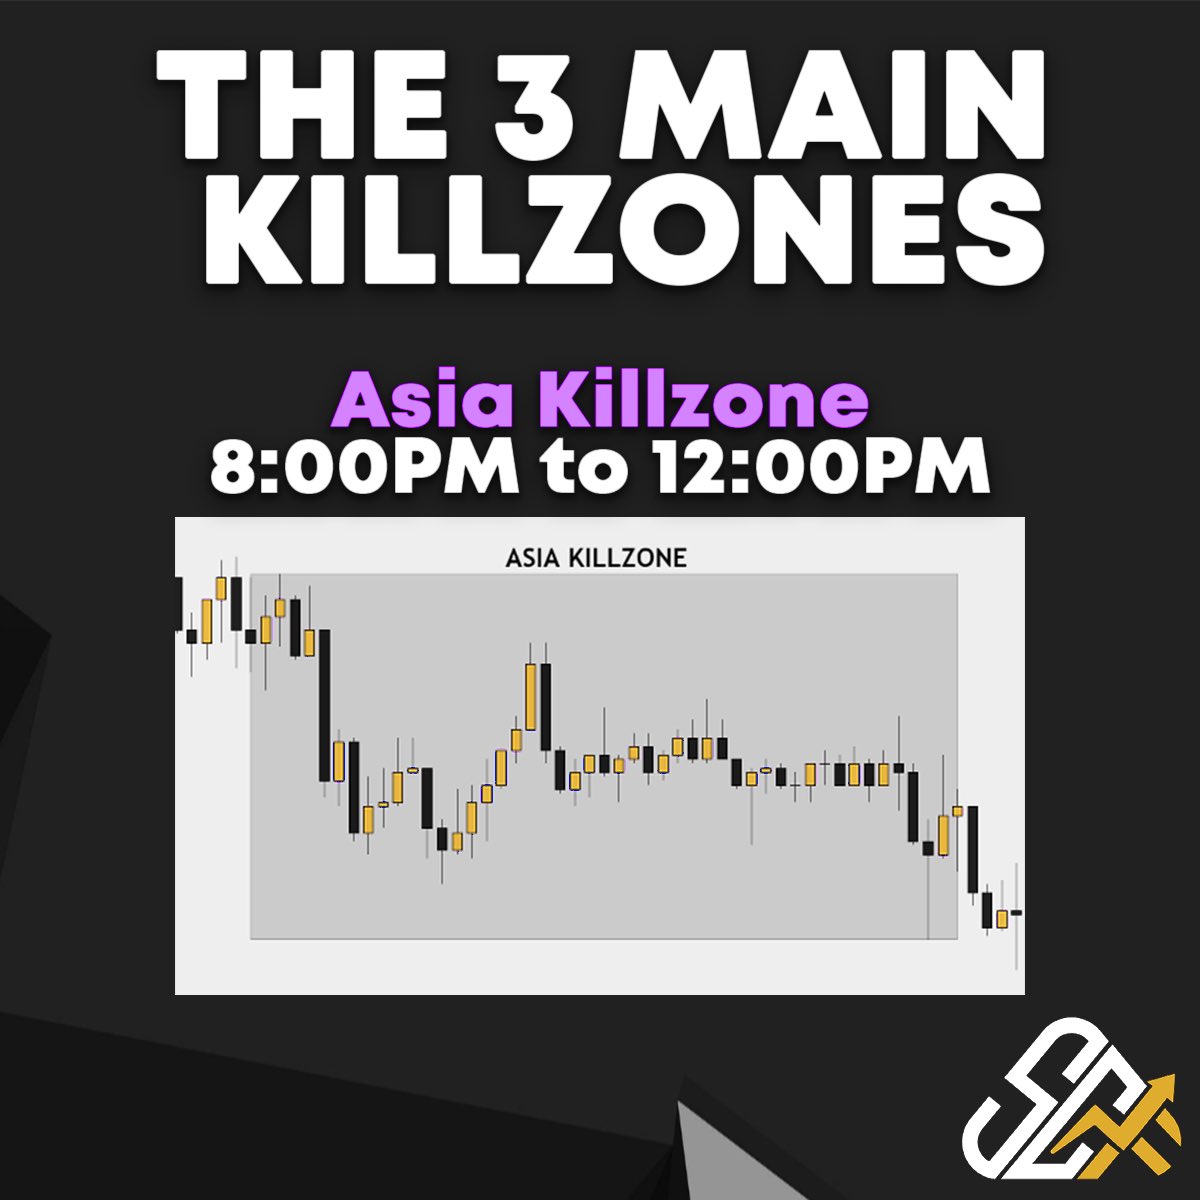
2. Identify the Asian Range:

Study the price movement during the Asian session

Notice if the price has formed a range, characterized by clear highs and lows.
Image
Image
4.1 How to trade Killzones:

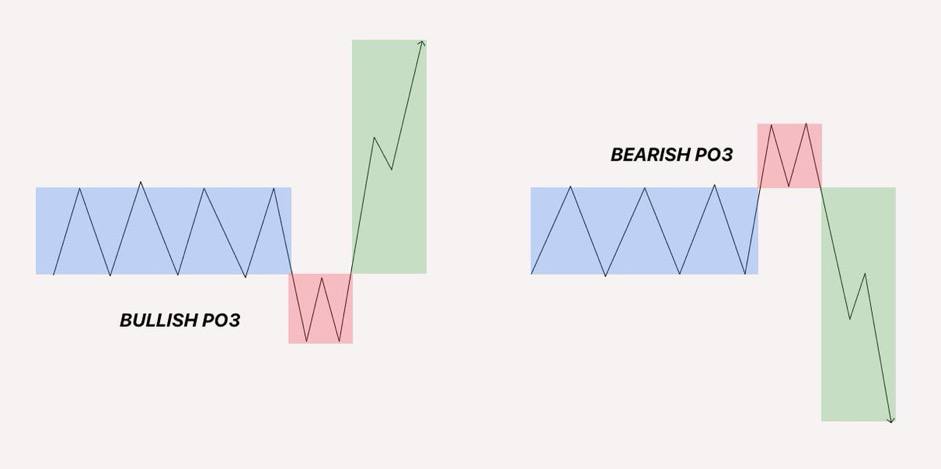
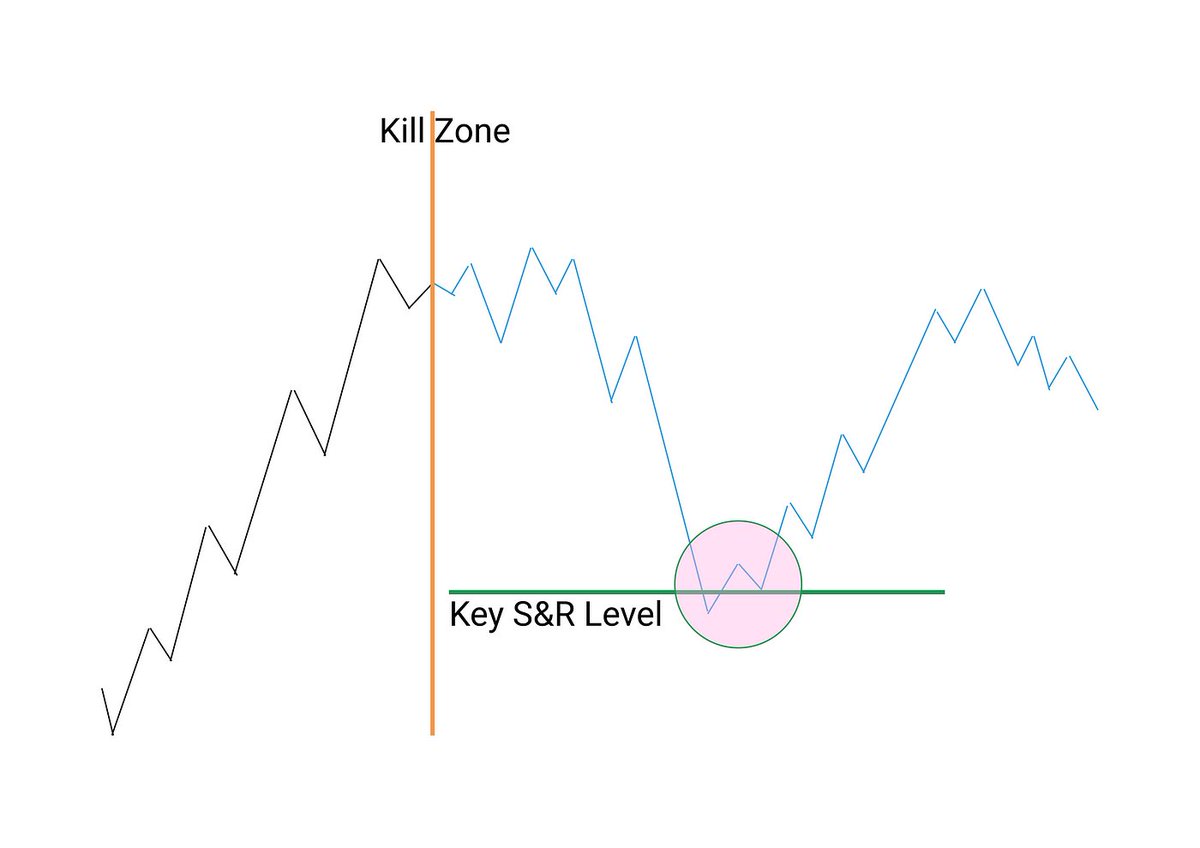
3. Look for false breakouts Against the Trend:

In the London or NY sessions, watch for price movements that breaks out of the Asian session’s range.

4. Take the trade:

After spotting a false breakout, take your trade during London or NY sessions. Image
5. Protective SL:

It’s key to set a protective stop loss in kill zones, especially during stop hunting.

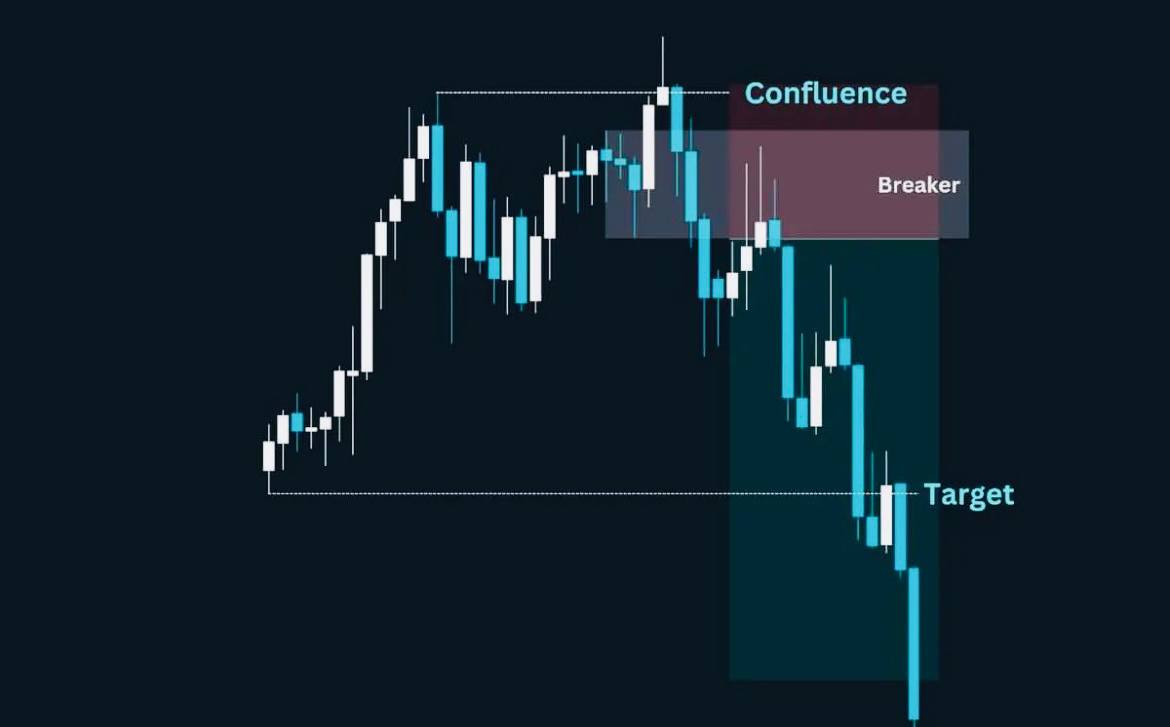
This technicals tools will help you determine the best placement for your stop loss:

- Order Block
- Supply and Demand Zone
- FVG
- Key Levels
- Swing Levels Image

• • •

Missing some Tweet in this thread? You can try to force a refresh
 

Keep Current with CryptoSoulz

CryptoSoulz Profile picture

Stay in touch and get notified when new unrolls are available from this author!

Read all threads

This Thread may be Removed Anytime!

PDF

Twitter may remove this content at anytime! Save it as PDF for later use!

Try unrolling a thread yourself!

how to unroll video
  1. Follow @ThreadReaderApp to mention us!

  2. From a Twitter thread mention us with a keyword "unroll"
@threadreaderapp unroll

Practice here first or read more on our help page!

More from @SoulzBTC

Feb 29
In this THREAD I will explain Liquidity.

1. What is “Liquidity”?
2. How to understand and use Liquidity.
3. How to MASTER Liquidity.

🧵(1/8) Image
1. What is “Liquidity”?

It’s a key concept in trading. Liquidity will indicate you the actual buying/selling pressure.

Liquidity acts as a magnet. When the price moves, is more likely to go to take out areas with a lot of liquidity in it. Image
2. How to understand and use Liquidity?

As a trader, you will use LIQUIDITY for:

- Confluence
- Target

In other words, Take profit and Stop loss. Image
Read 7 tweets
Feb 28
In this THREAD I will explain PO3.

Content:

1. Elements of PO3
2. Timeframes to use PO3
3. OHLC
4. OLHC
5. Examples of Bearish and Bullish PO3

🧵(1/10) Image
1. Elements of a PO3:

1.1 Accumulation:

Accumulation is a phase in the market where smart money or institutional investor are buying.

During accumulation, the price is relatively stable. Behind the scenes, investors are accumulating.

High bullish volume is present.
Image
Image
1.2 Manipulation:

Manipulation refers to intentional actions taken by smart money to control the price for their benefit.

Unusual price spikes/drops that don't align with fundamentals, may suggest manipulation.
Image
Image
Read 10 tweets
Feb 22
In this THREAD I will explain Breaker Blocks.

1. What is a “Breaker Block”?

2. How to identify a Breaker Block

3. How to trade using a Breaker Block

🧵 (1/9) Image
1. What is a “Breaker Block”?

A breaker block is a failed Order block, that results in market liquidity being taken out and the market structure changing.

From bullish to bearish or vice versa.

In the second image you have an illustration of a Breaker Block
Image
Image
2. How to identify a Breaker Block?

I will explain you STEP by STEP how to identify a Breaker Block within the present price action.

We will focus basically in 4 steps, which are the next ones; Image
Read 9 tweets
Feb 21
In this THREAD I will explain Liquidity Grab and MSS.

1. Displacement
2. Market Structure Shift (MSS)
3. Liquidity Grab
4. Examples

🧵 (1/5) Image
1. Displacement:

Displacement will appear as a single or a group of candles that are all positioned in the same direction.

These candles typically have large real bodies and very short wicks.

Displacement will occur just after a liquidity level has been breached. Image
2. Market Structure Shift (MSS)

A MSS is represented by a level on the chart where the previous trend is broken.

If the price is in an uptrend, the MSS level is where a LL is made.

If the price is in a downtrend, the MSS level is going to be at a point where a HH is made.
Image
Image
Read 5 tweets
Feb 12
In this THREAD I will explain RSI and how to trade with it:

1. How does the RSI work?
2. Overbought Area
3. Oversold Area
4. How to trade using RSI
5. When to BUY or SELL using RSI
6. Divergences using RSI

🧵(1/9) Image
1. How the RSI indicator works:

The value of the Relative Strength Index is that is based on the last 14 candles of that TF.

Measures the momentum (bullish or bearish) of last 14 candles.

RSI value will get close to 70 when price is overbought, and to 30 when it’s oversold.
Image
Image
2. Overbought Area:

A high RSI, generally above 70, signals that the price is overbought and the market should push the price lower.

Use pricing channels like Bollinger Bands to confirm the signal that the RSI generates.

Focus on HIGH TF (4H-1D) when using RSI.
Image
Image
Read 9 tweets
Dec 26, 2023
In this THREAD I will explain KILLZONES and how to trade them:

1. What are Killzones?
2. Asia Killzone
3. London Killzone
4. NY Killzone
5. How to trade Killzones?

🧵(1/7) Image
1. WHAT ARE KILLZONES?

Killzones are the times where it is the most optimal to execute your trade.

These are considered high probability trades due to the fact that trading volume is high during these times.

There are 3 main ones that you need to pay attention to. Image
2. THE 3 MAIN KILLZONES (in New York Time, UTC -5)

Asia – 8PM to 12PM:

- Characterized by consolidation
- Generates liquidity for both London & NY Image
Read 7 tweets

Did Thread Reader help you today?

Support us! We are indie developers!


This site is made by just two indie developers on a laptop doing marketing, support and development! Read more about the story.

Become a Premium Member ($3/month or $30/year) and get exclusive features!

Become Premium

Don't want to be a Premium member but still want to support us?

Make a small donation by buying us coffee ($5) or help with server cost ($10)

Donate via Paypal

Or Donate anonymously using crypto!

Ethereum

0xfe58350B80634f60Fa6Dc149a72b4DFbc17D341E copy

Bitcoin

3ATGMxNzCUFzxpMCHL5sWSt4DVtS8UqXpi copy

Thank you for your support!

Follow Us!

:(