Increased Measles in Canada - Are you protected?
As Public Health crumbles and too few people are getting vaccinated for measles our herd immunity levels have dropped too much and now many people are at risk for a disease we almost eradicated in Canada. 🧵1/
As Public Health crumbles and too few people are getting vaccinated for measles our herd immunity levels have dropped too much and now many people are at risk for a disease we almost eradicated in Canada. 🧵1/

Contents of Post:
* Worldwide Outbreaks
* Symptoms
* How is it Transmitted
* How to prevent Infection
* Damage from Measles
* Measles Depletes Immune Memory
* How long does Vaccine Last
* Breakthrough Infections
* Cleaning the Air
2/
* Worldwide Outbreaks
* Symptoms
* How is it Transmitted
* How to prevent Infection
* Damage from Measles
* Measles Depletes Immune Memory
* How long does Vaccine Last
* Breakthrough Infections
* Cleaning the Air
2/
There has been a huge surge in measles cases around the world including cases in the UK and USA. The government is strongly advising everyone in Canada to be vaccinated with 2 doses of measles vaccine, especially before travelling ( ). 3/canada.ca/en/public-heal…
Popular March break destinations like Florida are having measles outbreaks and the Florida Surgeon General is no longer requiring children who are unvaccinated to remain home from schools where measles cases are circulating which means cases will continue to surge there. 4/
Measles is one of the most contagious viruses that infect humans, spreads through the air, and requires such a small dose to become infected that 90% of people who are not immune will become infected if exposed. 5/
Aerosols can remain airborne for hours so even walking into an empty room where a contagious person had been 2 hours previously can be enough to continue infecting people ( ). 6/ottawa.ctvnews.ca/health-officia…
Initial symptoms include fever, red watery eyes, runny nose, cough, followed by a rash that starts on the face and then moves to the rest of the body. 7/

Small white (Koplik) spots may also appear in the mouth or back of the throat and usually 1 day before the onset of rash ( ). 8/ncbi.nlm.nih.gov/books/NBK54979…
Symptoms may develop 7-21 days after exposure, the rash typically appears 3-7 days after symptoms start and lasts 4-7 days, symptoms can last 1-2 weeks ( ). 9/ottawapublichealth.ca/en/public-heal…
People can be contagious days before the rash (which is not itchy) and also days after the rash is gone so just because you feel better doesn't mean you can't infect others. 10/
Since measles is airborne, cleaning the air (ventilation, filtration) and wearing a respirator can prevent infection. 11/
How do air cleaners/HEPA filters or respirators actually work to capture tiny microscopic viruses? Learn here how they don't work like a sieve ( ). 12/
https://twitter.com/jeffgilchrist/status/1602994049815908353
More and more of these almost eradicated or less common diseases are returning including things like scarlet fever. 13/
We really should be investing in infrastructure improvements to clean the air like we did for drinking water considering they all spread through the air ( ). 14/
https://twitter.com/jeffgilchrist/status/1607379781892575234
The measles vaccine is also highly effective. Before the introduction of the vaccine in 1963, major measles epidemics occurred every 2-3 years killing an estimated 2.6 million people each year ( ). 15/who.int/news-room/fact…
"Measles is among the leading causes of morbidity and mortality worldwide during childhood, particularly in developing countries." ( ). 16/ncbi.nlm.nih.gov/books/NBK54979…
This is why there was a concerted effort to eradicate measles and why it is still important for people to get vaccinated for it. Parents should ensure their children and adolescents actually received both of their measles vaccines. 17/
These are usually given as a combo MMR (Measles-Mumps-Rubella) vaccine at 12 months and a second dose at 18 months or 4-6 years of age. Infants can receive a dose as early as 6 months if travelling to a high risk area ( ). 18/canada.ca/en/public-heal…
In Ontario, measles vaccination rates in 7 year old's were only 59% for the 2021-2022 school year where you need closer to 95% to protect the community (herd immunity) so a lot of children will not be protected ( ). 19/ottawa.ctvnews.ca/health-officia…
Adults also need to double check their vaccination history as some may have only received 1 dose decades ago. If you are unsure, speak to your healthcare provider about a potential MMR booster dose or getting a blood test to see if they are already immune to measles. 20/
Vaccines can also be obtained at walk-in clinics and travel clinics. The MMR booster vaccines are the same ones given to both adults and children. 21/
Most of us have never experienced measles or even know someone who had it so we do not understand how serious infection can be. 22/
Measles infection can lead to brain damage and death in 2-3 of every 1000 cases. If you are pregnant, older than 20, a child < 5, or immunocompromised you are at higher risk of complications. 23/
Measles can also cause deafness, blindness, severe diarrhoea and related dehydration, ear infections, and severe breathing problems including pneumonia ( ). H/T: @malolisica 24/who.int/news-room/fact…
"All children or adults with measles should receive two doses of vitamin A supplements, given 24 hours apart. This restores low vitamin A levels that occur even in well-nourished children." 25/
"It can help prevent eye damage and blindness. Vitamin A supplements may also reduce the number of measles deaths." 26/
Unfortunately infection from measles can also cause damage to your immune system and eliminates pre existing immune memory from previous infections ( ). 27/ science.org/doi/10.1126/sc…

Epidemiological evidence found people who had been infected with measles had increased morbidity and mortality for up to 5 years after infection. 28/
Measles may have accounted for up to 50% of all childhood deaths from infectious disease mostly from non-measles infections that children could no longer fight off. 29/
Testing before and after infection they found children lost 33% (median) of their total pre-existing pathogen-specific antibody repertoires in mild measles infections and 40% (median) in severe infections while controls retained 90% over similar or longer durations. 30/

The study also looked at measles vaccination which confirmed that the vaccine does not impair the immune repertoire like an infection does. 31/ Click "Show replies" 👇 to continue.
How does measles do this? It seems that measles can infect 20-70% of immune memory cells including B cells, T cells, and plasma cells in the lymphoid tissue and peripheral blood during the first 3-10 days after infection. 32/
T cell immunity may also diminish after measles infection and explain why cutaneous tuberculosis tests no longer test positive and remission of autoimmune related disorders are more common. 33/
You can read more about how measles wipes out the body's immune memory here ( ) and ( ). 34/asm.org/Articles/2019/…
news.harvard.edu/gazette/story/…
news.harvard.edu/gazette/story/…
When measles vaccination rates are reduced and outbreaks occur, herd immunity for secondary infectious disease can also be lost due to this destruction of immune memory from measles infections ( ). 35/royalsocietypublishing.org/doi/full/10.10…
Protecting against measles also provides added benefits of protecting against other diseases as well. 36/
It was expected that people with two doses of measles vaccines may be protected for life but a study in Brazil found seropositivity may be lower than expected in adequately immunized adults ( ). 37/ncbi.nlm.nih.gov/pmc/articles/P…
Seropositivity was higher among older individuals and those with a shorter time since the last MMR vaccine dose. 38/
"The high rate of seronegative individuals in adequately vaccinated populations raises concerns about the potential role of a third dose of the MMR vaccine, particularly during outbreaks." 39/
"Our data revealed that 67.3% of young adults considered adequately vaccinated had apparently non-protective IgG antibody titers, which may render them susceptible to measles." 40/
Low or undetectable levels of antibodies does not guarantee lack of protection with virus exposure but it is possible that cellular immune responses that were not measurable at the time may still provide some protection. 41/
"The measles-containing vaccine (MCV) is highly effective, but a small number of two dose-vaccinated people (around 3%) exposed to the virus contract measles." ( ). 42/ncbi.nlm.nih.gov/pmc/articles/P…
"In Spain, from 2003 to 2014, around 3.5% of confirmed cases had received two doses of MMR vaccine, most of them having received the second dose more than 10 years prior." 43/
There are already signals that measles may be quietly spreading in Canada with at least 9 confirmed infections in 2024 after 2 months compared to 12 cases for all of 2023 ( ). H/T: @kristinaEBP 44/cbc.ca/news/health/me…
Two recent cases identified in Quebec and Ontario were not tied to prior travel or came into contact with any known measles cases suggesting they were infected within their community. 45/
One case hadn't been vaccinated and the other was a vaccinated man in his 30s who still had a breakthrough infection with milder symptoms. 46/
People previously vaccinated for measles who still get infected can have clinical presentations from mild to an illness that meets the full case definition so can make identification more difficult ( ). 47/ncbi.nlm.nih.gov/pmc/articles/P…
Cleaning the air isn't just important for measles but TB, COVID, and respiratory viruses also transmit through the air via aerosols ( ). 48/science.org/doi/10.1126/sc…
For some reason Public Health will easily say that Measles and TB is airborne but they aren't educating the public that other viruses and bacteria use the exact same transportation network (aerosols) to spread in the air. 49/
TB bacteria which can be as long as 7000 nm ( ) use the same aerosol transportation as the 47x smaller measles virus (150 nm) ( ) and the even smaller COVID virus (90 nm) ( ). 50/erj.ersjournals.com/content/54/sup…
ncbi.nlm.nih.gov/pmc/articles/P…
ncbi.nlm.nih.gov/pmc/articles/P…
ncbi.nlm.nih.gov/pmc/articles/P…
ncbi.nlm.nih.gov/pmc/articles/P…
While it is important to wash your hands in general, protecting your airways is where the focus and biggest investments should be made. The risk of contact transmission via hands from COVID in a community setting is extremely rare. 51/
This study tested 925 swabs and found only 0.32% had any viral RNA detected and of those, none of the samples contained viable viruses so unable to infect ( ). 52/cureus.com/articles/22753…
Had Public Health and governments started investing in upgrading the infrastructure for clean indoor air early in the pandemic when it became obvious that COVID and respiratory viruses also spread via aerosols, we would be in a much better position today... 53/
...to deal with outbreaks of other viruses and increasing wildfire smoke pollution ( ). 54/
https://twitter.com/jeffgilchrist/status/1672979098778456066
@threadreaderapp please unroll
@mchkzn from ( )ottawapublichealth.ca/en/public-heal…
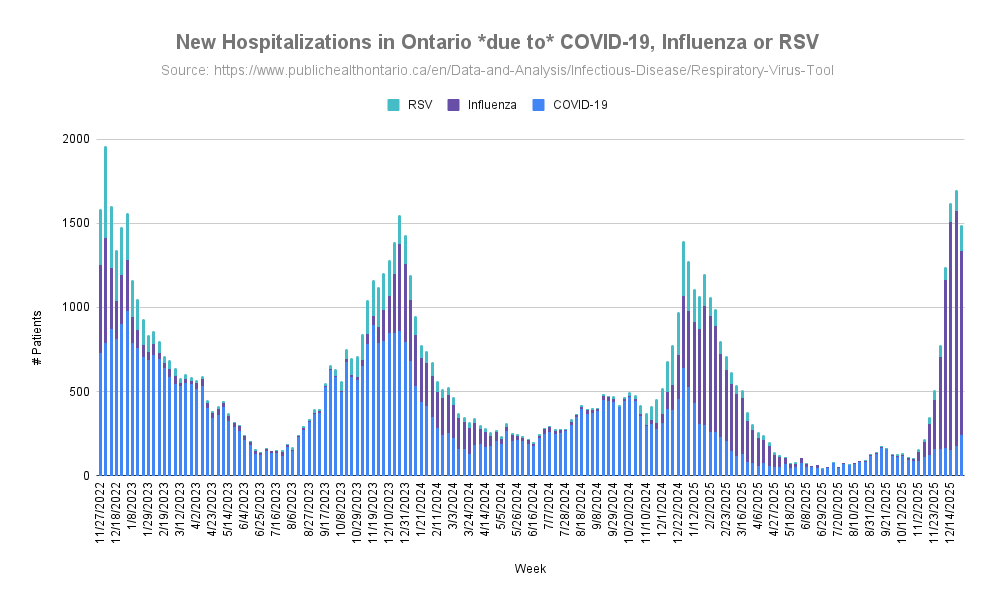
@Velvetpage You can see in Ontario that confirmed cases of invasive group a strep (iGAS) have been a lot higher the past couple of years compared to pre-pandemic times ( ). publichealthontario.ca/-/media/Docume…

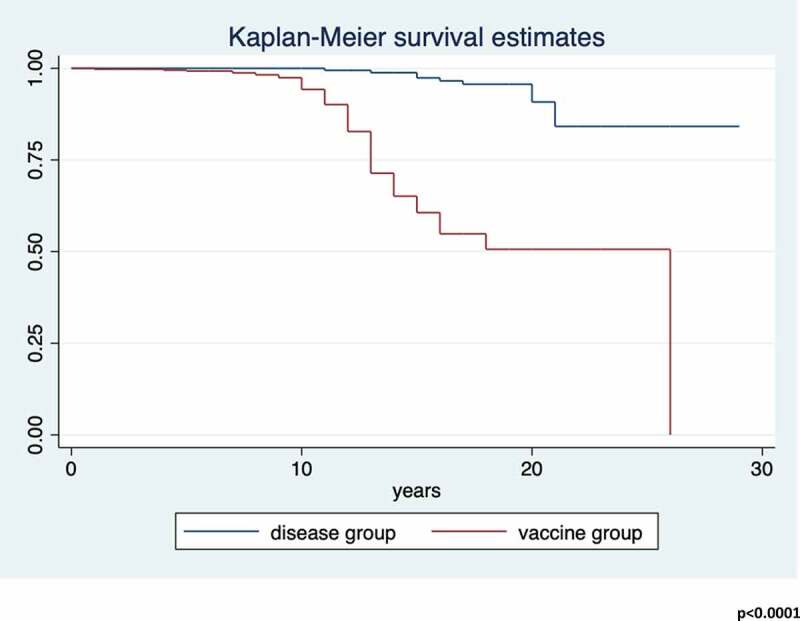
People have been asking, if they were infected with the actual measles virus decades ago do they still have protection? This study in 2021 looked at that question vs vaccination ( ). 55/ncbi.nlm.nih.gov/pmc/articles/P…
"Current evidence suggests that immunity after the disease is life-long, whereas the response after two doses of measles-containing vaccine declines within 10–15 years." 56/
In their vaccinated group about 20% of people lacked detectable circulating anti-measles IgG antibodies compared to only 6% of their previously infected group. This graph shows vaccine antibody level declines over time. 57/
"Prevalence of Italian HCWs susceptible to measles equal to 12% and so firm measures of control and prevention are needed to reduce the risk of measles in nosocomial environment and its complication especially in high risk patients." 58/
• • •
Missing some Tweet in this thread? You can try to
force a refresh