In this THREAD I will explain Market Maker Models.
1. What are “Market Maker Models”?
2. MMSM - Sell Model
3. MMBM - Buy Model
4. How do MMXM work?
5. How to identify MMXM
🧵(1/11)

1. What are “Market Maker Models”?
2. MMSM - Sell Model
3. MMBM - Buy Model
4. How do MMXM work?
5. How to identify MMXM
🧵(1/11)
1. What are “MMXM”?
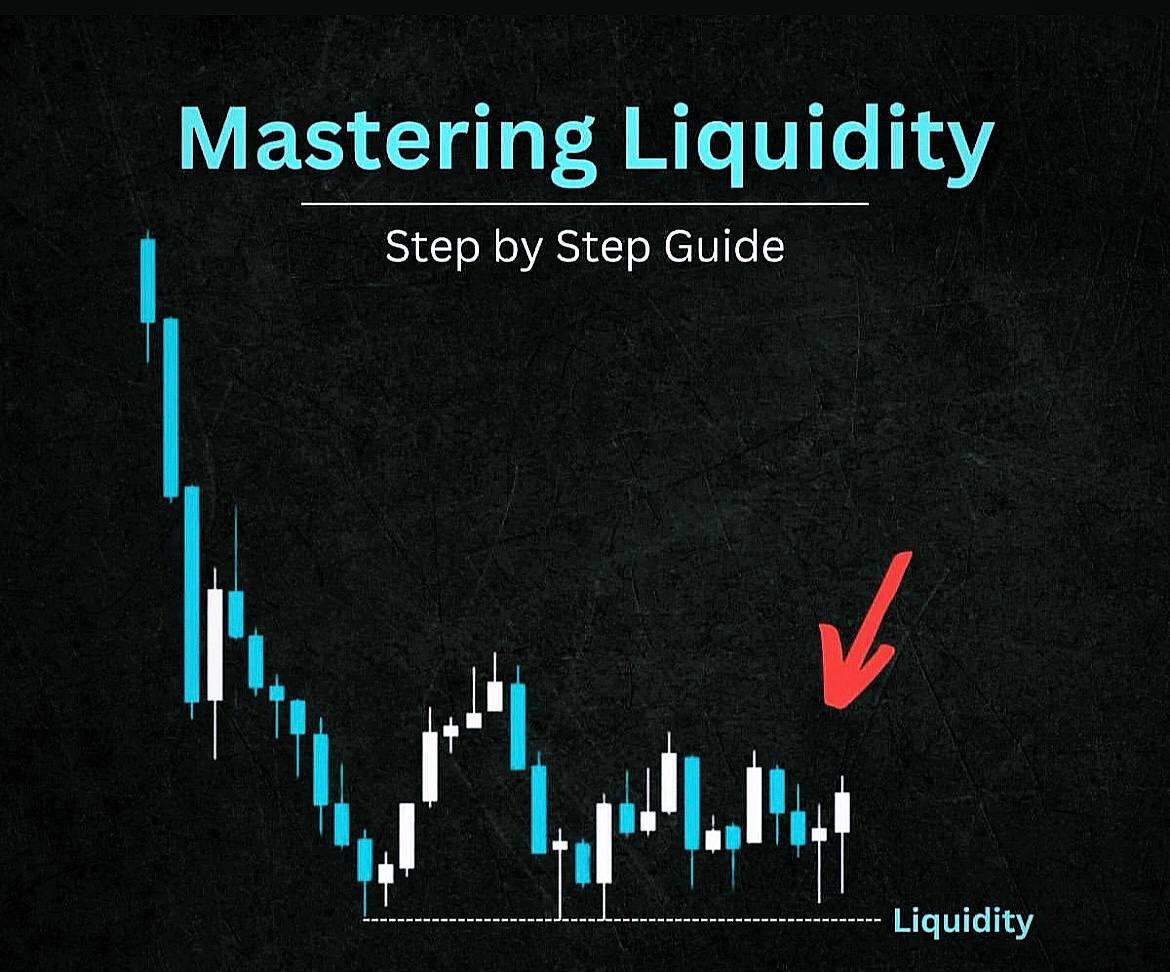
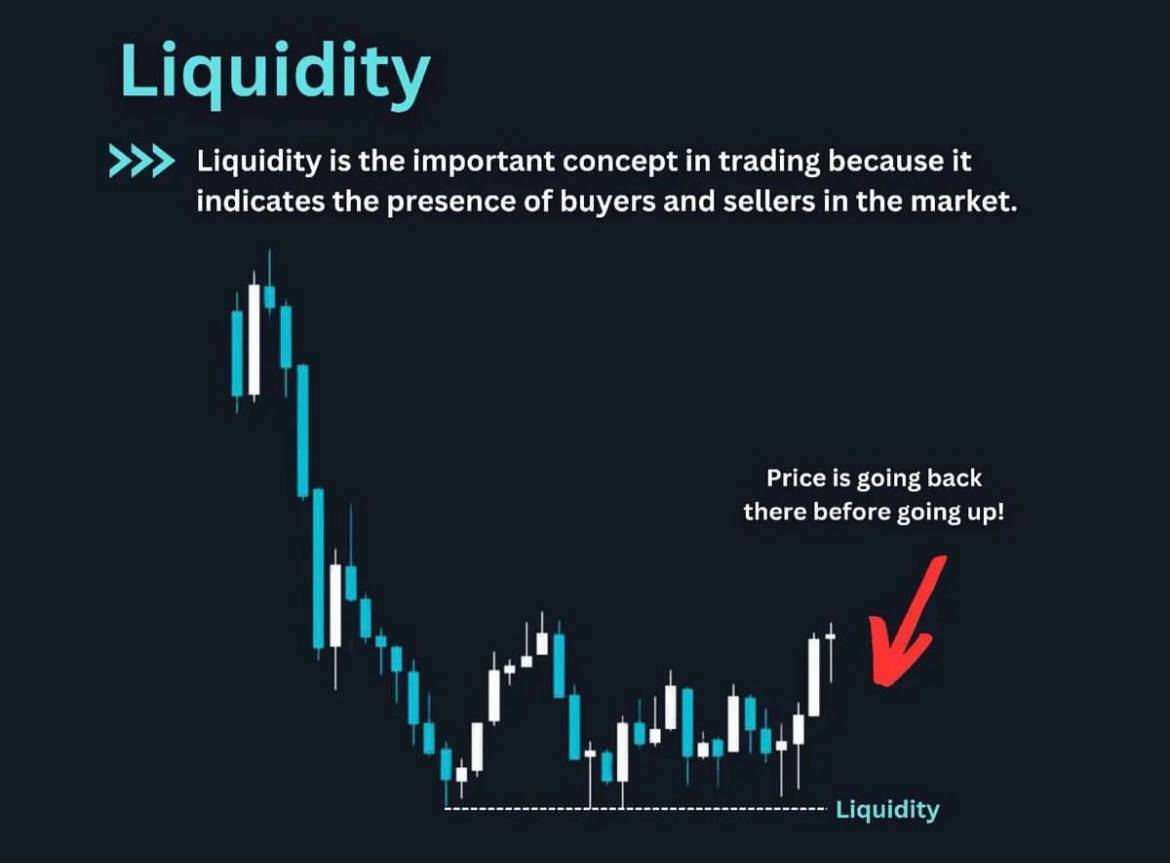
Is a trade setup based on price trading into a HTF liquidity pool.
These market makers follow a predictable pattern of behavior, often referred to as the “smart money cycle”
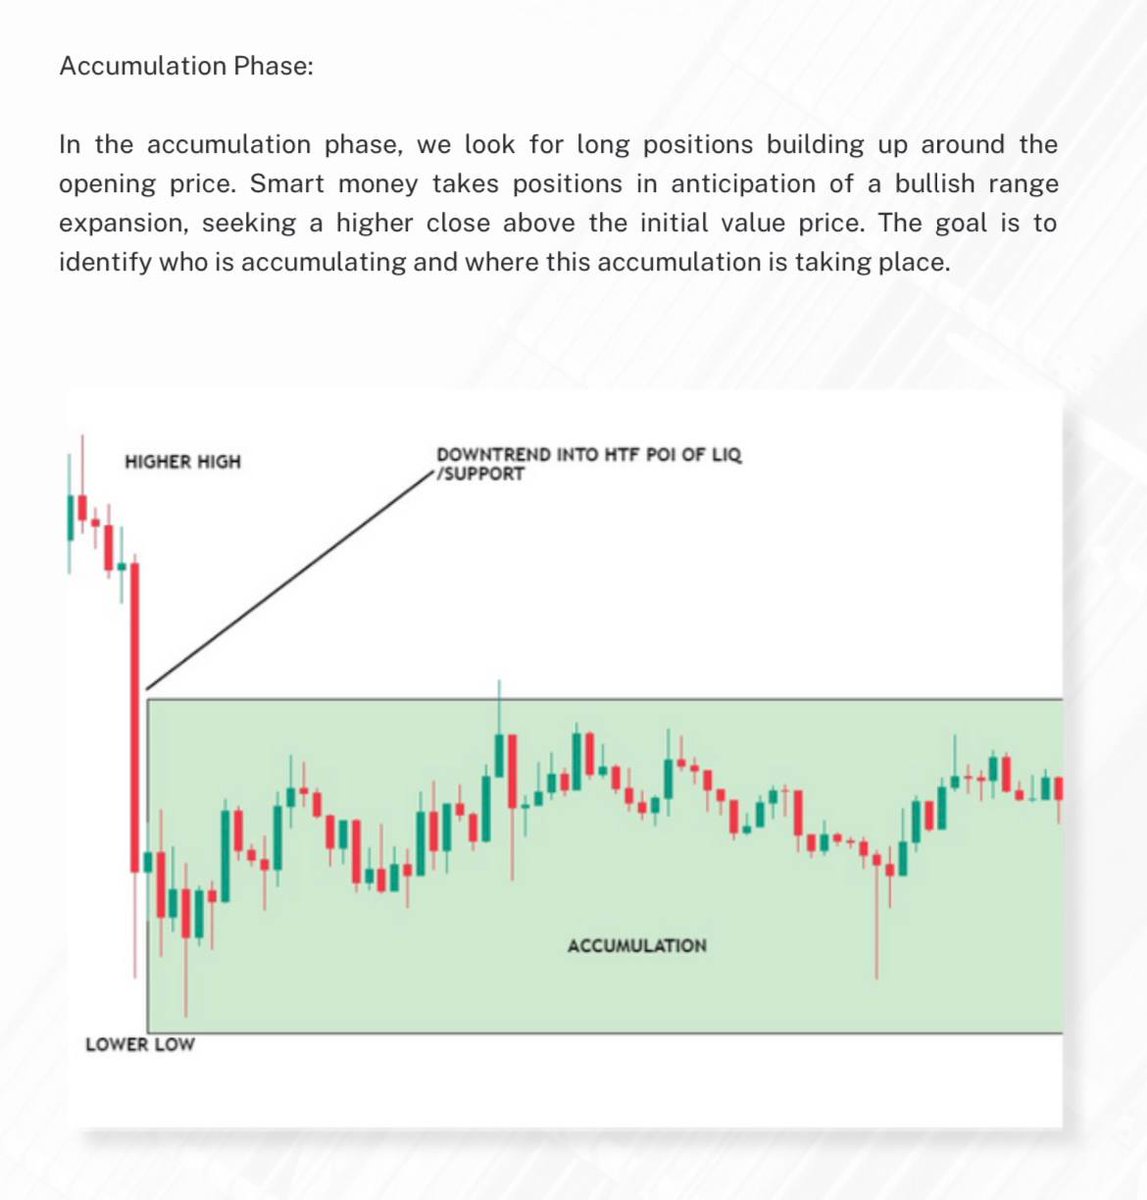
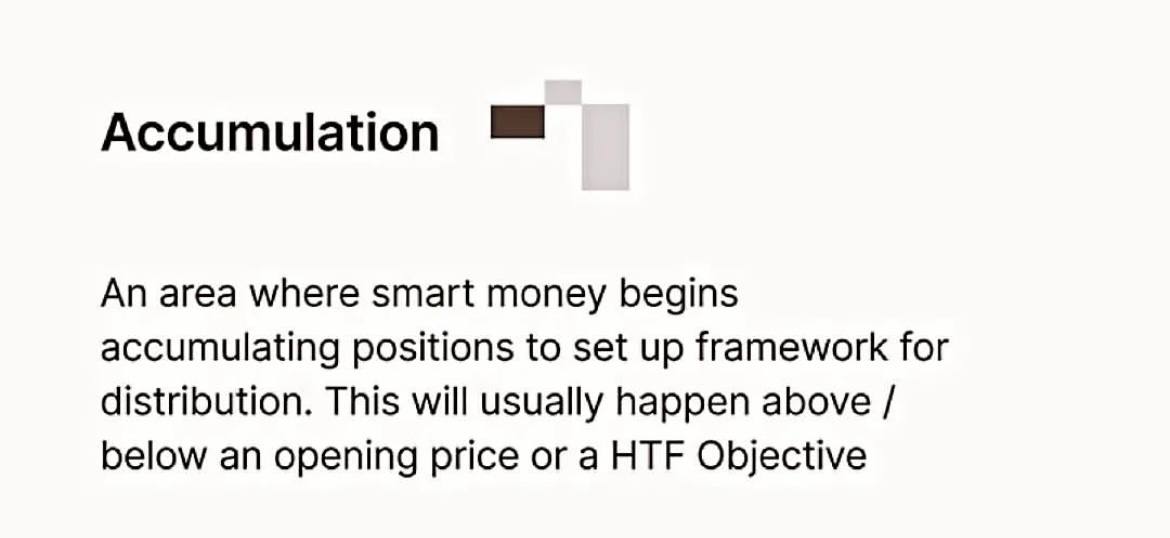
This cycle includes phases such as accumulation, manipulation, and distribution
Is a trade setup based on price trading into a HTF liquidity pool.
These market makers follow a predictable pattern of behavior, often referred to as the “smart money cycle”
This cycle includes phases such as accumulation, manipulation, and distribution
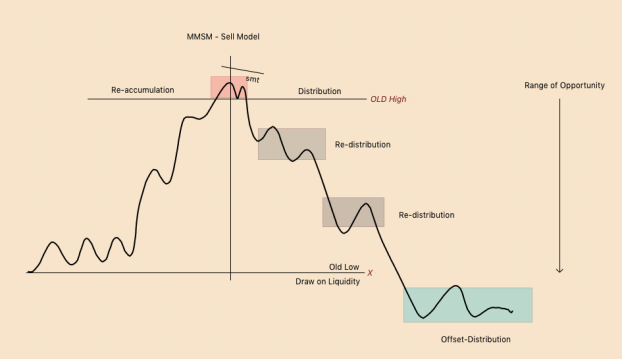
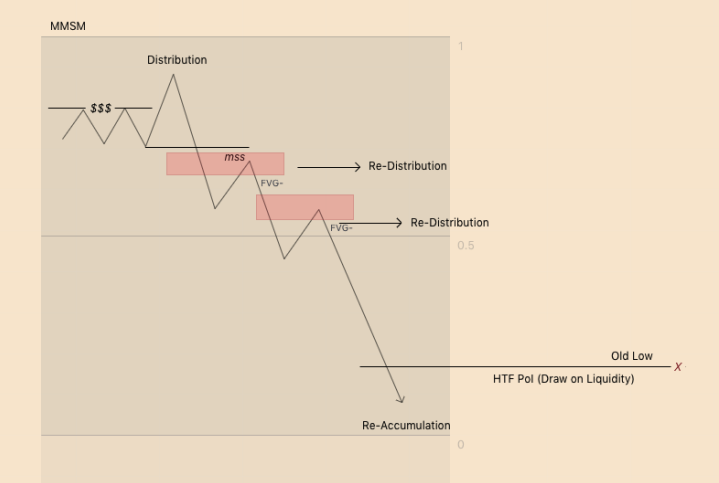
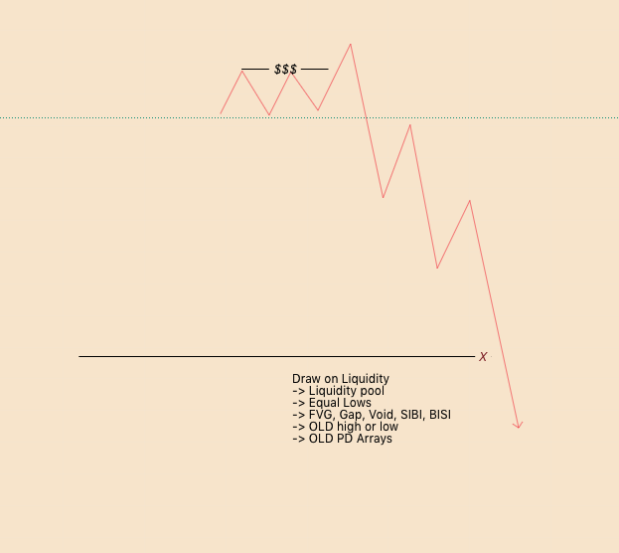
2. MMSM - Sell Model
Identify Draw on liquidity (DOL)
A MMSM usually starts with an impulse move higher into a HTF premium of an array.
Price will displace and create a MSS DOWN. This will signal the start of the MMSM.
Price is being distributed during this process
Identify Draw on liquidity (DOL)
A MMSM usually starts with an impulse move higher into a HTF premium of an array.
Price will displace and create a MSS DOWN. This will signal the start of the MMSM.
Price is being distributed during this process
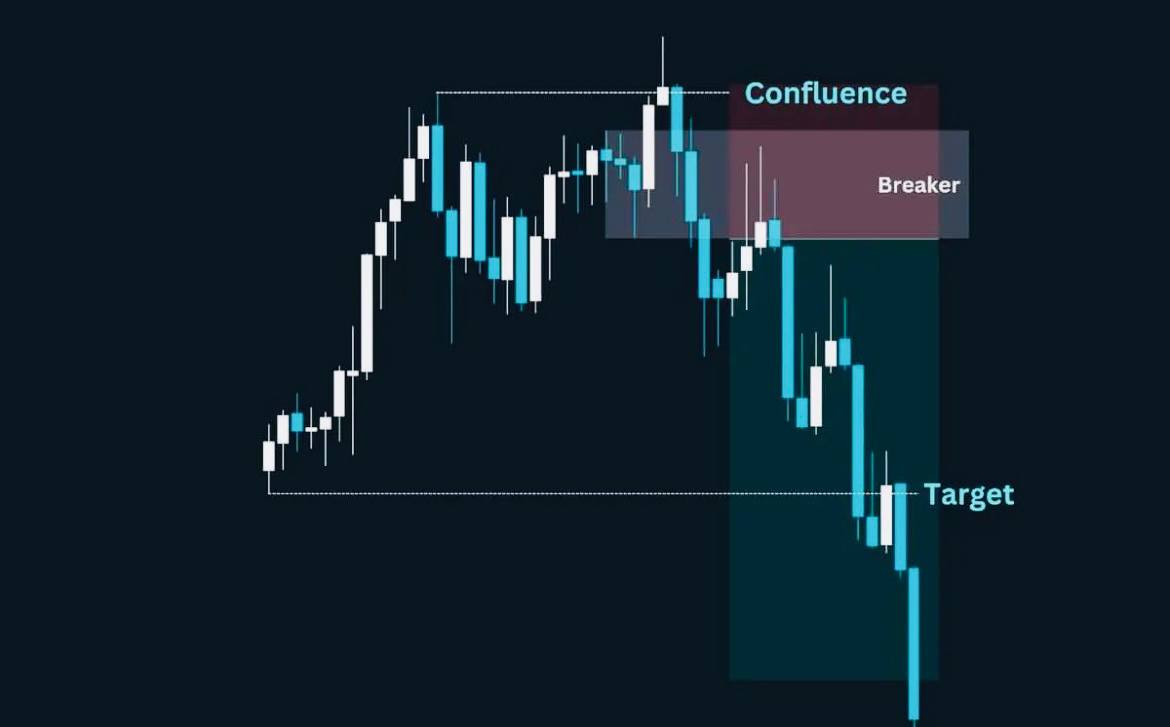
2.1 MMSM - Sell Model
As price retraces back up, it enters supportive structure of the trend down towards our DOL.
The supportive structure to enter is at FVG’s and OB. This is called re- distribution.
From here, price may base and continue the trend or reverse
As price retraces back up, it enters supportive structure of the trend down towards our DOL.
The supportive structure to enter is at FVG’s and OB. This is called re- distribution.
From here, price may base and continue the trend or reverse
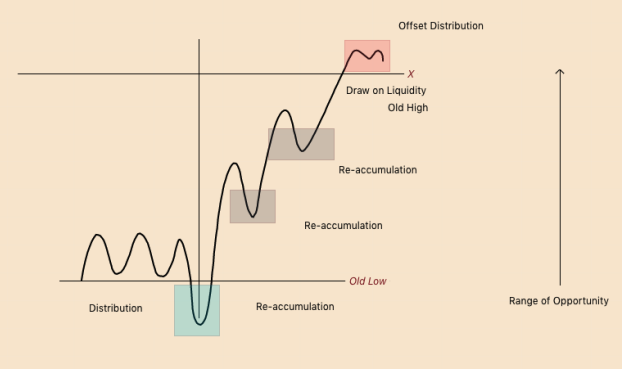
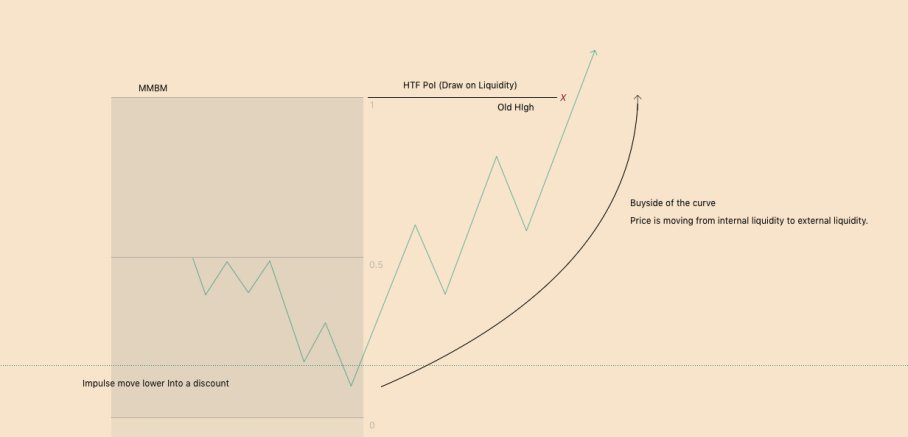
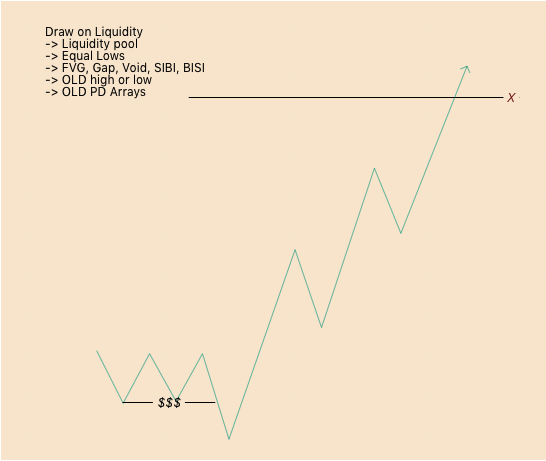
3. MMBM - Buy Model
Identify HTF POI (Monthly, Weekly, Daily)
Seeing the initial base of the MMBM, comes from the impulse move lower into a HTF discount of an array.
Then displaces and creates a MSS UP. Paired with a reason to move higher (liquidity)
Identify HTF POI (Monthly, Weekly, Daily)
Seeing the initial base of the MMBM, comes from the impulse move lower into a HTF discount of an array.
Then displaces and creates a MSS UP. Paired with a reason to move higher (liquidity)
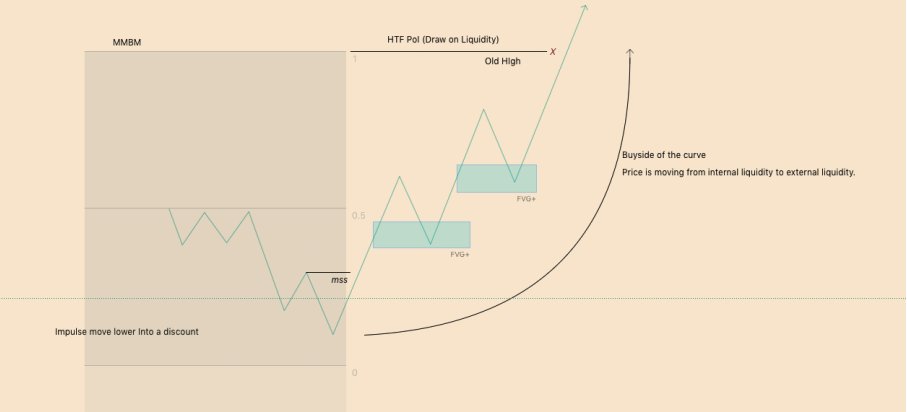
3.1 MMBM - Buy Model
This is what adding into the MMBM should look like:
You are adding into internal liquidity FVG’s and orderblocks, and are selling for profit in external liquidity.
Internal liquidity refers to the area inside of a swing high and swing low (any TF)
This is what adding into the MMBM should look like:
You are adding into internal liquidity FVG’s and orderblocks, and are selling for profit in external liquidity.
Internal liquidity refers to the area inside of a swing high and swing low (any TF)
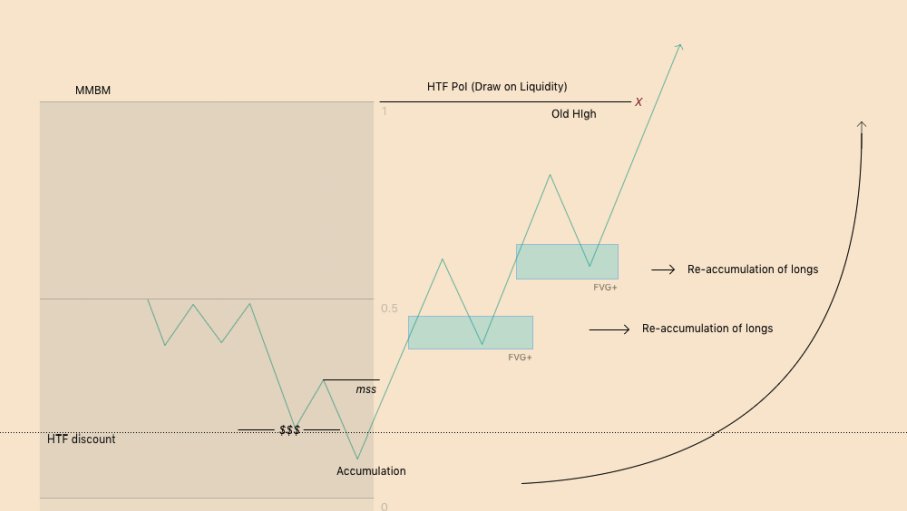
3.2 MMBM - Buy Model
You will use MS to add your position within the trend. You will be looking for OB or FVG’s to add into.
In doing so, you are re-accumulating long positions, with target at the HTF DOL
This is where longs will look to exit, also called offset-distribution
You will use MS to add your position within the trend. You will be looking for OB or FVG’s to add into.
In doing so, you are re-accumulating long positions, with target at the HTF DOL
This is where longs will look to exit, also called offset-distribution
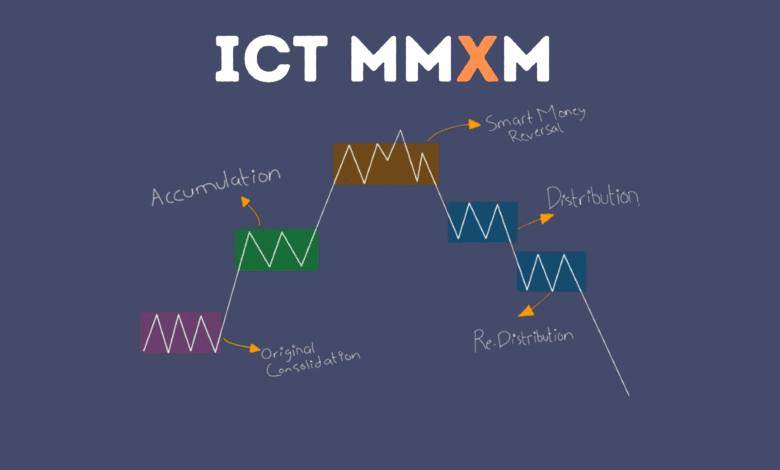
4. How do MMXM work?
These models work based on where the Draw on liquidity (DOL) is.
Structure should support the direction of price and not oppose it.
The different DOL's provide us with a possible narrative. MS is what guide us in our reading of HTF price action.
These models work based on where the Draw on liquidity (DOL) is.
Structure should support the direction of price and not oppose it.
The different DOL's provide us with a possible narrative. MS is what guide us in our reading of HTF price action.
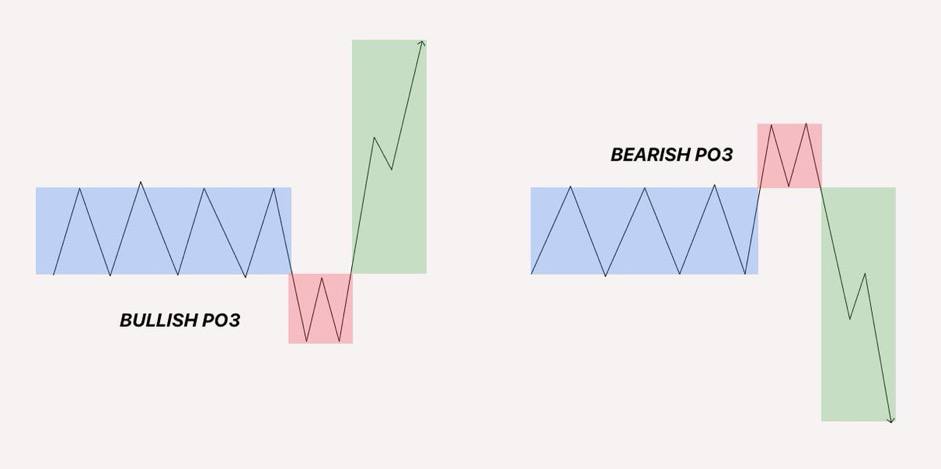
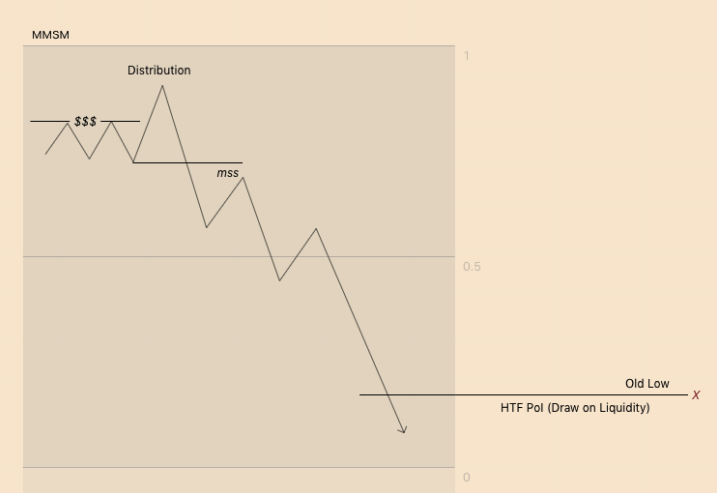
4.1 How do MMXM work?
A general idea of a MMSM:
- Price expansion DOWNWARDS towards sellside liquidity
- Do you identify the Optimal Trade Entry (OTE)?
- Retracements into FVG’s are where shorts will re-distribute
A general idea of a MMSM:
- Price expansion DOWNWARDS towards sellside liquidity
- Do you identify the Optimal Trade Entry (OTE)?
- Retracements into FVG’s are where shorts will re-distribute
4.2 How do MMXM work?
A general idea of a MMBM:
- Price expansion UPWARDS towards buyside liquidity
- Pullbacks into FVG’s are where longs will re-accumulate
For both models, price will be looking to EXPAND towards the DOL.
In doing so, it will create FVG’s and OB.
A general idea of a MMBM:
- Price expansion UPWARDS towards buyside liquidity
- Pullbacks into FVG’s are where longs will re-accumulate
For both models, price will be looking to EXPAND towards the DOL.
In doing so, it will create FVG’s and OB.
5. How to identify MMXM
- HTF analysis of liquidity
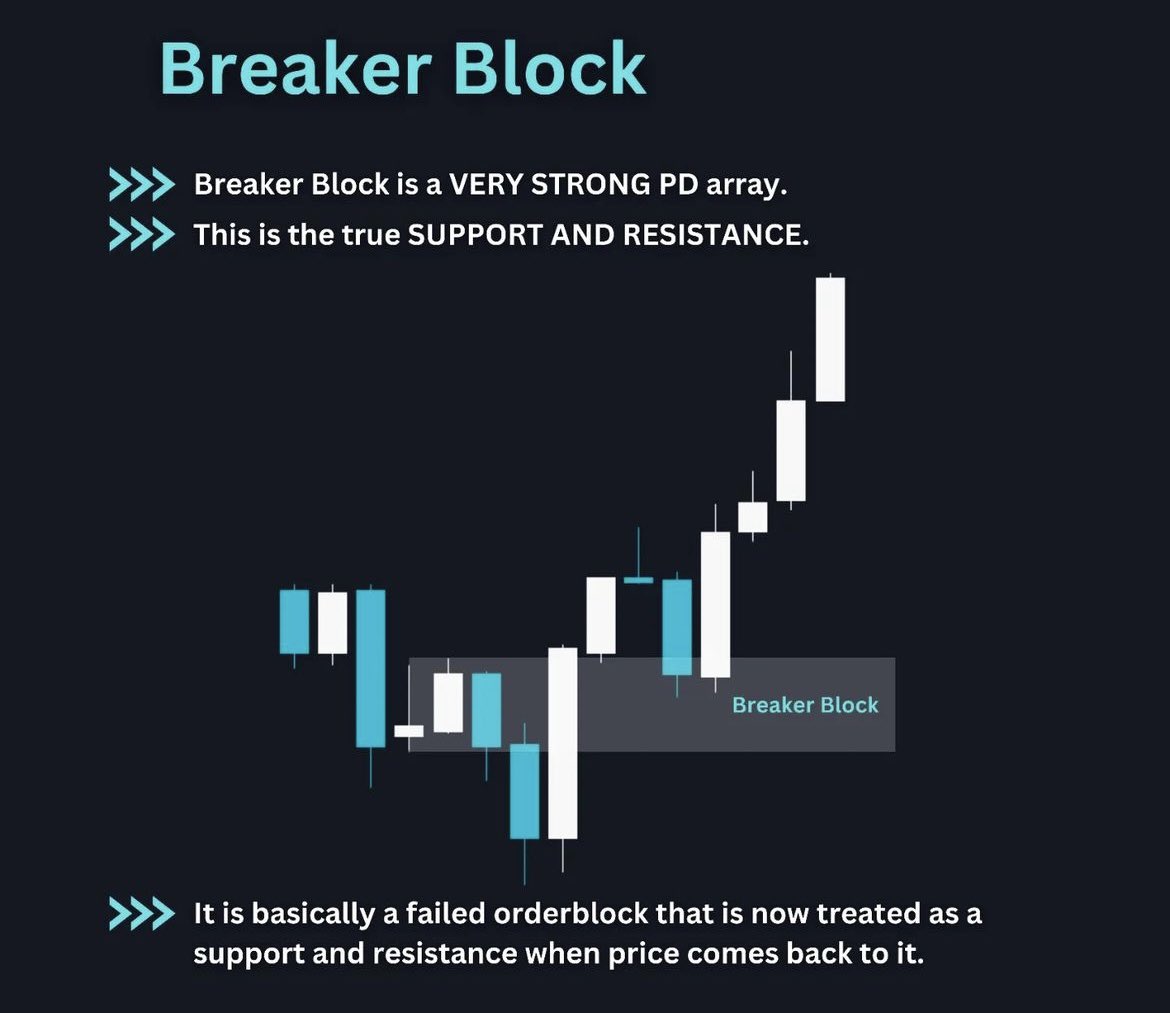
- Annotate the PD Arrays inside each major swing high or low from this analysis
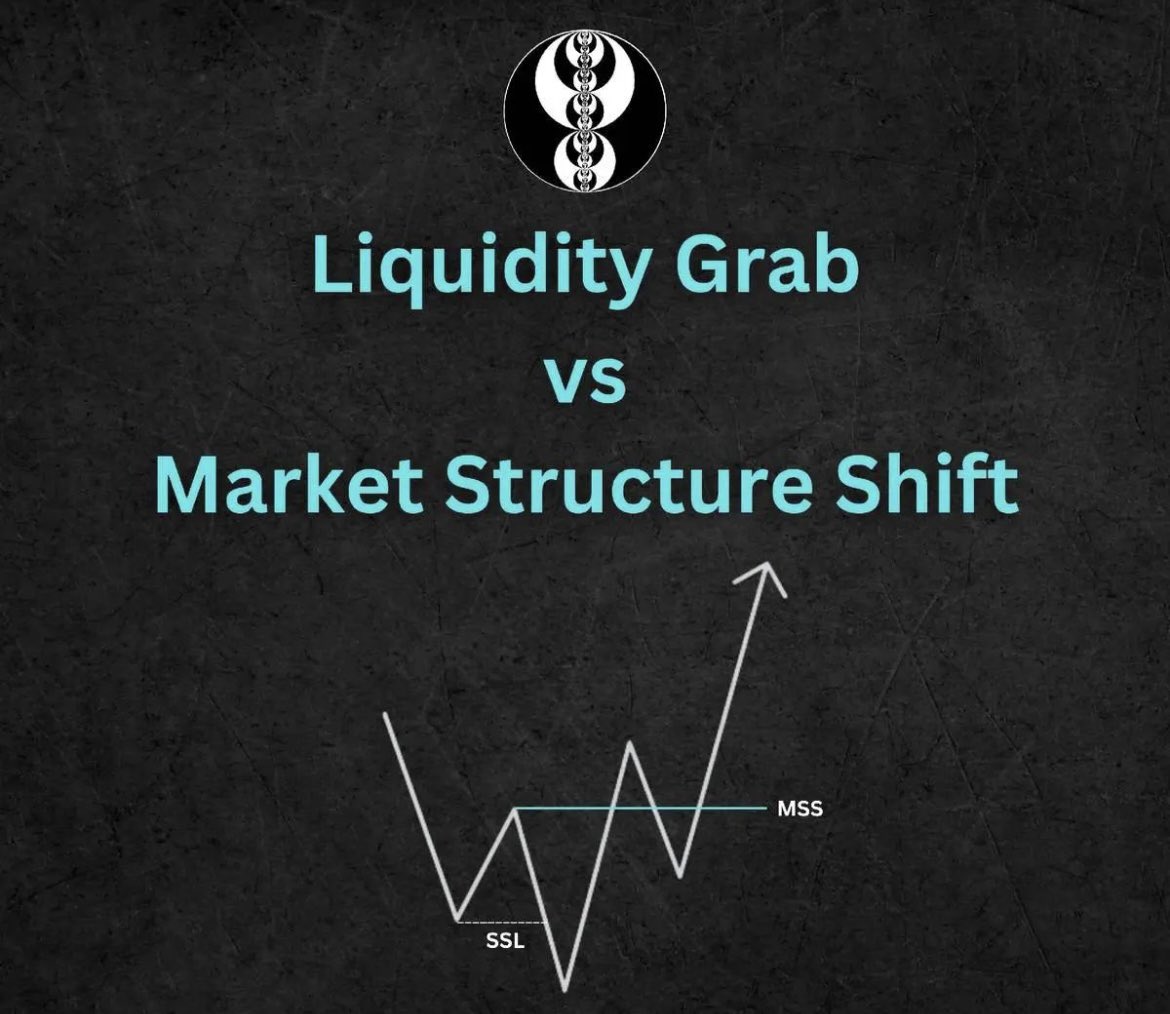
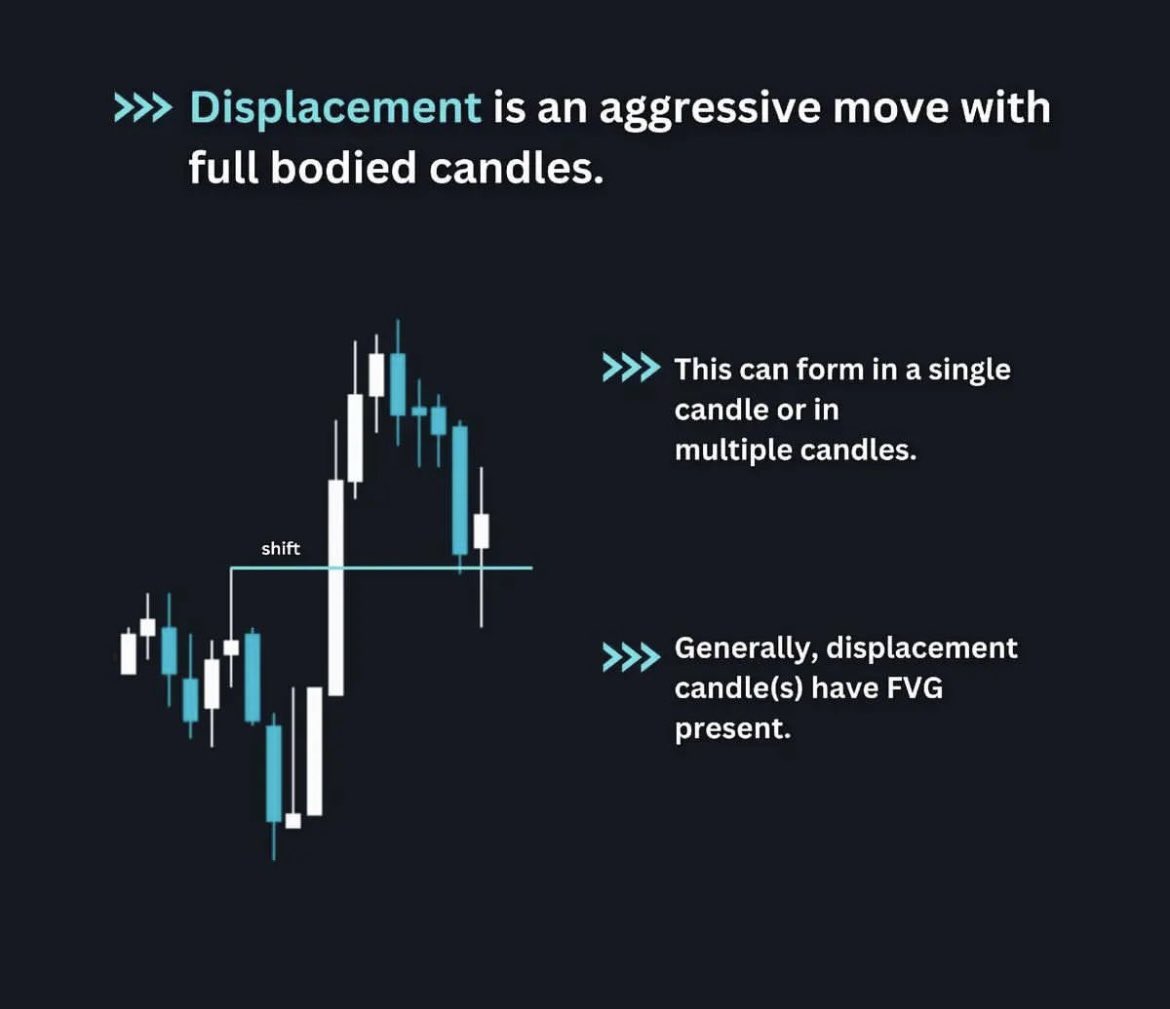
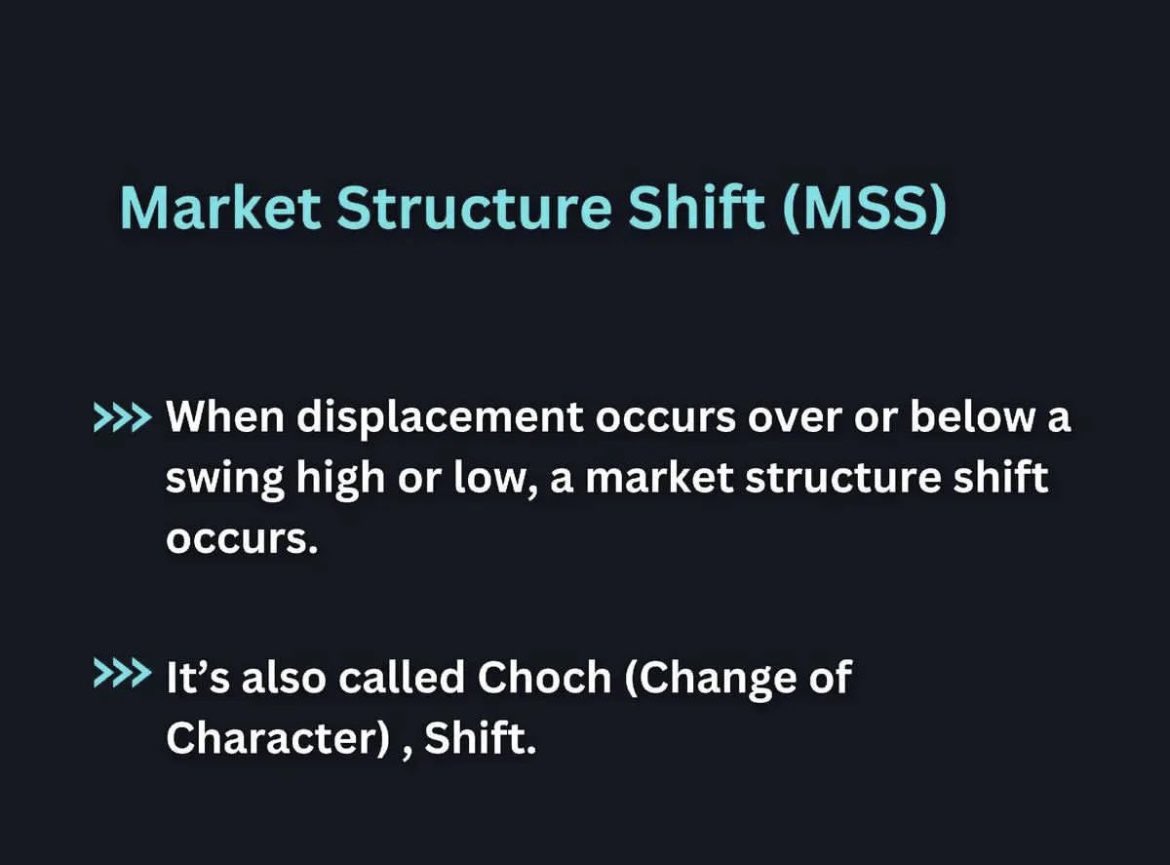
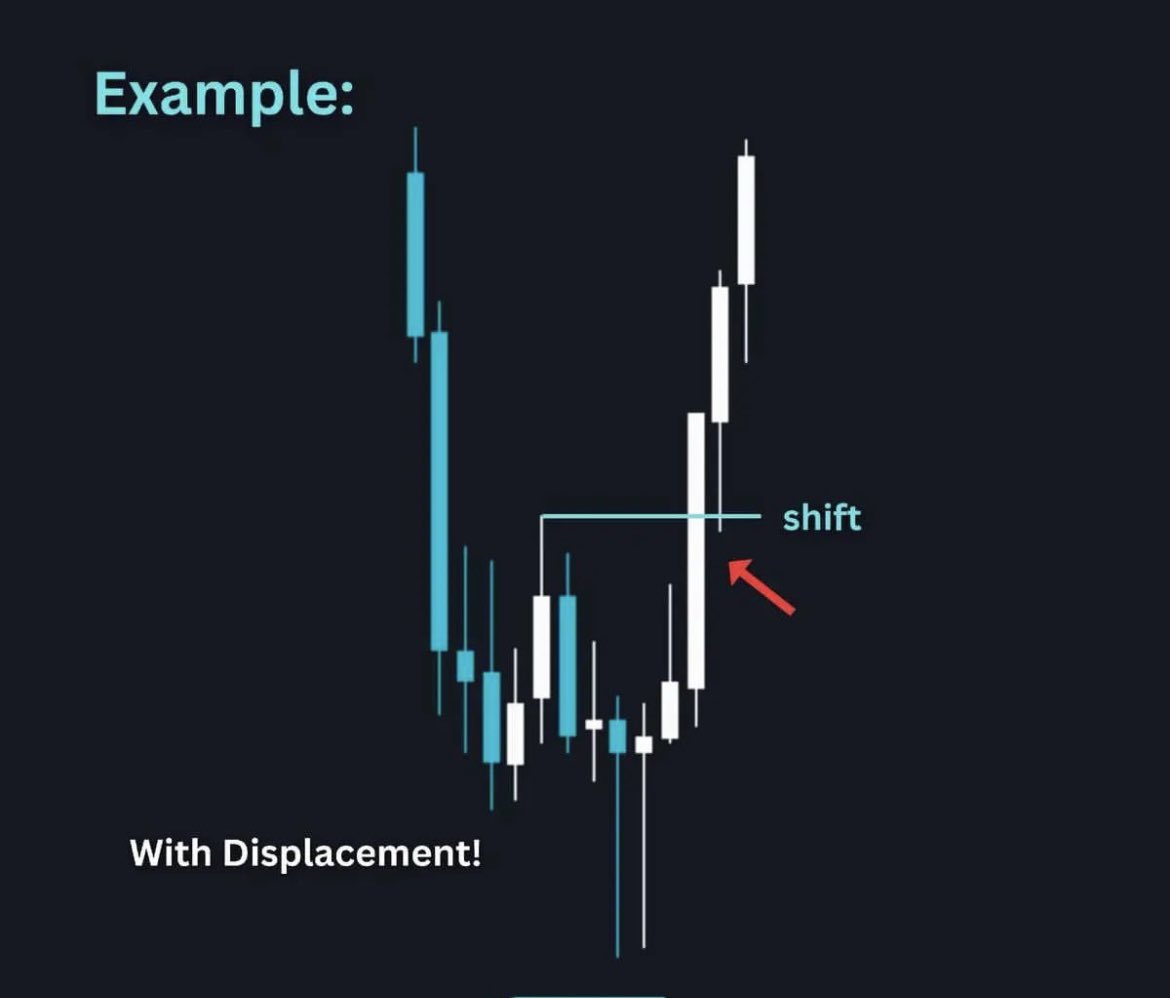
- Look for displacement and a MSS. This will give the signal for which MMXM is developing
- Then allow MS to guide your entry and exits
- HTF analysis of liquidity
- Annotate the PD Arrays inside each major swing high or low from this analysis
- Look for displacement and a MSS. This will give the signal for which MMXM is developing
- Then allow MS to guide your entry and exits
• • •
Missing some Tweet in this thread? You can try to
force a refresh