Leon Simons (looking up) Profile picture
Mar 12, 2024 8 tweets 3 min read Read on X
☀️📈BREAKING @NASA CERES🌡️📈

Why was 2023 so extreme? The data is finally in!

The world absorbed a lot more sunlight, as less was reflected.

While greenhouse gases kept most of the additional heat in.

Add El Niño and all temperature records shattered!

More 👇🧵 Image
Let's start with the sun. It's a bit brighter, as it is starting to reach the peak of its 11-year cycle.

But that doesn't explain why our planet absorbed an additional 2.3 Watts per square meter over its 510 trillion m² surface, compared to the first decade of satellite data: Image
As global temperatures increased, the amount of Outgoing Longwave Radiation (OLR) increased.

But not as much as the Absorbed Solar Radiation (ASR) increased, leading to an increased rate of global heat uptake: Earth's Energy Imblance.Image
Resulting in the most important graph in the world: Image
In 2021 @NASA and @NOAA scientists published a paper showing that the rate of global heat uptake had doubled from 2005 to 2019.

It has only increased further since.


Image
A few vocal individuals have shown scepticism over this subject in the past years, but now most seem to agree:

What causes this acceleration?

Increasing greenhouses and decreasing aerosols rapidly force our climate into a warmer state:

Broad research is ongoing to narrow this down further:


Image

• • •

Missing some Tweet in this thread? You can try to force a refresh
 

Keep Current with Leon Simons (looking up)

Leon Simons (looking up) Profile picture

Stay in touch and get notified when new unrolls are available from this author!

Read all threads

This Thread may be Removed Anytime!

PDF

Twitter may remove this content at anytime! Save it as PDF for later use!

Try unrolling a thread yourself!

how to unroll video
  1. Follow @ThreadReaderApp to mention us!

  2. From a Twitter thread mention us with a keyword "unroll"
@threadreaderapp unroll

Practice here first or read more on our help page!

More from @LeonSimons8

Apr 18
If only people understood how significant this >10% decrease in cloud cover and the same amount of increase in sunshine duration are.

It would be front page news over all Europe media.

It's not even included in many (most?) regional climate models... Image
Figuring out what underlying assumptions in models are is much harder than you'd think.

As if it's designed that way..

The Netherlands receives ~180 kW of additional sunshine for each hectare of its surface.

That the day and night, 365-day average.
Image
You can access the European cloud and sunshine data here.

The East-West difference in 2024 was quite remarkable. The extremely warm North Atlantic likely played a role.

Also see the figures for 2023, which didn't show this anomaly.
climate.copernicus.eu/esotc/2024/clo…Image
Image
Image
Image
Read 4 tweets
Mar 16
NASA: Global Sea Level Rise increased more than expected in 2024.

0.59 cm might not sound like much, but 2/3rds of that was due to thermal ocean expansion.

Which takes about 50 times more heat to increase sea levels than melting land-ice does!
1/ Image
Ice melt: ~1.5 ZJ = 1 cm
Ocean heat: ~73 ZJ = 1 cm

We can use this to get a rough indication of Earth's Energy Imbalance in 2024:

(0.59 cm * 2 / 3 * 73 ZJ) + (0.59 cm * (1 / 3) * 1.5 ZJ) = about 29 ZJ of heat to increase sea levels by 0.59 cm.

Which is +1.80 W/m² globaly!

2/ Image
This shows the acceleration of Ocean Heat Content increase from models (SSP) and observations.

The orange Hakuba et al. (2021) bar shows OHC increase determined from rising sea levels ('Geodetic').

Like NASA CERES satellite data, its best estimate is out of range of models.
3/ Image
Read 5 tweets
Feb 4
Global Warming Has Accelerated
Are the United Nations and the Public Well-Informed?
[No!]

Notes from the presentation of this groundbreaking new paper by James Hansen (@DrJamesEHansen) et al. (2025), with leading climate scientists:

🧵
1/Image
@DrJamesEHansen Global warming has accelerated, which can't be explained by natural variability Image
@DrJamesEHansen The anthropogenic forcings are greenhouse gases and aerosols.

Aerosols are likely understimated by the IPCC Image
Read 46 tweets
Jan 27
Fossil fuels contain sulphur, which is released when burned. Scientists have known about the cooling effect of sulphur for decades.

This partially hides greenhouse gas warming.

But the scale of cooling and the decoupling of CO₂ and SO₂ emissions has been underestimated Image
As more and more clean air regulations came into effect from the 1960s onward, CO₂ and sulphur dioxide (SO₂) emissions gradually decoupled.

SO₂ emissions reached a global peak around 1980:
academic.oup.com/bioscience/art…Image
@WilliamJRipple This scatter plot clearly shows the decoupling between CO₂ and SO₂: Image
Read 14 tweets
Dec 29, 2024
🌊🌡️📈
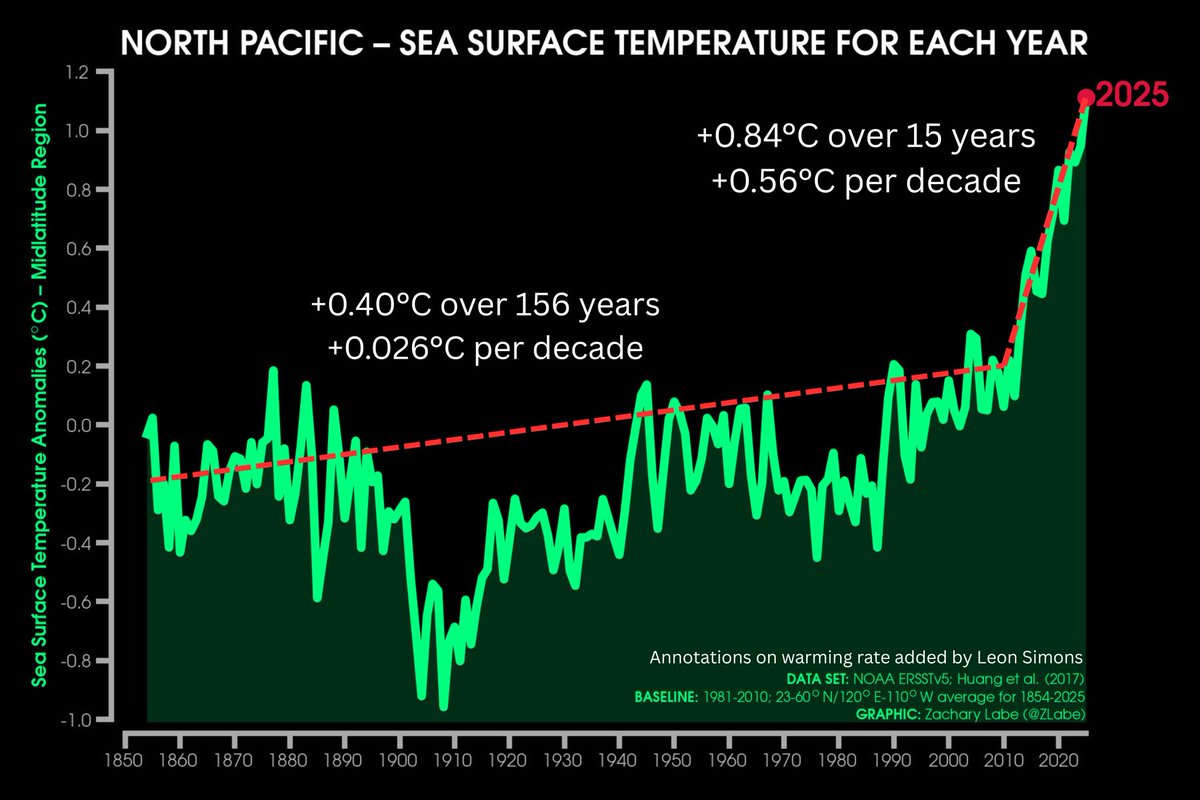
The North Atlantic Ocean is not cooling back down.

The baseline has shifted.

We'll discuss this and more later today on Climate Chat. Image
2024 even broke the extreme Sea Surface Temperature record of 2023: Image
Unprecedented: Image
Read 8 tweets
Dec 16, 2024
The Atlantic Ocean used to transport about 500,000,000 Hiroshima bombs worth of heat northward.

This will decrease by ~30% in OUR lifetimes.

What does that mean?

I think the main problem with climate change is that our tiny brains are incapable of comprehending it.
I tried to cover the basic AMOC maths here:

patreon.com/posts/10867891…
Read 4 tweets

Did Thread Reader help you today?

Support us! We are indie developers!


This site is made by just two indie developers on a laptop doing marketing, support and development! Read more about the story.

Become a Premium Member ($3/month or $30/year) and get exclusive features!

Become Premium

Don't want to be a Premium member but still want to support us?

Make a small donation by buying us coffee ($5) or help with server cost ($10)

Donate via Paypal

Or Donate anonymously using crypto!

Ethereum

0xfe58350B80634f60Fa6Dc149a72b4DFbc17D341E copy

Bitcoin

3ATGMxNzCUFzxpMCHL5sWSt4DVtS8UqXpi copy

Thank you for your support!

Follow Us!

:(