views
Leon Simons Profile picture
Mar 12 8 tweets 3 min read Read on X
☀️📈BREAKING @NASA CERES🌡️📈

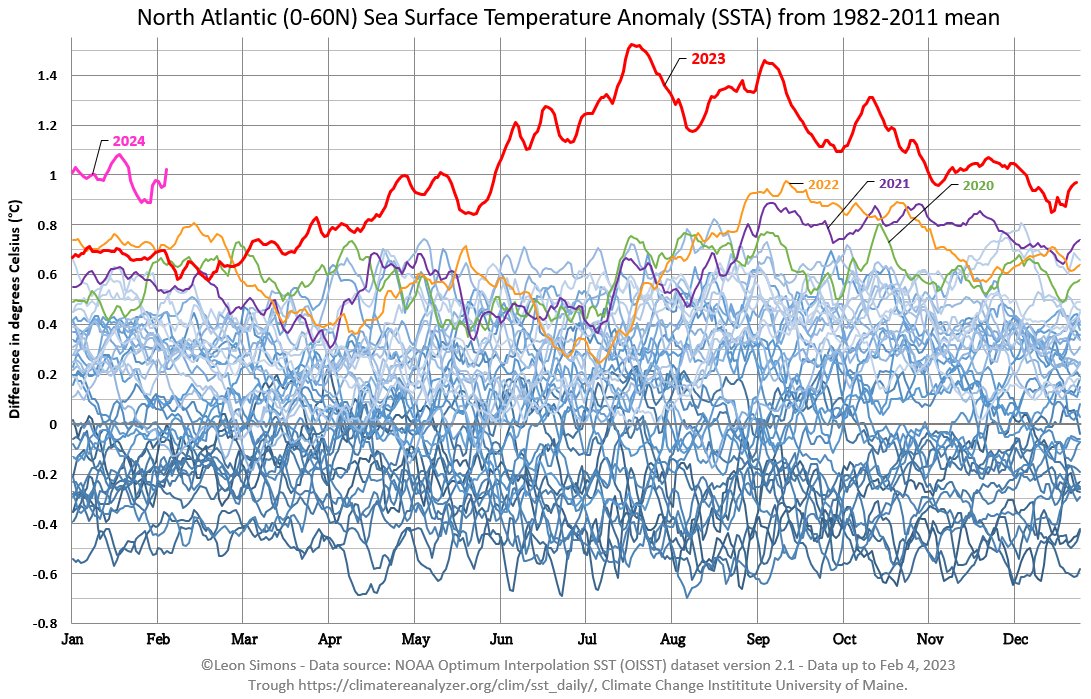
Why was 2023 so extreme? The data is finally in!

The world absorbed a lot more sunlight, as less was reflected.

While greenhouse gases kept most of the additional heat in.

Add El Niño and all temperature records shattered!

More 👇🧵 Image
Let's start with the sun. It's a bit brighter, as it is starting to reach the peak of its 11-year cycle.

But that doesn't explain why our planet absorbed an additional 2.3 Watts per square meter over its 510 trillion m² surface, compared to the first decade of satellite data: Image
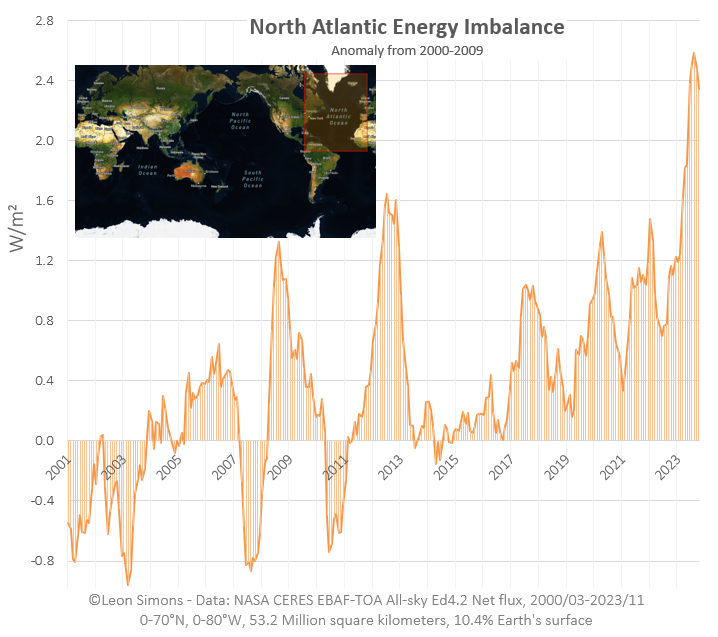
As global temperatures increased, the amount of Outgoing Longwave Radiation (OLR) increased.

But not as much as the Absorbed Solar Radiation (ASR) increased, leading to an increased rate of global heat uptake: Earth's Energy Imblance.Image
Resulting in the most important graph in the world: Image
In 2021 @NASA and @NOAA scientists published a paper showing that the rate of global heat uptake had doubled from 2005 to 2019.

It has only increased further since.


Image
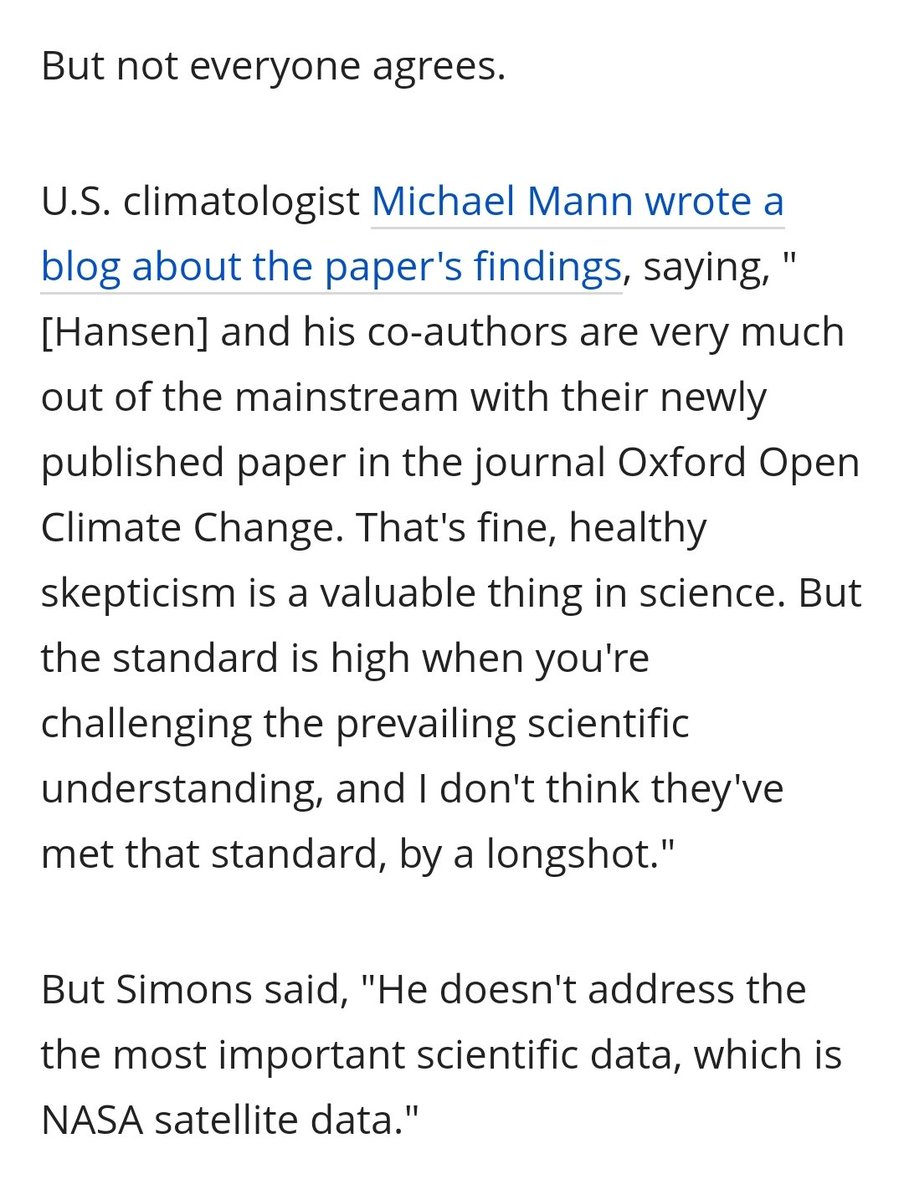
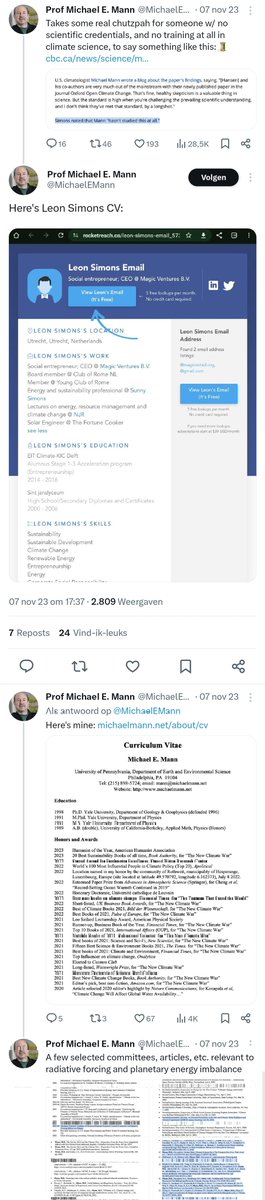
A few vocal individuals have shown scepticism over this subject in the past years, but now most seem to agree:

What causes this acceleration?

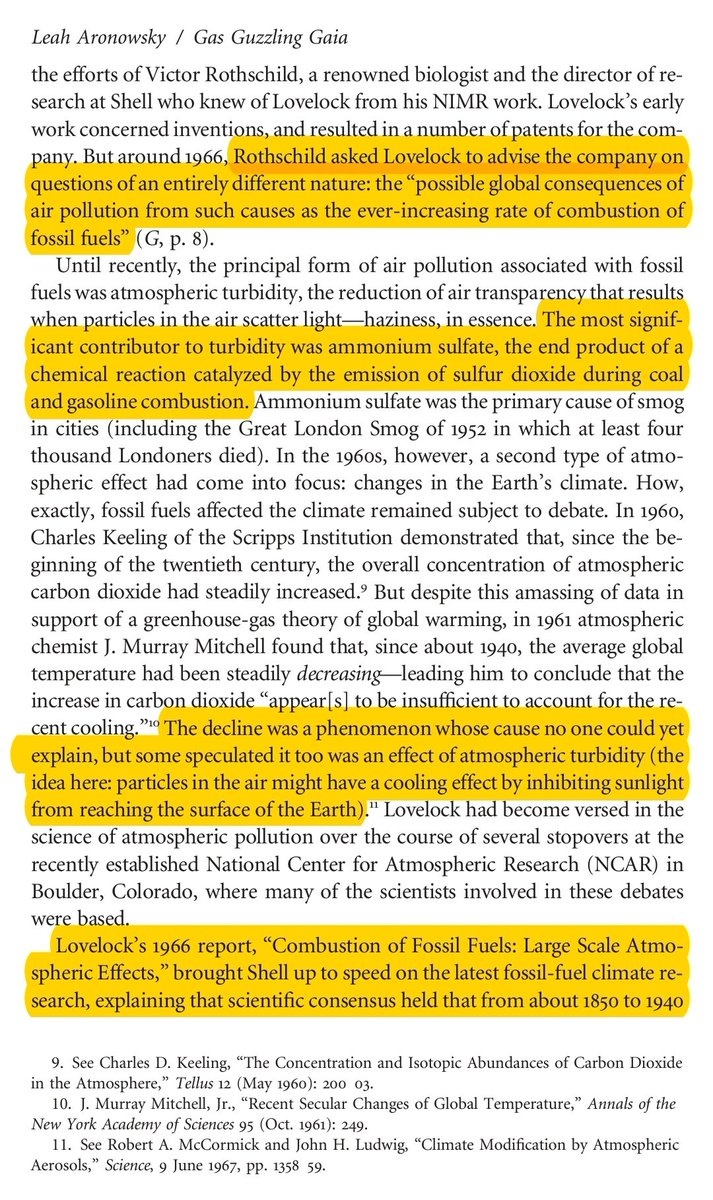
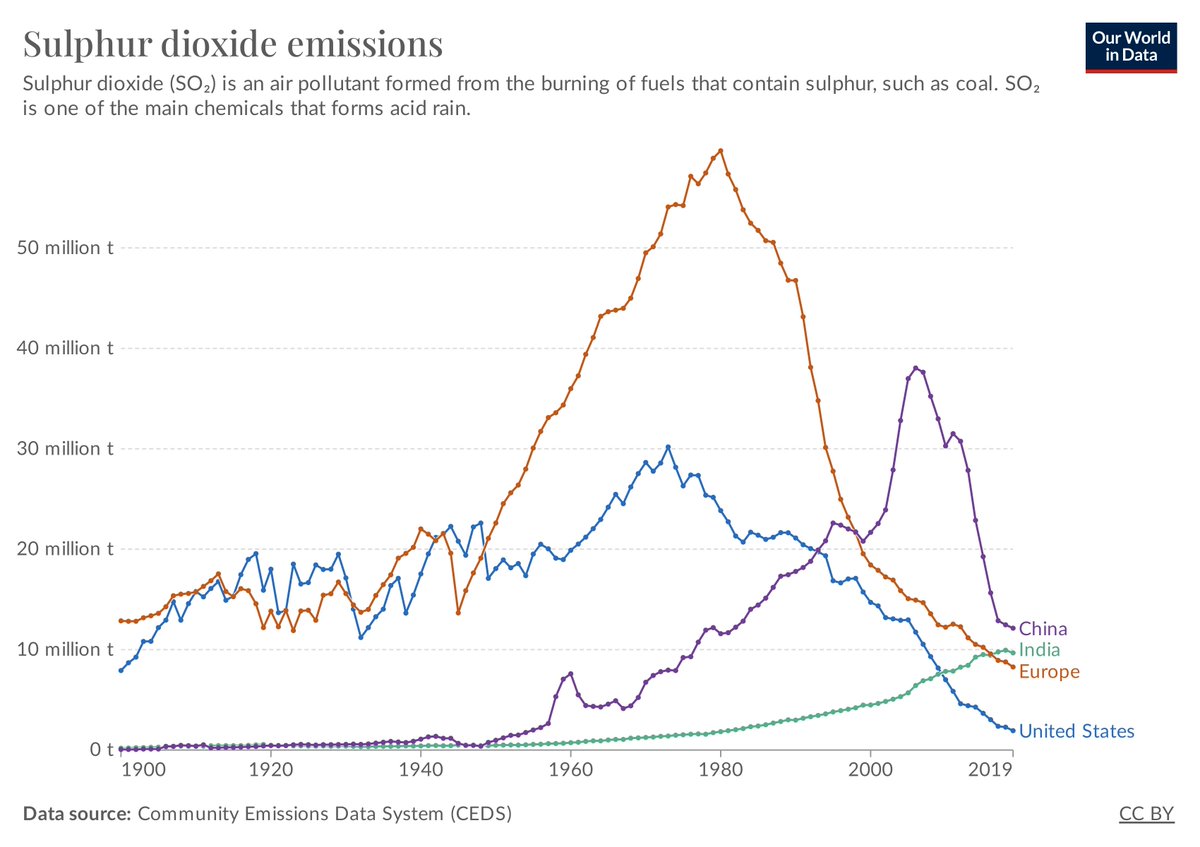
Increasing greenhouses and decreasing aerosols rapidly force our climate into a warmer state:

Broad research is ongoing to narrow this down further:


Image

• • •

Missing some Tweet in this thread? You can try to force a refresh
 

Keep Current with Leon Simons

Leon Simons Profile picture

Stay in touch and get notified when new unrolls are available from this author!

Read all threads

This Thread may be Removed Anytime!

PDF

Twitter may remove this content at anytime! Save it as PDF for later use!

Try unrolling a thread yourself!

how to unroll video
  1. Follow @ThreadReaderApp to mention us!

  2. From a Twitter thread mention us with a keyword "unroll"
@threadreaderapp unroll

Practice here first or read more on our help page!

More from @LeonSimons8

Mar 4
🌊🌡️📈

The North Atlantic Ocean reached 365 days of continuous record high temperatures!

Thank you to the journalists who have accurately reported on this!

E.g:

Scientists warn Earth warming faster than expected — due to reduction in ship pollution
cbc.ca/news/science/m…Image
After the publication of our @DrJamesEHansen et al. Pipeline paper, the person smearing our research and question my qualifications, coauthored a paper agreeing with the @NASA CERES data we presented.

Unfortunately, global warming is indeed accelerating:


Image
Image
Also see this great summary by @tomheapmedia on @SkyNews from June last year (when many still thought this temperature anomaly would soon vanish):

Read 6 tweets
Feb 13
🌎📉🌍
I did some basic energy and water calculations on the scary AMOC study (1) that's making headlines, so you don't have to.

It's quite simple, so please don't let the orders of magnitude scare you off.

This is a Big F*cking Deal (BFD)!

First, what are we talking about here?

What is the Atlantic Meridional Overturning Circulation?

It's a shitload of water transporting a shit ton of heat energy North, through the Atlantic Ocean!

The study starts with an AMOC strength of about 15 sverdrups, or 15,000,000 cubic meters of ocean water per second.

This transports about 1 PW (1 petawatt = 1*10^15 watt) of heat North from the Southern Hemisphere and the tropics.

That's about 32 ZJ (32 zettajoules = 32*10^21 joules) of heat per year.

When the AMOC tips, most of this ocean heat transport stops.

The obvious question people are asking is "could this happen any time soon and how?"

The study (as have others, for example @DrJamesEHansen et al. (2016) (2), which is not referenced for some reason) shows that a lot of fresh water input from rainfall and Greenland ice melt could shut this thing down this century.

The more fresh water is added, the slower the AMOC becomes.

The tipping in the model happens at about 0.5 sverdrups (0.5 Sv, 500,000 m³ per second) of fresh water input.

There is a lot of fresh water waiting to add those 0.5 Sv, if only there was enough heat available to melt the ice sheet of Greenland.

0.5 Sv is 1.6*10^13 m³ of water per year.

Greenland holds 2.85*10^15 m³ of ice, which could provide about 170 years of 0.5 sverdrups of fresh water (after which global sea levels would be over 7 meters higher).

To melt 0.5 sverdrups worth of ice for a year takes 5.3 ZJ of heat.

Since 1970, our greenhouse gases have caused about 450 ZJ of additional heat to accumulate in the Earth system. ~90% of that warmed the oceans.

Aerosols, notably from coal plants and ships burning sulfur rich fuels, have reduced that heat accumulation.

Now that we are reducing aerosols, more heat is accumulating.

The larger North Atlantic Ocean region shows a spike in how much sunlight is being absorbed over recent years, while higher temperatures cause more heat radiation to space.

The net effect is a spike of over 2.4 W/m² above the 2000-2009 average. This spike added 4 ZJ of heat over 12-months:

The record high global energy imbalance is now (2023) about 1.8 W/m², which adds 29 ZJ of heat to the Earth system over a year.

To make a long story short, the heat is there to melt enough Greenland ice to shut the AMOC down.

And we don't need all that heat to be directed to the melting of ice, as more precipitation also contributes.

And of course, we are only making the climate forcing and Earth's Energy Imbalance worse by rapidly increasing greenhouse gas concentrations while decreasing aerosols.

Sorry I couldn't make this more hopeful.
But numbers don't lie.

(1): Physics-based early warning signal shows that AMOC is on tipping course
René M. van Westen et al. (2024)


(2): Ice melt, sea level rise and superstorms: Evidence from paleoclimate data, climate modeling, and modern observations that 2°C global warming is dangerous
@DrJamesEHansen , @MakikoSato6 et al. (2016)
science.org/doi/10.1126/sc…
acp.copernicus.org/articles/16/37…Image
Image
Image
Image
And this older thread on the interhemispheric energy imbalance, North Atlantic Sea Surface Temperatures and Antarctic Sea Ice:

Read 10 tweets
Feb 7
🌊🌡️📈
We are now very close to the North Atlantic Sea Surface Temperature Anomaly of June 10 last year, when this graph went viral all over the world.

I guess people are already getting used to this?

Maybe we need more of those new Category 6 Hurricanes to wake people up? 🌀
Image
Until 8 months ago, the anomaly had never been this high!: Image
And I asked @EliotJacobson for a graph of the North Atlantic Sea Surface Temperatures back in May, when the anomaly peaked 0.1°C below what it is now.

What a year it's been..


Image
Read 4 tweets
Feb 5
🌊🌡️📈
The North Atlantic Ocean is heading towards a >365-day record temperature anomaly streak.

That's 40 million square kilometers of record shattering heat!

🔥It takes >3000 times as much heat to warm ocean water by 1°C than it does for the same volume of air!🔥 Image
This is not normal. Something has changed over recent years.
This is most likely it:

Here's the graph with more readable axes and the past 4 years highlighted: Image
Read 5 tweets
Jan 27
Plot twist! 🔥 🛢 ❄️

Shell asked James Lovelock not to tell the world that the emissions from burning fossil fuels were COOLING the planet..

January 27th, 1967:

'Rothschild’s response was to insist that Lovelock refrain from discussing the topic—“the weather getting colder, and the cause possibly being fossil fuel combustion products in the atmosphere”—with “non-Shell people.”'Image
Now I want to read Lovelock's report from 57 years ago:

“Combustion of Fossil Fuels: Large Scale Atmospheric Effects”

And, of course, it were the sulphur emissions causing most of the cooling.

Reference:
documentcloud.org/documents/2373…
Image
Sulphur dioxide emissions were close to record high in 1967 in both the United States and Europe, causing peak regional cooling (and health and environmental effects).

See the Community Emissions Data System (CEDS) through @OurWorldInData

ourworldindata.org/explorers/air-…
Image
Read 8 tweets
Jan 18
☀️📈
One more month of @NASA CERES data and this line keeps going through the f*cking roof!

As @DrJamesEHansen said, this is a Big F*cking Deal (BFD)!

Don't let anyone downplay its importance.

I talked about this in detail with @NJHagens here:


Image
@NASA @DrJamesEHansen @NJHagens 🌊📈
Oh, and sea level rise is accelerating: Image
🌊♨️📈
And Ocean Heat Content is increasing more and more rapidly
Image
Image
Read 6 tweets

Did Thread Reader help you today?

Support us! We are indie developers!


This site is made by just two indie developers on a laptop doing marketing, support and development! Read more about the story.

Become a Premium Member ($3/month or $30/year) and get exclusive features!

Become Premium

Don't want to be a Premium member but still want to support us?

Make a small donation by buying us coffee ($5) or help with server cost ($10)

Donate via Paypal

Or Donate anonymously using crypto!

Ethereum

0xfe58350B80634f60Fa6Dc149a72b4DFbc17D341E copy

Bitcoin

3ATGMxNzCUFzxpMCHL5sWSt4DVtS8UqXpi copy

Thank you for your support!

Follow Us!

:(