Joseph Elliott Profile picture
Mar 19, 2024 22 tweets 7 min read Read on X
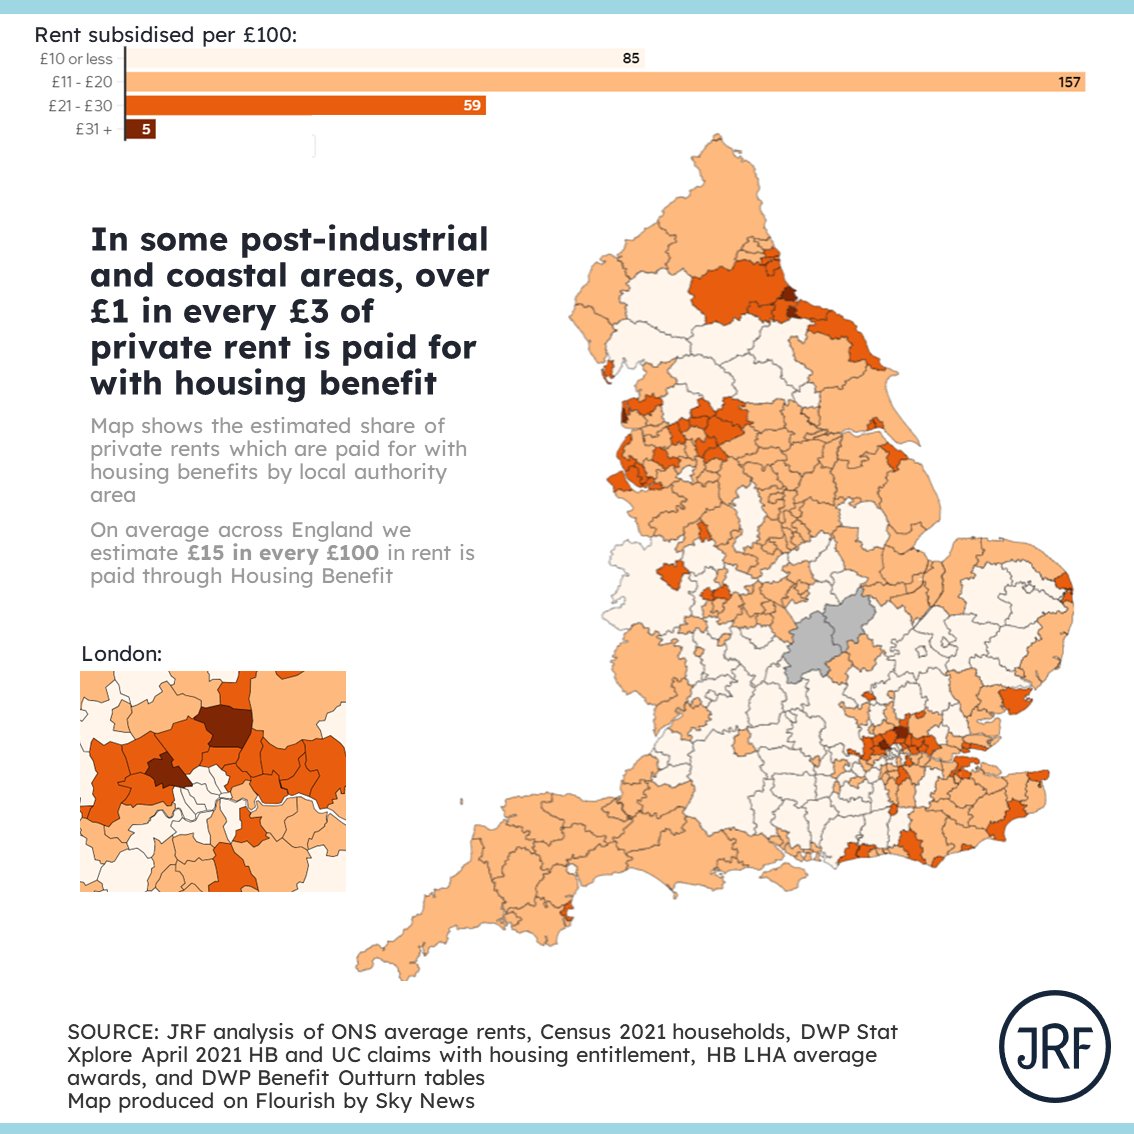
Why have British sea-fronts gone from Tourism hotspots to Housing Benefit hotspots?

Take Blackpool - along the seafront there are over 6 private rented HB claims for every 10 households (of all tenures), with over £1 in every £3 in rent paid through housing benefit.
🧵⬇️ A lower layer super output area map of Blackpool that shows that across much of Blackpool’s seafront, there are over 6 private rented sector housing benefit claims for every 10 households. This is compared to fewer than 1 in 10 on average across England.
This isn't constrained to seafronts, we also see disproportionately high private rental housing benefit claims in:

- The centres of post-industrial cities and towns Two lower layer super output area maps - one showing high concentrations of housing benefit claims on the Great Yarmouth seafront, the second showing high concentrations of housing benefit claims across Stoke-on-Trent. The title reads: There are large numbers of private rented housing benefit claims in many costal and post-industrial cities and towns across Britain
- And in the outer areas of 'core' cities, such as Manchester, Birmingham, London, Liverpool and Leeds. Two lower layer super output area maps of Manchester. The title reads: while ‘core’ cities like Manchester have a high concentration of private renters in the centre of the city, housing benefit claims in the private rented sector are more prevalent in outer areas of the city. The maps demonstrate this trend.
Across England we're handing £9bn a year in housing benefit to private landlords.

In some areas, including some seaside and post-industrial cities and towns, but also Enfield and Brent, over £1 in every £3 of rent paid is paid through HB.

So what's going on?? A local authority level map of England that shows 'rent subsidised per £100 in rent paid'; showing that in 5 local authorities over £31 in every £100 in rent paid is paid through housing benefit, £21-30 is paid if 59 local authorities, £11-20 is paid in 157 local authorities, as is £10 or less in 85 local authorities. The text on the graph reads: In some post-industrial and coastal areas, over £1 in every £3 of private rent is paid for with housing benefit. Map shows the estimated share of private rents which are paid for with housing benefits by local authority area: on average across Engl...
Across these areas and core (and other) cities generally we've seen a large growth in the share of homes and households that are private rented/ers.

Though house and rental prices between post-industrial areas and core cities tend to be on opposite ends of the spectrum.. A scatter plot that of local authorities by change in share of households that are private rented between 1981 and 2021 plotted against lower quartile house prices in 2022. The chart title reads: The (relative) growth of the private rented sector over the last few decades has been much more pronounced in coastal and post-industrial cities and towns and large cities, particularly ‘core’ cities. Although these areas are typically at the opposite ends of the house and rental price spectrum.
In costal towns and post-industrial areas high rates of HB claims are driven by strong push-pull factors:

- Weakening tourist industry in coastal areas means surplus housing, bought by landlords and rented out, with comparatively cheaper rents pulling in those on low-incomes..
Two lower layer super output area maps - showing high concentrations of housing benefit claims on the Paignton, Torquay, Grimsby and Cleethorpes seafronts.
Two lower layer super output area maps - showing high concentrations of housing benefit claims on the Hastings, Margate, Broadstairs and Ramsgate seafronts.
- In post-industrial areas, the often smaller, poorer quality and less desirable homes in town centres are acquired by private landlords  and let at lower rent levels pulling in those on low-incomes who often require housing benefit to help cover rent. Two lower layer super output area maps - showing high concentrations of housing benefit claims in Burnley, Brierfield, Nelson, Barrowford, Colne and Luton. The title reads: There are large numbers of private rented housing benefit claims in many post-industrial cities and towns across Britain.
- But at the same time people on low-incomes are pushed away from more desirable and less affordable areas - including cities, where there is a higher demand for homes, and the shortage of homes (and - for these groups - shortage of social housing) is sharpest.
A scatterplot of local authorities showing z-scores of rent-to-earnings ratios and z-scores of difference between average social and private rents. The title reads: Private rents are more affordable relative to local earnings and private rents are much closer to social rents in post-industrial and coastal cities and towns. The graph shows privates rents relative to earnings and relative to social rents are substantially higher in 'core' cities.
Graph sowing there tends to be a greater concentration of private renters in receipt of housing benefits in areas where rents are lower.
- But these coastal cities and post-industrial towns have much weaker labour markets, fewer jobs and much lower average wages - meaning many are unemployed or are 'economically inactive' A scatterplot of local authorities showing z-scores of inactivity and unemployment rates for household heads, and the same but only for private renters. The title reads: There are higher rates of unemployment and economic ‘inactivity’ in coastal and post-industrial towns and cities, and specifically among private renters.
In core cities, the trend is reversed; with large numbers of typically younger adults renting typically smaller homes in more central parts of cities, often sharing - closer to jobs, amenities, etc. A lower layer super output area map of London. The title reads: While the centre of London and other ‘core’ British cities tend to have very high concentrations of private rented homes and private renters…
And a 'ring' of housing benefits claims for private renters encircles the cities, with lower-income households pushed to the less unaffordable outer areas of these large cities - a phenomenon described by some academics as the 'suburbanisation' of poverty. A lower layer super output area map of London. The title reads: Private renters in receipt of housing benefit tend to be pushed to outer areas of cities that are less unaffordable, often further from workplaces and of poorer quality.
High rents in often more desirable city centres price out the lower income families, and push them to outer areas of these larger cities, a trend seen in Birmingham, Manchester, Liverpool, Bristol, among others. Two lower layer super output area maps of Birmingham. The title reads: There are many private renters living in the centre of Birmingham, but housing benefit claims in the private rented sector are more prevalent in outer areas of the city. The maps demonstrate this trend.
The trend is much less prevalent among other cities (University, Historic or Commuter) cities including York, Canterbury and Cambridge.

It's likely the sheer scarcity of homes means many low-income families who would like to live in these areas are simply priced out. Two lower layer super output area maps - one of York, one of Cambridge. The title reads: Other UK cities – historic, University and commuter cities – tend to have much lower numbers of private rented housing benefit claimants. This likely reflects the scarcity of housing in these areas, with families on lower incomes being priced out. The maps demonstrate this trend.
What's the upshot?

A very extractivist model of private landlordism has become increasingly prevalent across Britain in the last few decades.

The sector has expanded rapidly, and particularly in coastal and post-industrial towns / cities and other cities.
Too often it sucks up too much of low-income families earnings and public subsidy through housing benefit.

In return, low-income renters are stuck in often inadequate, poor quality homes - sometimes in dangerous condition.
In a report we've published today - we argue for intervention to take this on.

Step one needs to be higher standard and enforcement of standards in the Private Rented Sector

With greater protections for tenants - through the Renters Reform Bill
- We also desperately need to see an shift in gear in the development of homes - with more homes, particularly social homes, built. We particularly need to see these in places where there are job opportunities.
In our report we also argue for some homes to be brought into social ownership to make temporary accommodation cheaper, to drive up housing standards in lower-cost areas, including by growing the community rental sector.
We also want to see reform of Right to Buy - so that discounts are baked in and kept in the system, discounts are capped at 30%, and allowing councils to keep 100% of receipts.
Read more in our new @JRF_UK report from @DarrenBaxter with analysis from me:

jrf.org.uk/housing/bringi…
Coverage from @FionaMackieSky @joelysantacruz @DanielJDunford and @NickMartinSKY from @SkyNews for covering the report here:

news.sky.com/story/the-seas…
One final bonus distribution graph of HB claims to households ratio across LSOAs. A distribution graph showing the numbers of lower layer super output areas by the ratio of private rented sector housing benefit claims to every 100 households. 2% of LSOA areas have a ratio of > 30:100, 4% 20-30:100, 17% 10-20:100, 33% 5-10:100, AND 44% 0-5:100.

• • •

Missing some Tweet in this thread? You can try to force a refresh
 

Keep Current with Joseph Elliott

Joseph Elliott Profile picture

Stay in touch and get notified when new unrolls are available from this author!

Read all threads

This Thread may be Removed Anytime!

PDF

Twitter may remove this content at anytime! Save it as PDF for later use!

Try unrolling a thread yourself!

how to unroll video
  1. Follow @ThreadReaderApp to mention us!

  2. From a Twitter thread mention us with a keyword "unroll"
@threadreaderapp unroll

Practice here first or read more on our help page!

More from @J_Elliott94

Jul 23, 2024
National Audit Office report published today concludes homelessness in England at its highest level recorded (since 2000).

Identifies risk that expenditure on homelessness and temporary accommodation (TA) may bankrupt councils, as some spend up to half their net budgets on TA. Variation in temporary accommodation levels by local authority in England The use of temporary accommodation is particularly significant in London and parts of the South East  Notes 1 Data on the number of households in temporary accommodation are taken from the Department for Levelling Up, Housing & Communities’ (DLUHC’s) Homelessness Case Level Information Collection (H-CLIC), which captures detailed information on households as they progress through the different stages of the statutory homelessness system. 2 Data on the number of households in temporary accommodation are from Quarter 3,...
And as above map shows - a much higher share of households are housed in temporary accommodation across certain types of geography, typically larger cities and costal cities in particular.
It recognises the previous Government had no strategy or public targets for reducing statutory homelessness (in England).

Looking to the past we can see that with concerted effort can substantially reduce homelessness; we need a revival of this ambition. Figure 4 The number of households in temporary accommodation, Quarter 4, 2001-02 to Quarter 3, 2023-24 In Quarter 3, 2023-24, there were 112,660 households in temporary accommodation, which is the highest total across the whole period
Read 10 tweets
Jul 14, 2023
Almost half a million homes in England are second homes owned by households in England - one home in every fifty.

The number owned as second homes has doubled since 2008-09, according to new data from Government⬇️ Almost half a million homes in England are second homes owned by households in England - one in every fifty. This has doubled since 2008-09.
Primarily second homes are used as holiday homes or seen as a long-term investment.

Over half of households who have access to a second home live in London and the South East of England.

58% were aged over 55, and almost half (46%) were in the highest income quintile.
Most households have a second home to use as a holiday home and/or for investment.
Most households that have access to a second home are located in the South East or London
Census data shows us that in 2021 there were 1.5m unoccupied dwellings (which includes second residences, holiday homes, vacant homes and short-term residencies)

ONS maps show the geography of unoccupied dwellings. (Important to flag covid-caveats here) Map from ONS showing the geography of unoccupied homes
Read 9 tweets
Feb 28, 2023
You might think benefit levels are based on a logical, objective calculation of the cost of what families need.

You would be wrong - this has never been the case.

Rates are essentially arbitrarily set* and have been eroding in value (including relative to earnings as per graph) Historical value of Universal Credit's standard allowance (a
*Current benefit levels are the result of a historical sequence of successive rate changes, each based on a range of considerations (previous years rate, inflation, welfare reforms, political assessment of affordability) - but never an objective measure based on need.
In fact, when we fall out of work for whatever reason - our benefits system is much less generous in substituting and supporting our income relative to avg. earnings than in other OECD countries! Graph showing the 'replacement rate' for workers on average
Read 9 tweets
Jan 20, 2023
£10 billion would buy all 42,000 homes in Rishi Sunak's constituency of Richmond.

The Government spends twice that amount on housing benefit each year - around half to private landlords.

And we argue Govt should spend even more on HB.. At least in the short term. ⬇️
We have a rental affordability crisis in the England (and across the UK).

Recent ONS stats show the largest EVER year-on-year private rental growth on record to December 2022 (series starts 2006).

The share of incomes private renters spend on rents has tripled since 1979. Time series line-graph entitled ‘Out-of-pocket costs of re
Around a third of private renters are in poverty - and around half of these are in poverty only after housing costs are factored in.

Our recent survey found 85% of low income private renters had gone without an essential in the last 6 months (Earwaker, 2022 ⬇️). Graph entitled 'whether or not you have housing costs is a k
Read 11 tweets
Jan 19, 2023
Why aren’t they getting it?

Our social safety net is there for those unable to work or who fall out of work, and boosts income of those on the lowest earnings.

So why are as many as 41% of working-age adults (2.7m) on the lowest income (bottom 20%) not receiving any support?🧵 Stacked bar graph which shows 41% of working-age adults in t
Universal Credit and its predecessors (JSA, tax credits) are passporting benefits that grant access to cost-of-living support payments.

It's important people are in receipt of the benefits they're entitled to, to ensure they also receive these vital support packages.
Our new analysis in a briefing by @KatieSchmuecker finds that as many as 41% of low-income (bottom 20% of household incomes) working-age adults, 2.7m people, aren’t receiving means-tested benefits. A tree-map graph demonstrating that 18% of working-aged peop
Read 14 tweets
Jan 18, 2023
Is the Housing Benefit bill out of control? In 1979 we spent £2.5bn on HB (2019 prices), today we spend £21bn.

Yet new research published today finds that, relative total 'housing costs', the value of all rental subsidies are much lower today than in the past.🧵⬇️ A stacked area timeseries e...
There's a consensus that we have a rental affordability crisis, with rents swallowing up 3x more of renters income than it did in 1979.

New research from @InstituteGC for JRF concludes the erosion of housing subsidies over four decades has been a critical driver of this crisis.
A thread of some of the analysis from authors @ianmulheirn @JamesBrowneRTC and Christos Tsoukalis in the new report we've published today.
Read 17 tweets

Did Thread Reader help you today?

Support us! We are indie developers!


This site is made by just two indie developers on a laptop doing marketing, support and development! Read more about the story.

Become a Premium Member ($3/month or $30/year) and get exclusive features!

Become Premium

Don't want to be a Premium member but still want to support us?

Make a small donation by buying us coffee ($5) or help with server cost ($10)

Donate via Paypal

Or Donate anonymously using crypto!

Ethereum

0xfe58350B80634f60Fa6Dc149a72b4DFbc17D341E copy

Bitcoin

3ATGMxNzCUFzxpMCHL5sWSt4DVtS8UqXpi copy

Thank you for your support!

Follow Us!

:(