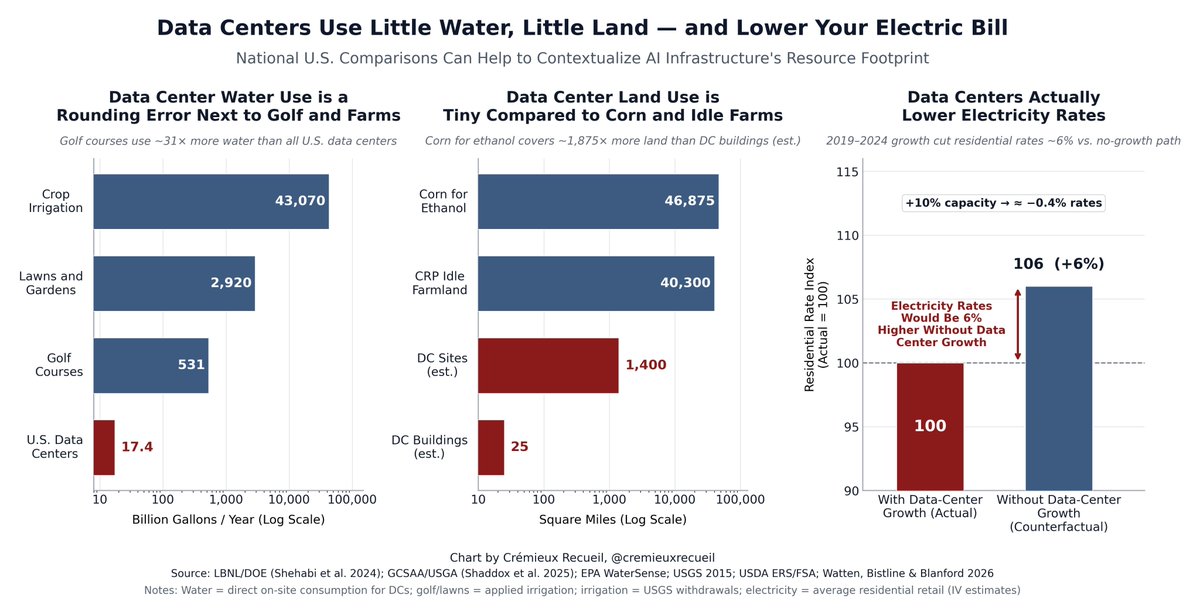
The American nuclear industry illustrates negative learning: the costs of plants have increased over time.
But this is not nuclear's fault. Almost everywhere else, the learning rate is positive: costs decline as the industry gains experience building!
🧵
Consider France:
The U.S. has really only been experiencing cost overruns since the Three Mile Island incident, and the reason has to do with the industry becoming overregulated as a result of the public outcry that ensued.
In general, nuclear cost overruns are driven by indirect costs, like having to hire more safety professionals due to added regulatory burdens.
Those explain 72% of the price hike in the U.S., 1976-87:
In a more recent OECD report on nuclear from 2020, it was noted that "indirect cost[s] are the main driver of these cost overruns" and 80% of those indirect costs are attributable to largely unnecessary labor.
The regulatory costs levied against nuclear are so extreme that they can make components cost 50 times what they should, like in the case of 75 mm stainless steel gate valves.
The main factor differentiating nuclear and industrial grade? Unnecessary quality certification.
The question is less "Why is nuclear expensive?" and more "Why is nuclear overregulated?"
And the reason isn't clear-cut. It's obvious it's not so simple as saying "ALARA!", since many countries manage positive learning despite sticking to the same philosophy.
It's more likely a combination of factors involving activism
Thanks to activism, the U.S. nuclear fleet won't achieve French emission levels because, under the Carter administration, activists managed to get reprocessing banned, tarring nuclear's reputation via the 'waste' issue
In any case, nuclear remains a viable option for cleanly powering the future, and continued research into it is necessary for taking us into the stars.
Moreover, for consumers, it remains beneficial ($!) so long as intermittent forms of generation are, well, intermittent.
There's more that can be said, but I'll cut it off there
Sources:
To read way more on this, check out this IFP piece:
0. The sample for the population result is *everyone* with ≥1/16 and ≤15/16 African admixture, the within-family result is for the siblings among them. I didn't plot between-families results, but they're pulled from the same distribution as the population result, so when I have those computed I'll replot, but they shouldn't be any different (will take a few hours, maybe be tomorrow, w/e).
1. Yes, datasets will be merged and sharper results will be obtained for the article on this that's coming out ~shortly. Can't be done for all phenotypes in the UKBB, but can be done for IQ at least. For example, we don't have lipoprotein(a) (lp(a)) measurements in some of the samples of young American kids, some of them don't have objective skin color measurements, etc. As a side note, this result holds up with brain size (not shown) in the UKBB, but I'm unsure if it holds up in the young samples that'll be merged with it, as they're still developing in most cases.
Anyway, the IQ p-value is p = 0.008 (two-tailed) within families and extremely low between them. The within-family result is robust, will get sharper with more data, and is also sharpened by using a latent variable instead of a score, and by correcting for measurement error (not needed with the LVM). Score shown for simplicity and ease of others with UKBB access replicating this. Also, accounting for error in the admixture computation, the p-value would drop a bit further, but not by very much since error is very small.
2. The "IQ per unit of admixture" is statistically indistinguishable between the population and within-family results, and yes, it explains most of the Black-White difference in IQ. I just wanted comparably-scaled results for all the traits here, so you're seeing r's. It's pleasant that the within-family variance reductions aren't enormous for siblings, which is what we expect even with quite high heritabilities given their genetic relatedness. It's the same result we've seen with American data, and it's also nice to see that in the case of this trait, the global admixture result *can* be interpreted like the within-family one. Presumably this only holds with measurement invariance, as we see in the U.K. when comparing Whites and Blacks there. Since we see this in the U.S. too, it's likely that the previous, already-published within-family null—which had a sizable effect in the correct direction which also could not be distinguished from the global r—was just a false-negative.
3. This result replicates with other degrees of relatedness, but we might lose the causal interpretation with those ones because the estimand for, say, a cousin test is different given the identity of the "C" variance component shifts for that comparison.
4. What is architectural sparsity and why is it relevant? Consider this table from nature.com/articles/s4159… (cc: @hsu_steve):
Basically, sparsity refers to the number of variants involved in a trait. It also refers to their effect size distribution. So, for Alzheimer's, for example, the trait is highly polygenic, but APOE explains more variance than the entire rest of the PGS, so while being under highly polygenic control, it remains moderately sparse.
If you're still not grokking what I mean here, consider some distributions of cumulative effects across the chromosomes. Here's the result for lp(a), which is already known to be influenced by essentially one gene. Guess which chromosome it's located on:
Consider, as a comparison, creatinine, which is considerably less sparse, and thus has effects distributed across all chromosomes:
Now, consider what this does to within-family admixture assessments. Skin color, for example, is controlled by only a handful of genes. This means that global admixture shouldn't tag it very much between siblings. The same is even more true for lp(a). And in fact, now we have confirmation of this!
But, we know from other methods that lp(a) is effectively entirely genetically-caused between populations. This is just accepted within the medical community because it is an obvious fact that follows from its strong control by a single gene. You can also figure this out using local ancestry estimates. Basically, the correlation between genome-wide ancestry and ancestry at a causal loci is what we want to get at, and if you know the causal loci, you gain power by restricting your analysis to that area. This is what we find with lp(a) (not shown, but use your brain. The obviousness of this fact is why the author used lp(a) as an example).
Also, in some sense, the frequency of that locus between ancestries gives you what you need without doing all this within-family stuff, if you're confident it's causal. The effect estimate might still be biased by population structure though, so that's worth keeping in mind.
There will be a post soon with more details and the expanded set of results with the additional datasets, robustness tests, and plenty of other fun things to look at.
TL;DR: this is a spoiler, and it shows that, yes, you can explain the Black-White IQ difference in Britain mostly genetically, and the global admixture result that I've posted here before is equivalent to the within-family one. Woohoo for things that should hold up, in fact, holding up!
As a sort of replication of the Young paper, you cannot explain the difference in educational attainment (as years of education) in this way. Why? Well, hard to say. Compensatory factors like I found with the GCSEs? (Haven't read that post yet? Go check it out here: cremieux.xyz/p/explaining-a…). Poor phenotype quality? Very plausible, because education really is a huge garbage heap, but why would that be in the general population and not within families? Maybe it has to do with what other traits admixture tags? Maybe it does replicate, but we just can't see it, because the precision is too poor (possibly the lp(a) story too). Who knows!
Q: Will the combination with more datasets allow us to fix this educational attainment result?
A: No, because most of the other datasets involve young people, not people who have almost all completed their educations, as in the UKBB. That plus the generational change and international incomparability in the definition of educational attainment makes it too poor as a phenotype. Sorry!
Any questions?
Link to a fun previous post from the same dataset, showing a result that *does* hold up within families: x.com/cremieuxrecuei…
Link to another post mentioning the forthcoming article earlier: x.com/cremieuxrecuei…
I want to ping an old post that I've also posted some replications for.
Basically, parents are inequality averse, and they try to compensate for when one sibling is less gifted than another, reducing the ancestry/PGS effect on education within families.
Ever wondered why advertisements heavily feature Black actors when they're just 12-14% of the population?
I might have an explanation:
Black viewers have a strong preference for seeing other Blacks in media, whereas Whites have no racial preferences.
These results are derived from a meta-analysis of 57 pre-2000 and 112 post-2000 effect sizes for Blacks alongside 76 and 87 such effect sizes for Whites.
If you look at them, you'll notice that Whites' initial, slight preference declined and maybe reversed.
It's worth asking if this is explained by publication bias.
It's not!
Neither aggregately (as pictured), nor with results separated by race.
You're on trial, and the jury can't make up their minds. The decision is a coin flip: 50/50, you either get it or you don't.
Your odds of a given verdict depend on the "peers" making up your jury.
If you're Black and they're Black, your odds are good; if you're White, pray.
Though White jurors have, on average, no racial bias, the same can't be said for Black jurors.
Where the White jury gives you approximately the coin flip you deserve, the Black jury's odds for a verdict are like a coin rigged to come up heads 62% of the time.
Once you get to sentencing, things get even worse.
The White jury is still giving you a coin flip on a lighter or a harsher sentence, but the Black jury is giving lenient sentences to Blacks about 70% of the time.
Posts saying Charlie said things he didn't, oftentimes even including videos where he doesn't say what the post says he does, have convinced me.
There will be no organic temperature-lowering coming from the left, because they don't want it.
They believe the things they claim.
They actually believe the people they dislike *are* racists, fascists, homophobes, transphobes, all of it.
They are not reasonable, and they cannot form anything like a reasoned argument for these perceptions.
Even still, it's really what they think.
Accordingly, they will not lower the temperature.
You can't expect people to stop using slurs like "fascist" or "racist" or "sexist"—even if they are completely untrue and it's impossible to provide valid evidence for them!—if they believe they're true.
It shows that the gender wage gap is mostly about married men and their exceptional earnings.
In this thread, I'm going to explain why married men earn so much more than everyone else🧵
The question is:
Does marriage maketh man?
Or
Are all the good men married?
That is, does marriage lead men to earn more, or do men who earn more get married more often?
To answer this question, we have to work through the predictions of different theories.
For example, one of my favorite papers on the subject looked into three different hypotheses to explain the "marriage premium" to wages, and they laid out a few testable predictions: