#Bitcoin is facing some macro headwinds, with several indicators in my macro state regime model turning negative in recent weeks. However, the longer term liquidity cycle remains extremely favorable for $BTC and #crypto in general.
Lets dive in 🧵
Lets dive in 🧵

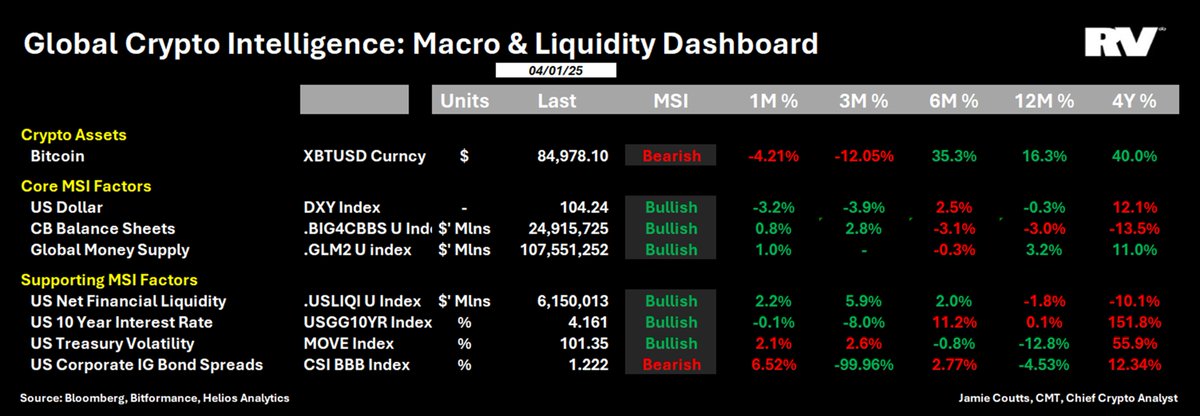
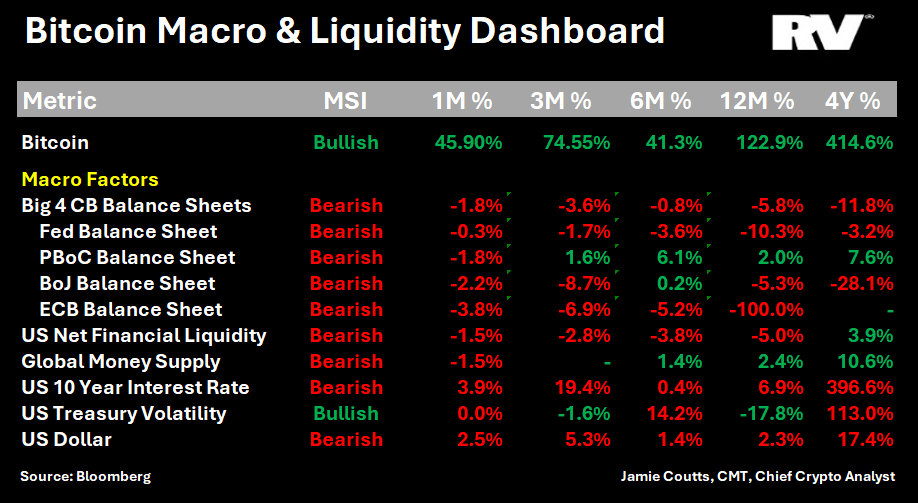
Over the past several weeks, most of the macro/ liquidity-related factors relevant to the Bitcoin price have turned lower.
Some of these factors are more important than others.
Some of these factors are more important than others.

From my backtesting and analysis, the big 3 to watch are CB balance sheets, the global money supply, and the dollar. My momentum models are generally medium term (several months) vs long term (12-mths+).
While there are instances when $BTC goes up when these factors are bearish, over most timeframes, negative returns are associated with periods when these factors are bearish.
While there are instances when $BTC goes up when these factors are bearish, over most timeframes, negative returns are associated with periods when these factors are bearish.

Let's first look at CB Balance sheets. Here I am tracking the big 4 (Fed, PBoC, BOJ, ECB). Despite the 2H easing that came from the PBoC, CBs are still tightening. After being in a bullish regime earlier in the year, it turned bearish in Feb.

That happened just after the ETFs launched, so it was hardly noticed. $BTC rallied 40% during this time. The only other time price moved this favorably when the CB balance sheet regime was Bearish was the 2019 $3k to $14k rally. 

However, on average, when the CB balsheet indicator is bearish, it produces negative returns for BTC.
Below is a strategy that goes long BTC when the regime is bullish. It has outperformed BTC on a risk adjusted basis since 2013 (not % rtns).
Since 2018 it has beaten the % rtns (at the cost of a lower Sharpe).
Below is a strategy that goes long BTC when the regime is bullish. It has outperformed BTC on a risk adjusted basis since 2013 (not % rtns).
Since 2018 it has beaten the % rtns (at the cost of a lower Sharpe).

Next is Global money supply (GLM2). At around $103T it appeared poised to break above the resistance set since 2020/21 liquidity avalanche. But in the past week it has rolled over into a bearish regime.

A BTC long only strategy when GLM2 is in a bullish regime produced 5x the % rtns of BTC since 2018. It is the best performing of the 3 across most metrics eg. Sharpe, Profit factor etc. It also, on average, generates negative rtns when the regime is bearish. 

Because the prev 2 have a low volatility profile, the US dollar (DXY) provides a nice compliment to the suite as the signals are less correlated and more frequent (I should smooth some parameters to lower the noise).
In any case, with Bitcoin becoming more correlated with the dollar, the signal has improved overt time.
The recent bounce from 101 has pushed the dollar into a bearish regime.
In any case, with Bitcoin becoming more correlated with the dollar, the signal has improved overt time.
The recent bounce from 101 has pushed the dollar into a bearish regime.

Since 2013, none of these macro indicators have outperformed % rtns of HODLing $BTC. Important to note. For the long term investor, this is the proven strategy.
However, since 2018 as bitcoin becomes more plugged into the financial plumbing, these regime strategies have beaten the % rtns of BTC (but not on a risk-adj basis).
However, since 2018 as bitcoin becomes more plugged into the financial plumbing, these regime strategies have beaten the % rtns of BTC (but not on a risk-adj basis).

Now that we understand the present, lets zoom out and consider where we are in the longer-term multi-year liquidity cycle. The 12mth RoC for Global money supply has been a prescient indicator for Bitcoin/risk asset cycles. It was what prompted my BTC bottom call in Dec-22. 

As we know, Global M2 has stalled, and momentum is rolling over. This has happened before, back in 2016. 

So while I expect BTC and #crypto to struggle until these macro indicators reverse, I remain Bullish on these assets over the next 12-24mths and even longer from an asset allocation perspective.
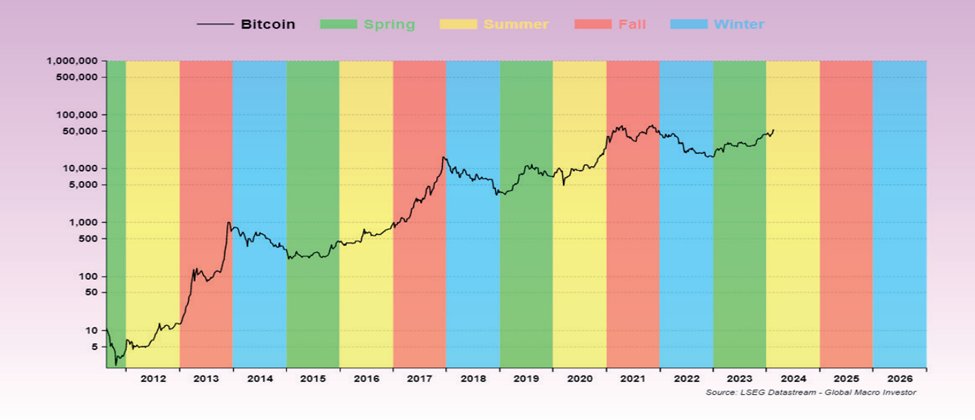
Borrowing from @RaoulGMI @BittelJulien amazing cycle analysis, we are able to observe that we are in what has been traditionally a sweet spot for Bitcoin and crypto.
Borrowing from @RaoulGMI @BittelJulien amazing cycle analysis, we are able to observe that we are in what has been traditionally a sweet spot for Bitcoin and crypto.

Weakness should provide an opportunity to buy the high quality crypto assets at lower levels for the next and most likely the final leg of the current cycle into 2025.
If there was one indicator to watch to see if this thesis is playing out accordingly, or not, I think it would be the dollar. Every $BTC summer rally has been precipitated by a stronger dollar, which peaks and rolls over, which as it cascades lower, sends BTC skyrocketing. 

Currently, the DXY is trapped in a narrow consolidation range. A break above 107-108 would put serious pressure on all risk assets.
A break below 101 should see a move to the low 90s which if that were to occur would likely send BTC to $150k based on previous DXY moves.
A break below 101 should see a move to the low 90s which if that were to occur would likely send BTC to $150k based on previous DXY moves.

Check out @RealVision for more long form reports, in depth interviews, data dashboards and vibing community.
• • •
Missing some Tweet in this thread? You can try to
force a refresh


