The choice of whether to use Seurat or Scanpy for single-cell RNA-seq analysis typically comes down to a preference of R vs. Python. But do they produce the same results? In w/ @Josephmrich et al. we take a close look. The results are 👀 1/🧵 biorxiv.org/content/10.110…

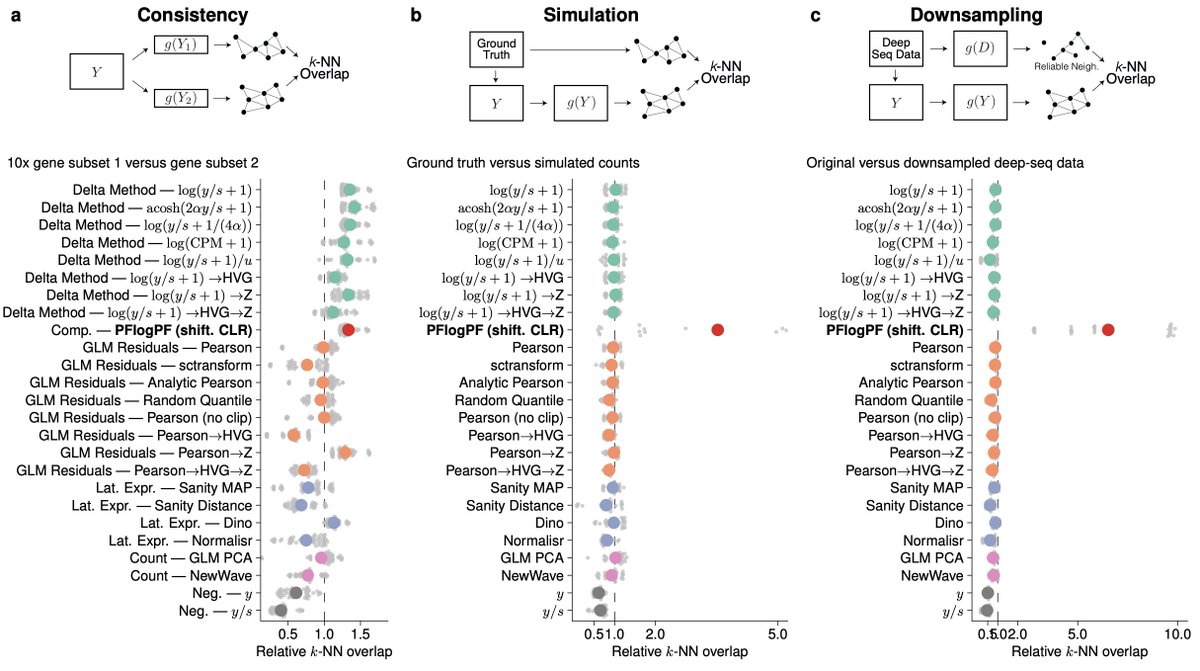
We looked at a standard processing / analysis summarized in the figure below. The sources of variability we explored are in red. The plots and metrics we assessed are in blue. We examined the standard benchmark 10x PBMC datasets, but results can be obtained for other data. 2/

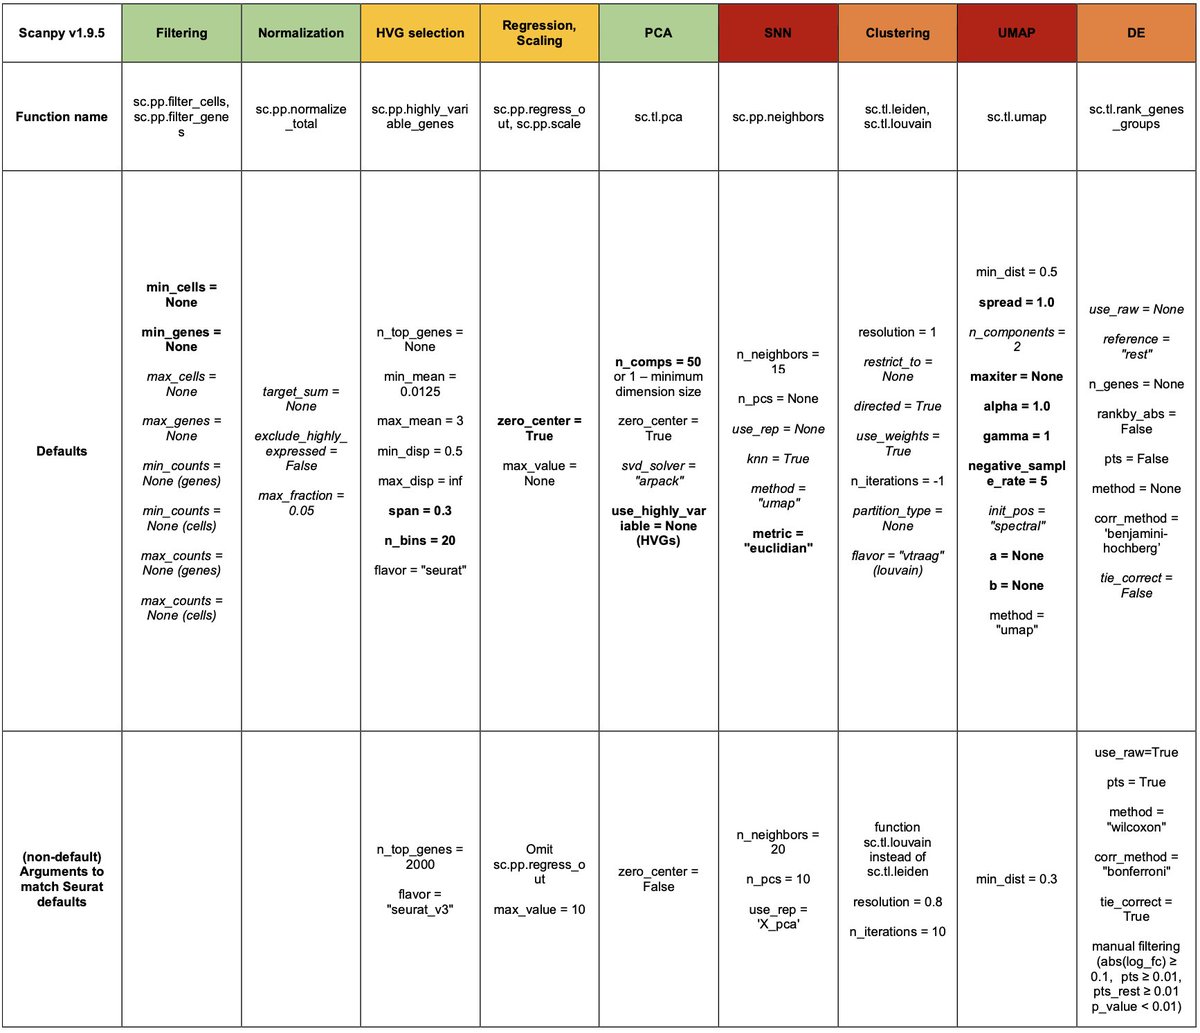
Before getting into results it's important to note that Seurat has never been published, and many of the details of Scanpy are missing in its original paper. @Josephmrich read the code & traced every function and every parameter. E.g., this is how Clustering / UMAPs are made: 3/

There's a lot of talk about kNN graphs, but Seurat uses an SNN graph for clustering, whereas Scanpy uses (a different) SNN graph for both UMAP & clustering. The way kNN graphs are made also differs (and can depend on the number of cells being processed). More on this later. 4/

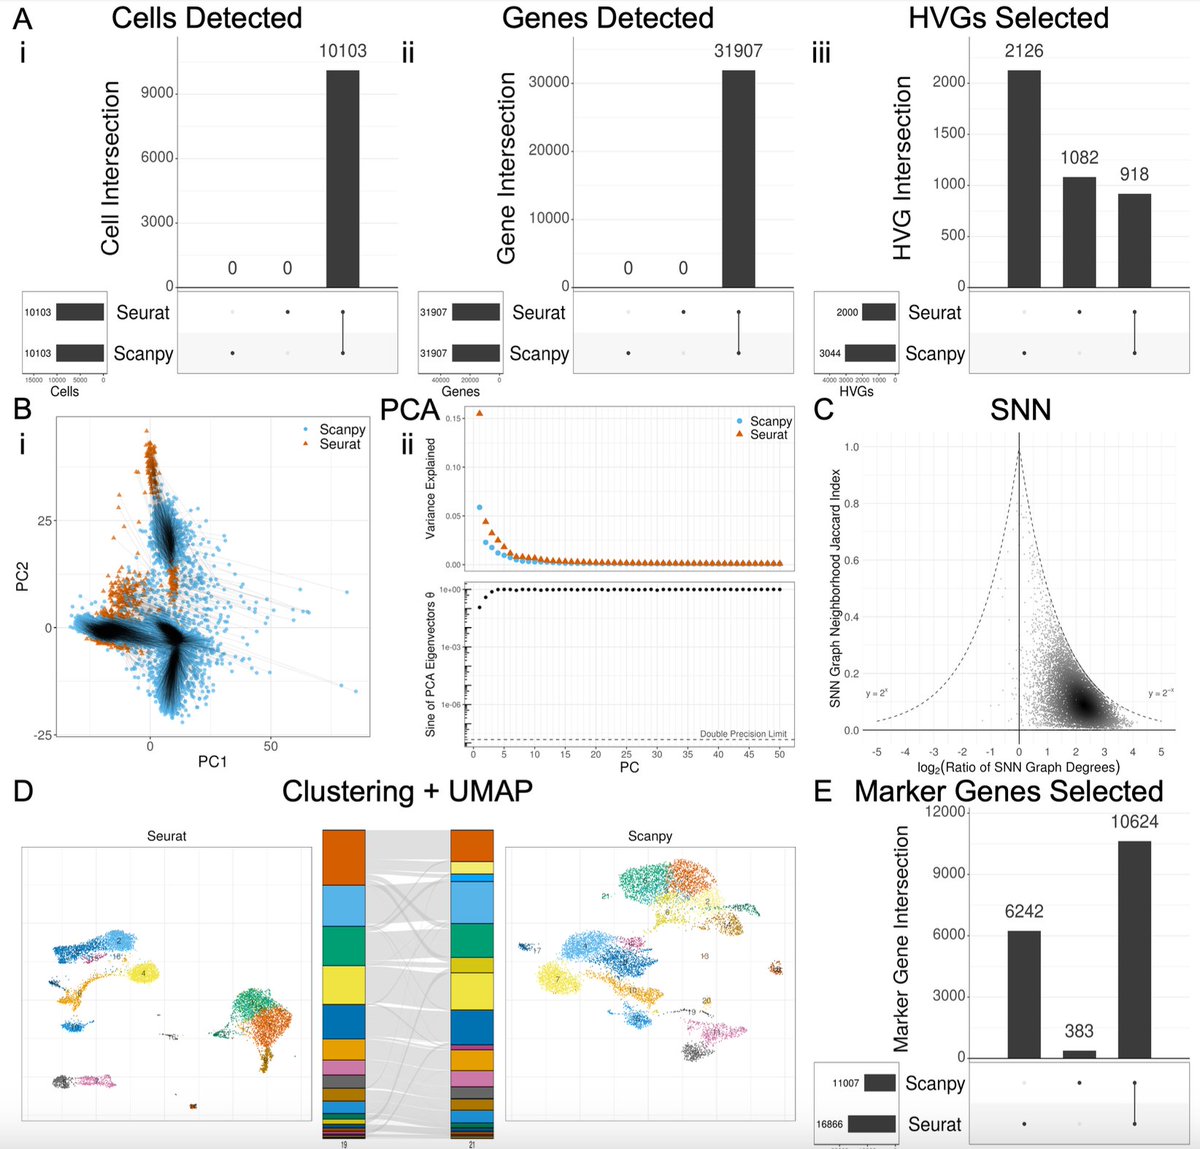
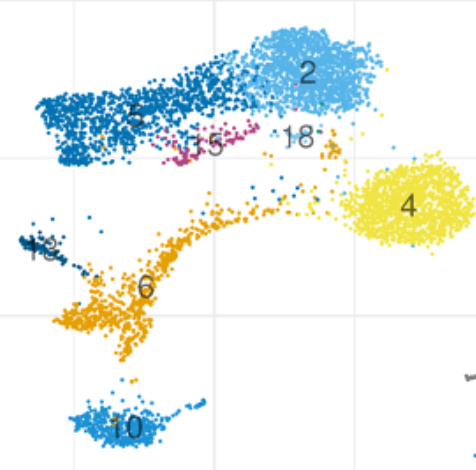
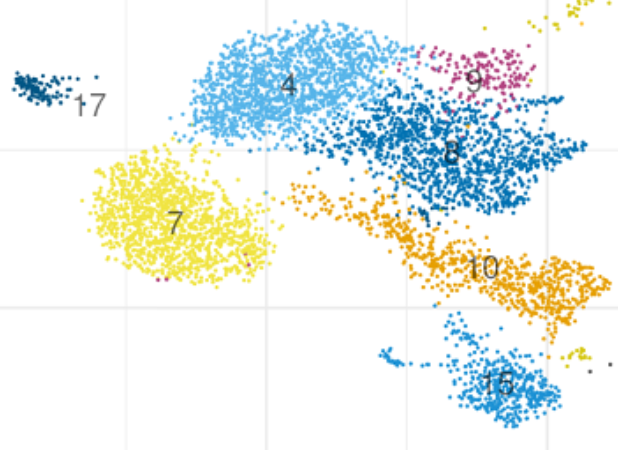
So let's jump to what people fixate on most: clusters & UMAPs. Starting with the same data and running Seurat and Scanpy with their defaults one gets the results below. Making this plot was non-trivial, as it required a matching algorithm to get the clusters / colors aligned. 5/

Seurat clusters are a more jumbled than the Scanpy ones (look at cluster 3 Seurat vs. 5 Scanpy). This is because Seurat uses different graphs for clustering & UMAP, whereas Scanpy uses the same.Based on this I've learned to tell whether a UMAP was made by Seurat or Scanpy 🙃. 6/
I now joke that if you want to make your PI happy, show them a Scanpy UMAP because the data will look cleaner. But of course this isn't funny. There can be completely different conclusions drawn from the two UMAPs both qualitatively and quantitatively .7/
A basic question is can Seurat and Scanpy be made the same, i.e. leaving aside the question about which is more correct, can parameters be set to get the programs to agree? @josephmrich did a detailed analysis of this. The answer is partly yes but overall no. 8/

Some functions agree with default params. Some can be made to be the same by matching arguments. In some cases (e.g. SNN / UMAP) it's impossible to get them to agree within the current implementations. Guides for how to make Seurat match Scanpy, or vice versa, are in the Supp. 9/

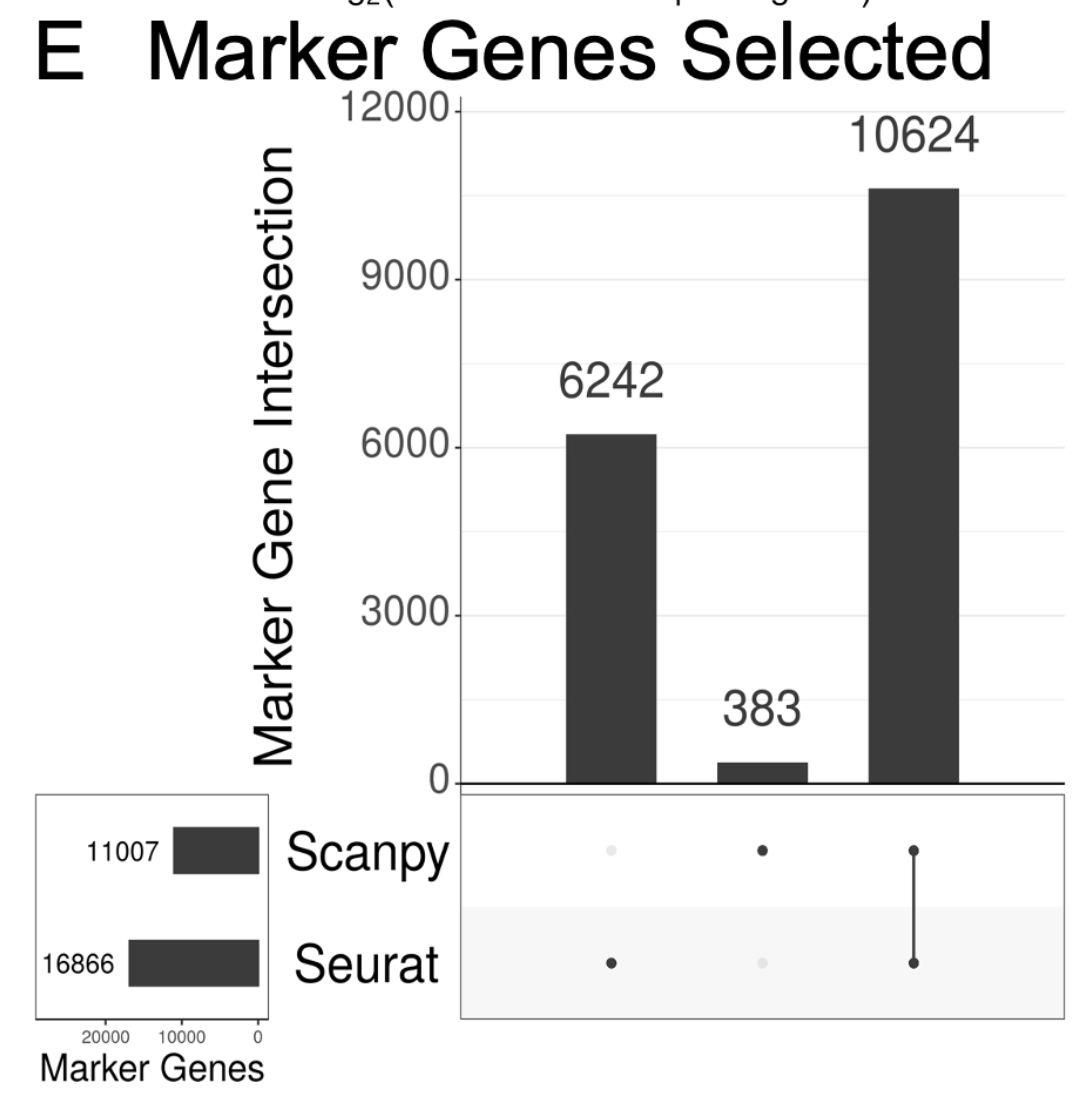
To understand the contribution of differences in each step to the overall divergence of the methods, we examined the output of each step with the exact same input. This is all in the supplement. This was important because the end result (markers) is *very* different. 10/
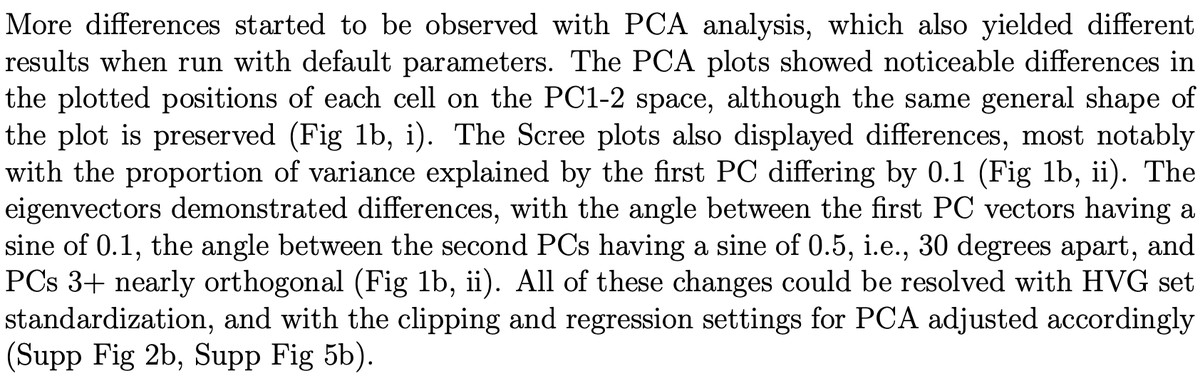
tl;dr there is a ton of detail that really matters. Differences started to be observed with PCA. They can be resolved (in the case of PCA), but it required really digging into the code to figure out how. Without fixing these differences, the PCAs don't match. 11/

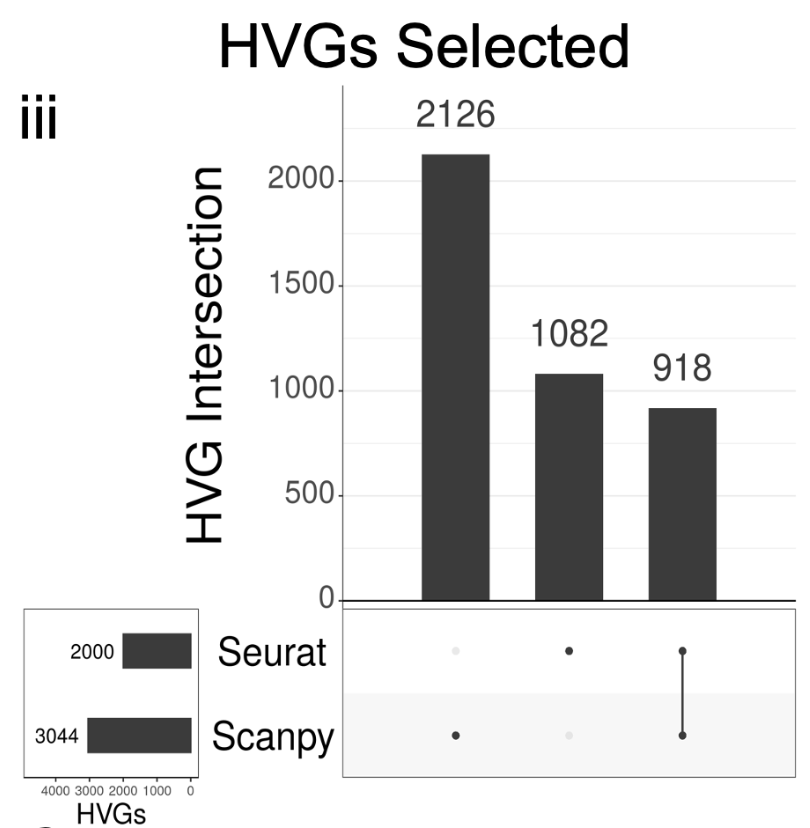
Key differences start to emerge with how Seurat and Scanpy select highly variable genes (HVGs). Seurat’s default HVG algorithm is “vst” (equivalent to Scanpy’s “seurat v3” flavor), while Scanpy’s default HVG algorithm is “seurat” (equivalent to Seurat’s “mean.var.plot”). 👀 12/
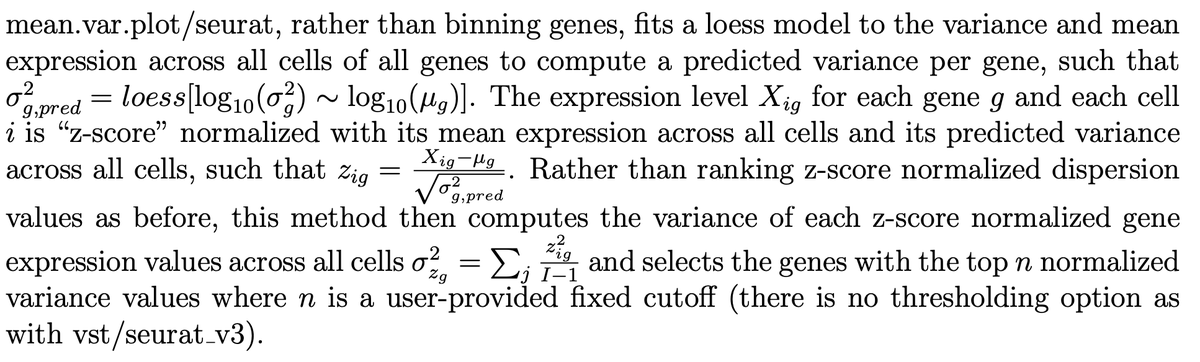
It matters what the algorithms are, and they're totally different. Before asking which to use, it's useful to now what they are. Details are in the preprint. E.g. mean.var.plot/seurat fits a loess model to the variance and mean. Vst/seurat_v3 bins based on ranked mean. 13/
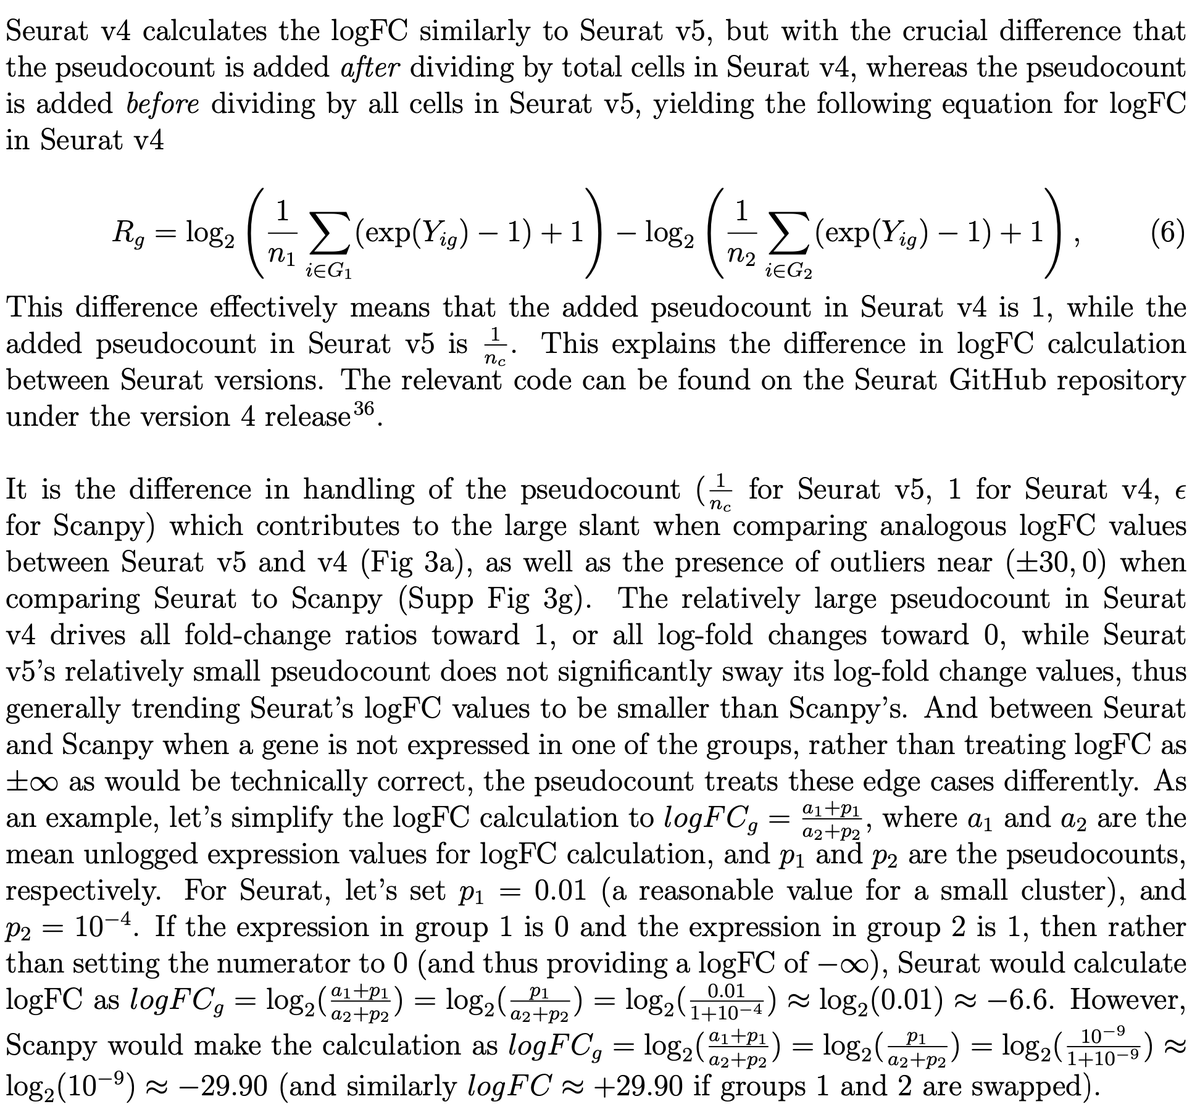
Versions also matter. A lot. Seuratv5 has changed how log-fold change is computed from Seuratv4. The difference to results are massive. This change was done to fix an error pointed out in preprints by @jeffreypullin & @davisjmc, and seperately by @LambdaMoses from our group. 14/

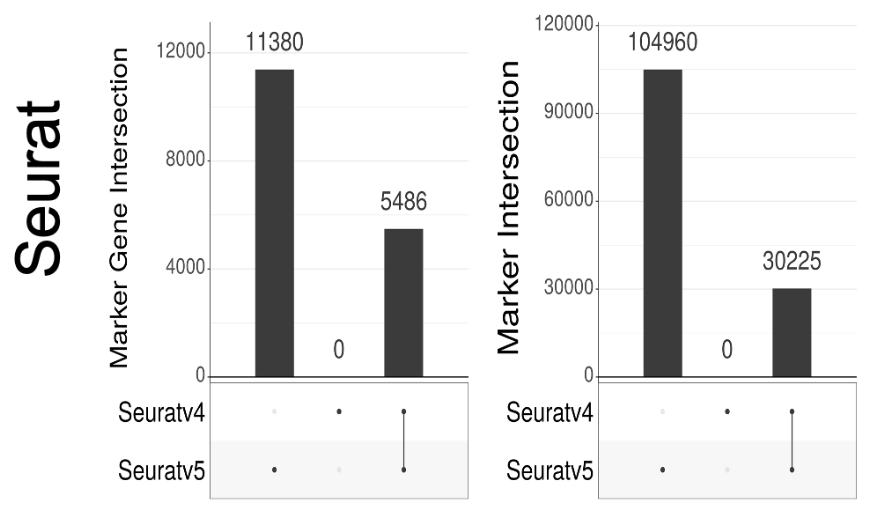
But the new fix is still problematic. @josephmrich again looked at the implementation, and there is now a dependence in the pseudocount on cluster size, which is weird. We explain this, in detail, in the preprint. 15/
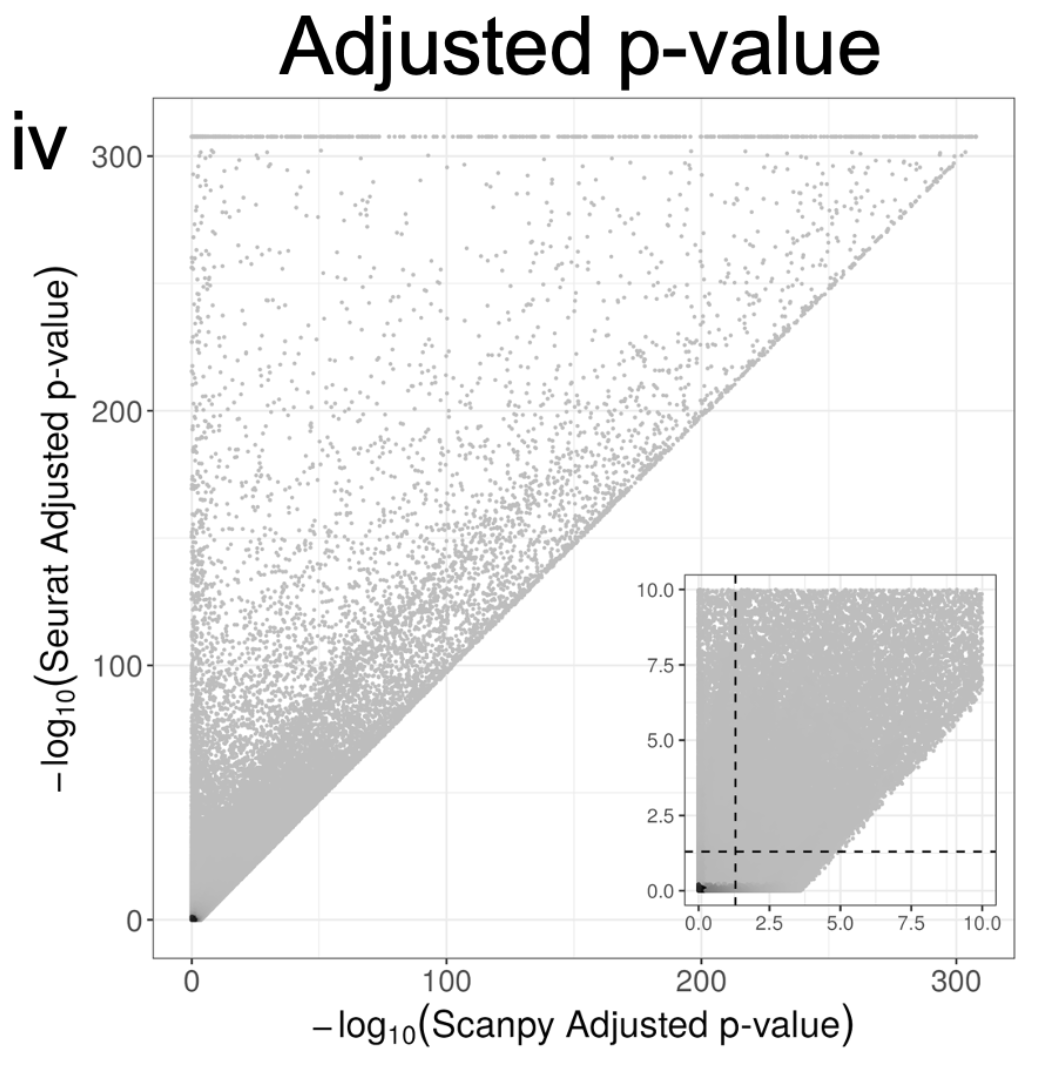
There are too many other differences between Seurat and Scanpy to summarize here. I'll mention a seemingly minor one with major implications. They handles ties different when computing adjusted p-values. This results in major differences in reported p-values. 16/
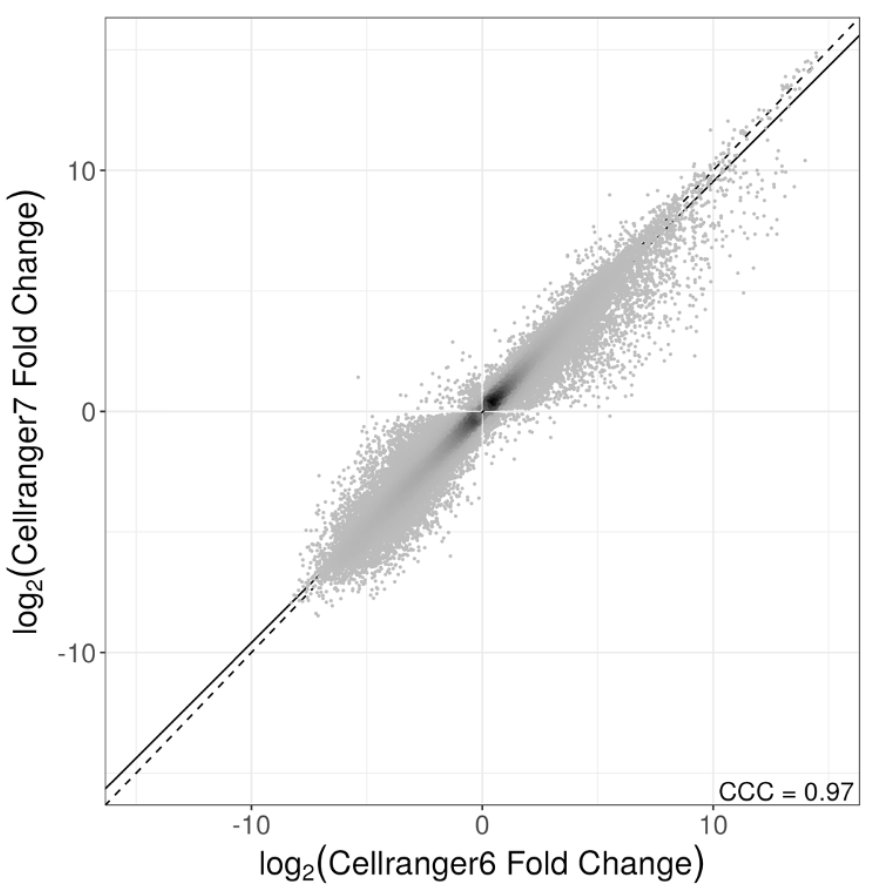
Versioning is a major issue not just with Seurat & Scanpy. We also looked at Cell Ranger, which has changed its default for how it counts reads to produce the gene-count matrix. The change has major implications. I recommend sitting down before looking at the plots. 17/
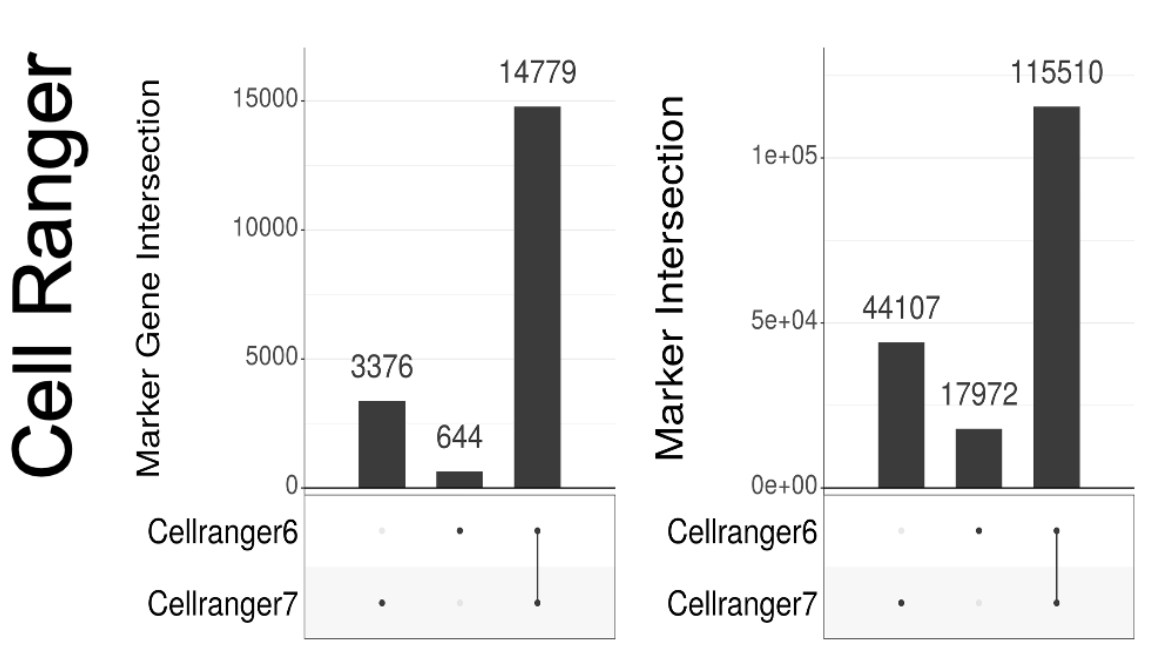
Now some might say "ok, but I don't care..still found our biological result either way". That may be true, but then perhaps one should sequence less, or assay fewer cells. We asked how low one could go, and still have results whose differences is less than Seurat vs. Scanpy. 18/
The answers are below, broken down by procedure. If you don't care about the differences between Seurat and Scanpy, you might as well sequence 5% of the reads, or sacrifice a lot fewer mice and assay less 80% less cells. 19/

This is a key point. Nihilism in terms of software used and an addiction to not understanding (h/t Amos Tanay) is not just poor scholarship, it also leads to wasted (graduate student and postdoc) time, @NIH money, and lives of animals. The #scRNAseq field can do better. 20/
Thanks to @satijalab and @fabian_theis for making their Seurat and Scanpy packages open source. This work could not have been undertaken without that transparency. Our analyses are also open source and reproducible; the code is available at 21/github.com/pachterlab/RME…
This work began from initial investigations into the differences between log-fold-change calculations between Seurat and Scanpy that I looked at with Nicolas Bray, and which we wrote about in the Supplement here: 22/biorxiv.org/content/10.110…
@LambdaMoses also started to investigate differences in PCA, which was continued by the @pmelsted group. On the advice of we decided to go more in-depth and write a separate paper. @Josephmrich took on the task, and the manuscript is his work. 23/twitter.com/GaalBernadett
Aside from the comparisons between Seurat and Scanpy, their different versions, examination of Cell Ranger version differences etc., @Josephmrich's detailed description of Seurat and Scanpy's methods and associated parameters should be useful documentation for others. 24/
Finally, this work was truly a lab effort. Kayla Jackson, @NeuroLuebbert, @sinabooeshaghi, and @DelaneyKSull all had numerous and useful insights after slowly developing worries about Seurat vs. Scanpy over the years. I'll conclude with #methodsmatter 25/25
• • •
Missing some Tweet in this thread? You can try to
force a refresh