
🧵on a few interesting nuggets from our story this week on lessons from our 50K YouGov polling sample (): (1/x)economist.com/united-states/…
1. As you move up in age, white voters move right—except for the baby boomers, who are more Dem than either Gen X (younger) or Silent (older). Young white women are Trumpier than young white men?! Black voters move left at higher ages, & their gender gap shrinks. 2/x 

This supports recent work by @jburnmurdoch on race () & @nate_cohn on age (). I haven't seen anything on young whites’ reverse gender gap: we have Biden up 59-41 2-way w/ white women 18-24 (n=569) & 65-35 w/ white men 18-24 (583). 3/xft.com/content/a76076…
nytimes.com/interactive/20…
nytimes.com/interactive/20…
We all talk about race, but the best single predictor of voting intention in our survey is religion. (Most voters are white, and race doesn't tell you anything about white voters’ preferences.) For white, Hispanic, and Asian voters, the more important u say religion is to u 4/x
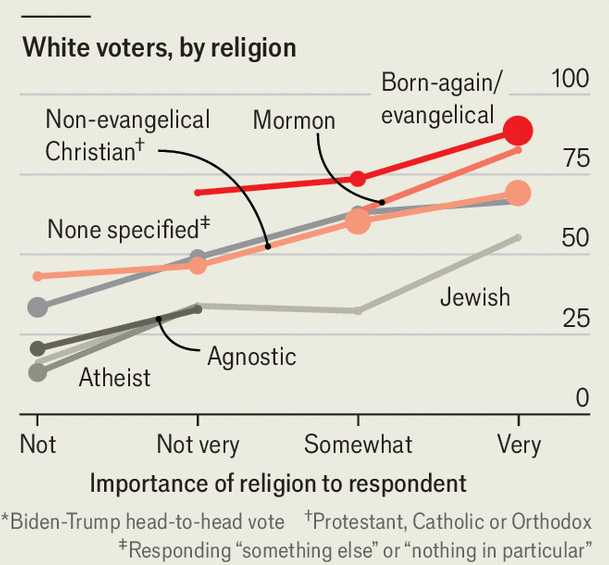
the likelier you are to back Trump—regardless of religious affiliation. But controlling for race & religious imptnce, affiliation still has a yuge impact: Trump gets like 30% of white religion-somewhat-impt Jews, but 75% of white religion-somewhat-impt born-again Christians. 5/x
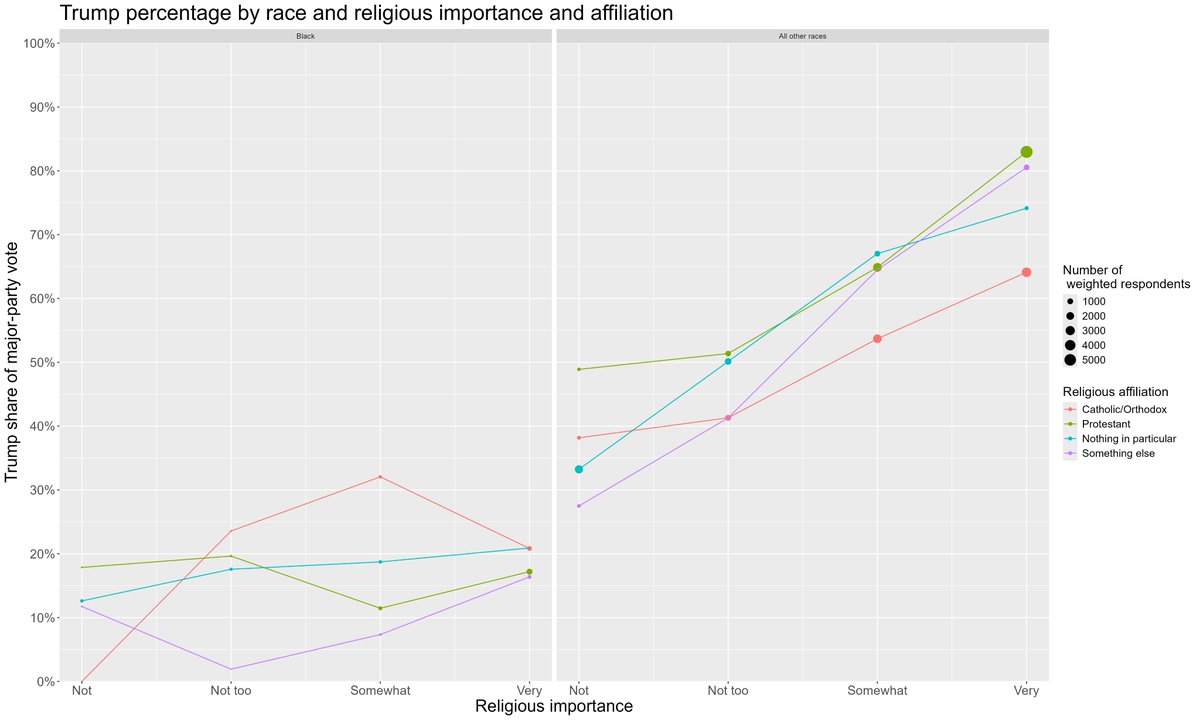
Only among black voters does religious importance fail to predict Trump support, which makes sense given the political history of majority-black churches. Apologies for the ugly ggplot here. 6/x
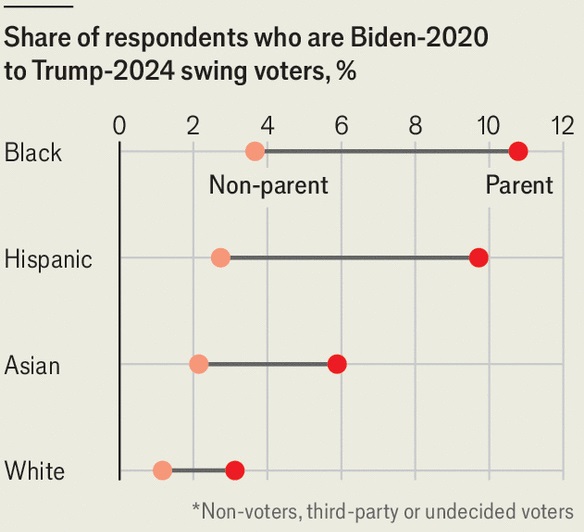
Prob the most striking finding was that the 2nd-best predictor of being a Biden 2020/Trump 2024 swing voter (after being young) was being a non-white parent of a child under 18. V big effect size on a solid sample (2K weighted non-white parents, ~200 Biden-Trump flippers). 7/n
I don’t think this has to do with culture wars over wokeness in curricula, b/c only 3% of Biden-Trump swing voters listed education as their top issue. My operating hypothesis is that it’s a consequence of lockdowns and school closures, but would love to see a thorough study 8/n
There’s also a fun bit on the complex relationship between income and vote choice. If you just plot them by themselves, it looks like Trump does best among middle-income voters. 9/n
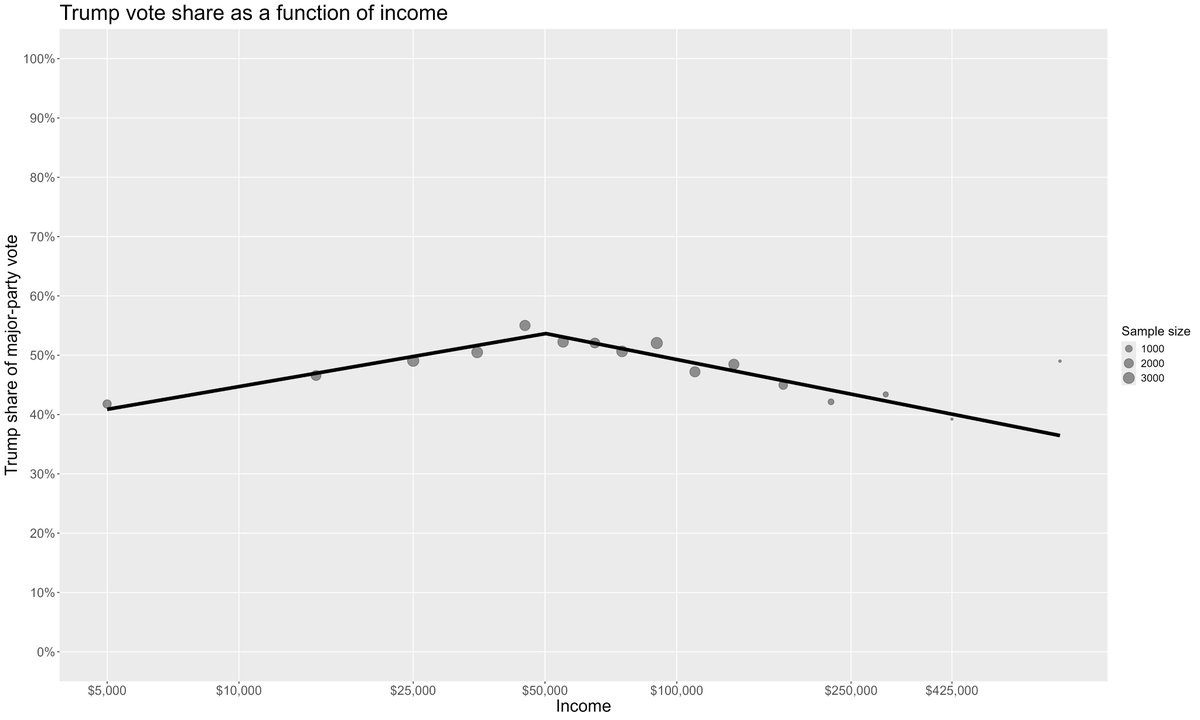
But lower-income voters are disproportionately non-white, and non-whites are disproportionately Democratic. Looking just at white voters, it’s flat from $0-$50K and then declines...10/n
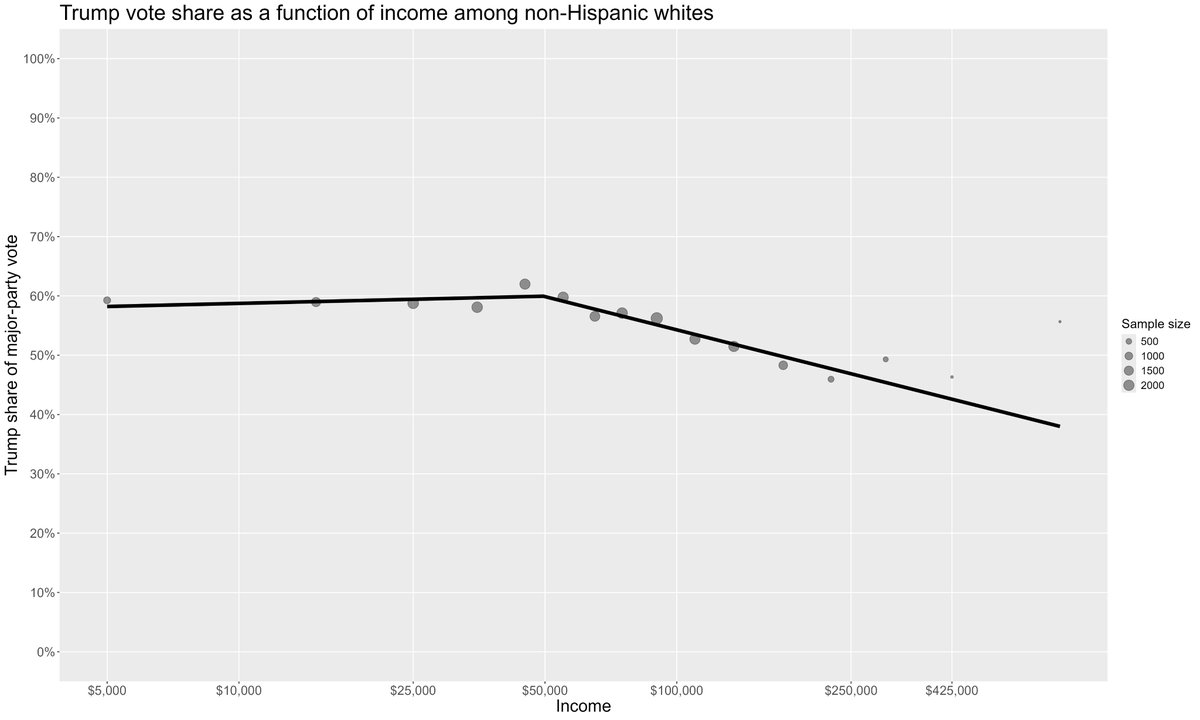
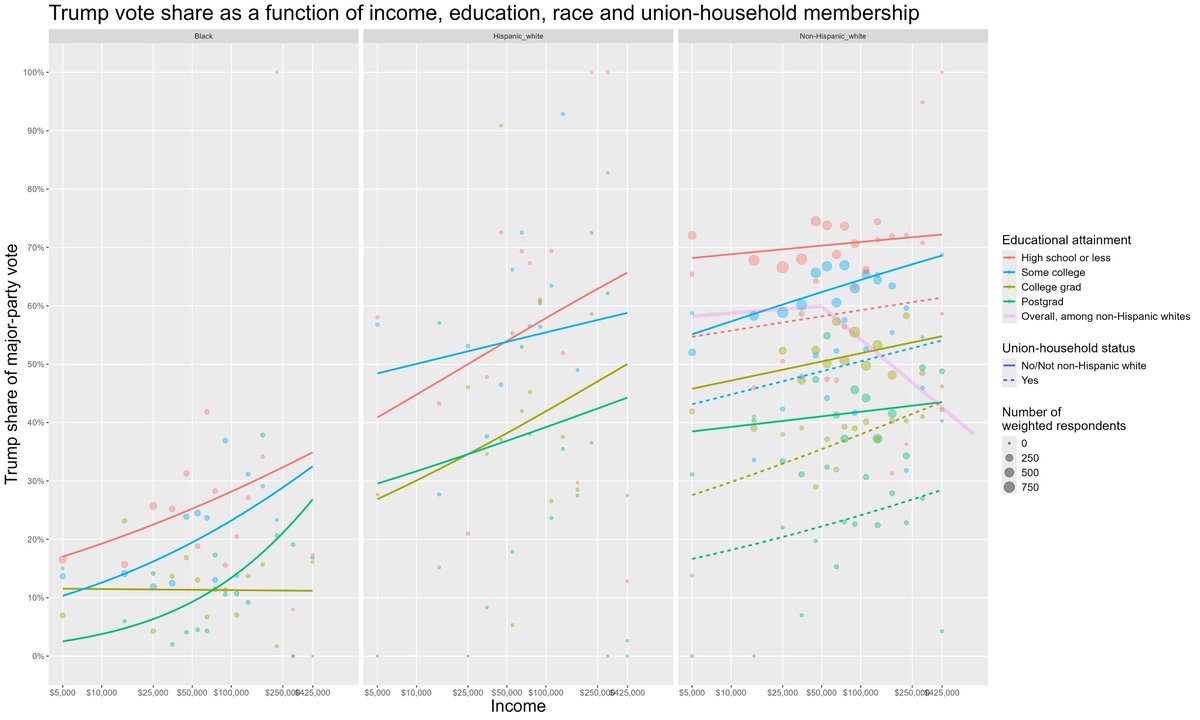
but this too is a statistical artifact, b/c the highest-income white voters are also the most likely to be educated, which is tied to voting Dem. If we break it down by race AND education, the old party system of Dems representing labor and Reps capital reveals itself 11/n
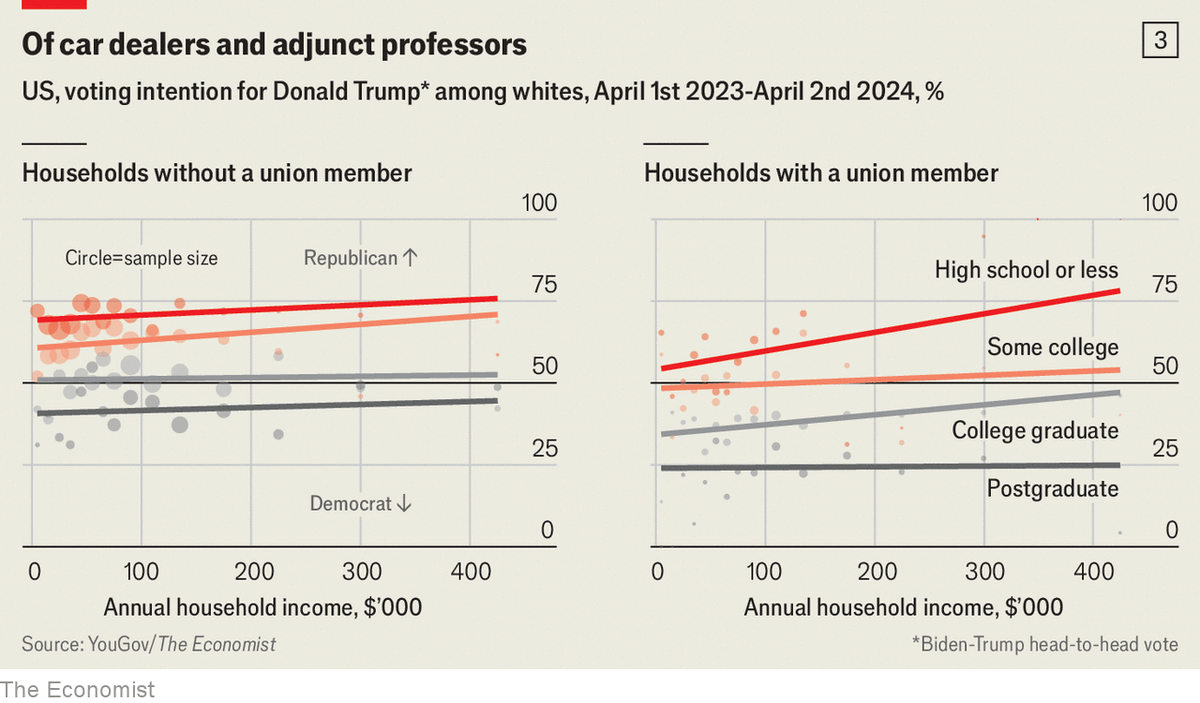
Apologies for another ghastly ggplot, but you can see that within race-education groups, the highest-income voters are the Trumpiest, and that having a union member in the household increases Dem vote share by ~10 % pts. Similar effect to adding one tier of education 12/n
Here's a cleaner/more legible version in Economist style, though it only shows the pattern among white voters. 13/n
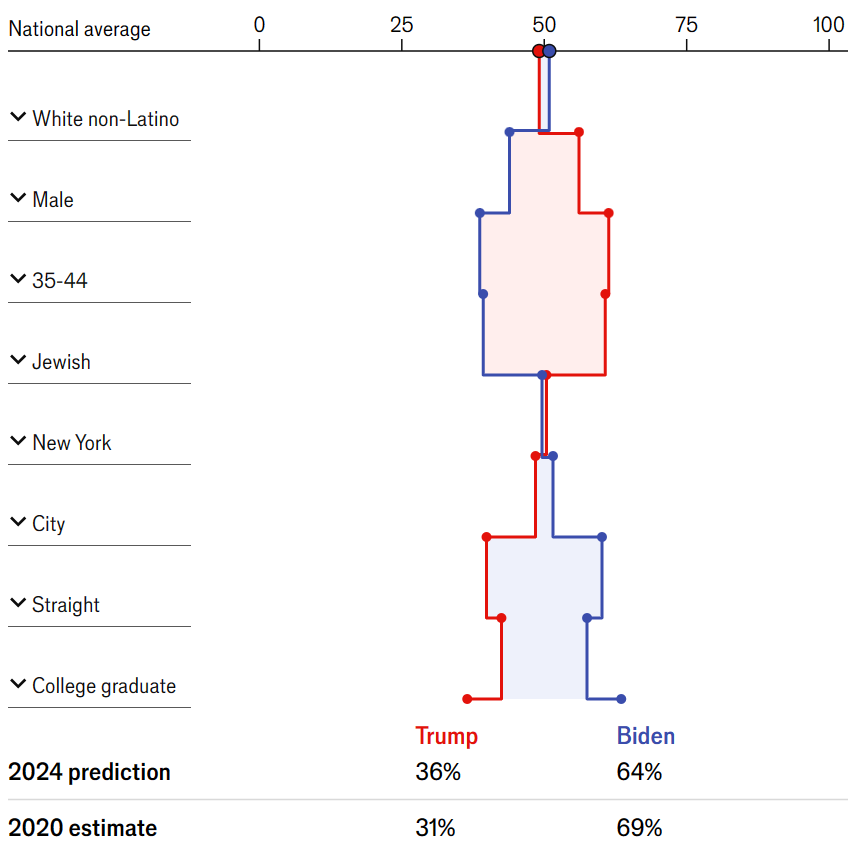
Using this giant dataset, we fit a LASSO logistic regression to predict 2-party vote intention. It now lives at an interactive (), where u can plug in any combo of 8 demographic variables & see estimated Trump/Biden probabilities for both 2020 & 2024 14/neconomist.com/us-voter
Unfortunately cell-phone screen-size limits meant we could only use 8 of the 18 variables in our full model, but it's still like ~73% accurate in the test set. Here’s my #BuildAnAmericanVoter profile—please plug in yours and share! 15/n
Of possible interest: @NateSilver538 @gelliottmorris @lxeagle17 @leedrutman @Redistrict @loganr2wh @RyanDEnos @johnmsides @rnishimura @smfrogers @bradwascher @GalenMetzger1 @electionclark @ElectProject @vavreck @amandacox @sahilchinoy @admcrlson @CharlieCookDC @lennybronner 16/17
cc @cwarshaw @nathanlgonzales @LarrySabato @b_schaffner @BrendanNyhan @KevinQ @jon_m_rob @kkondik @SeanTrende @Edsall @RonBrownstein @databyler @dhopkins1776 @PatrickRuffini @DrewLinzer @NormOrnstein @benwallacewells @sissenberg @badler @ForecasterEnten 17/17
• • •
Missing some Tweet in this thread? You can try to
force a refresh


