In this THREAD I will explain “FVG's”
1. What is a “FVG”?
2. Types of FVG's
3. BISI
4. SIBI
5. Inverted FVG
6.Balanced price range
7. How to IDENTIFY FVG's
🧵 (1/8)
1. What is a “FVG”?
2. Types of FVG's
3. BISI
4. SIBI
5. Inverted FVG
6.Balanced price range
7. How to IDENTIFY FVG's
🧵 (1/8)

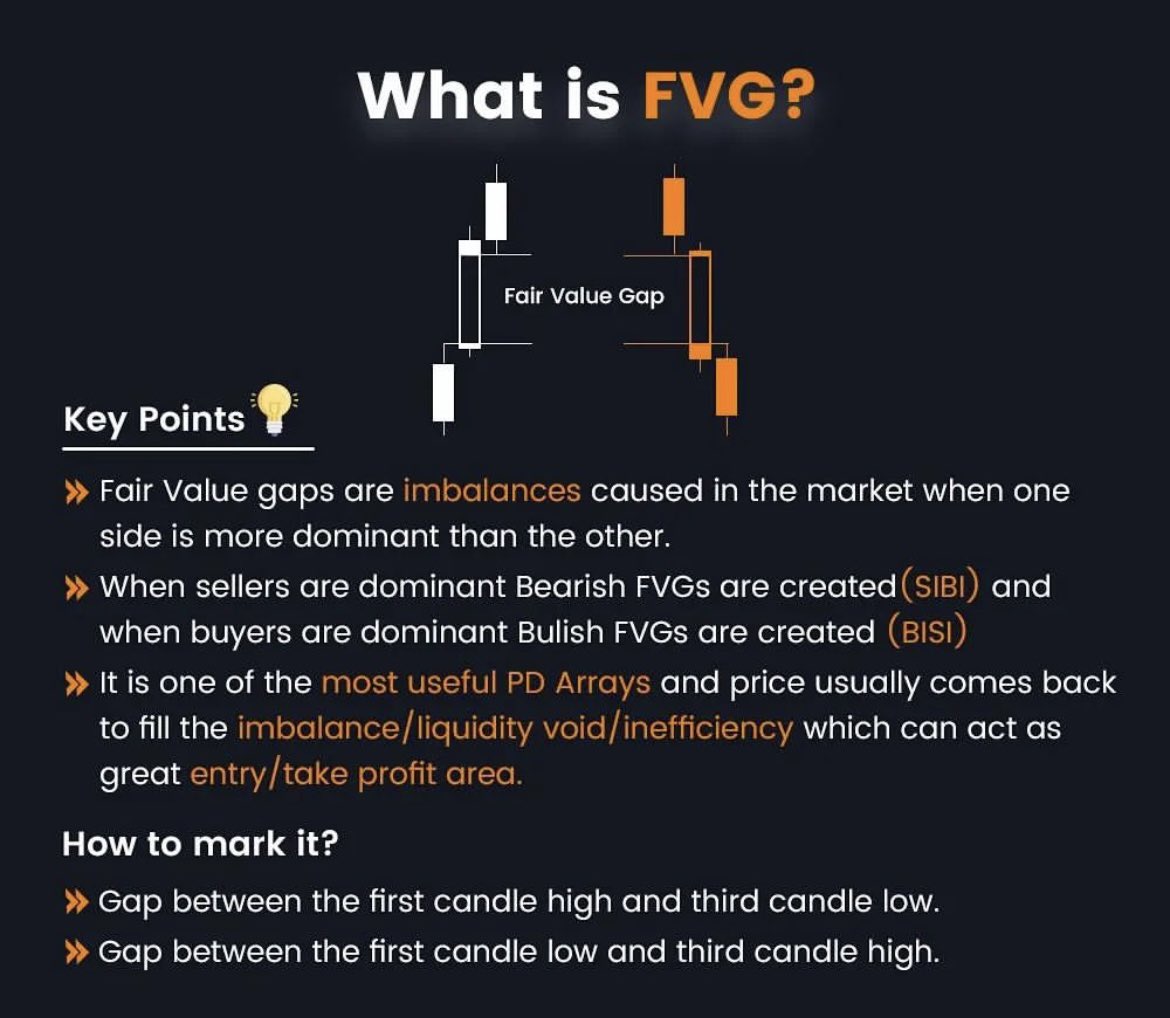
1. What is a “FVG”?
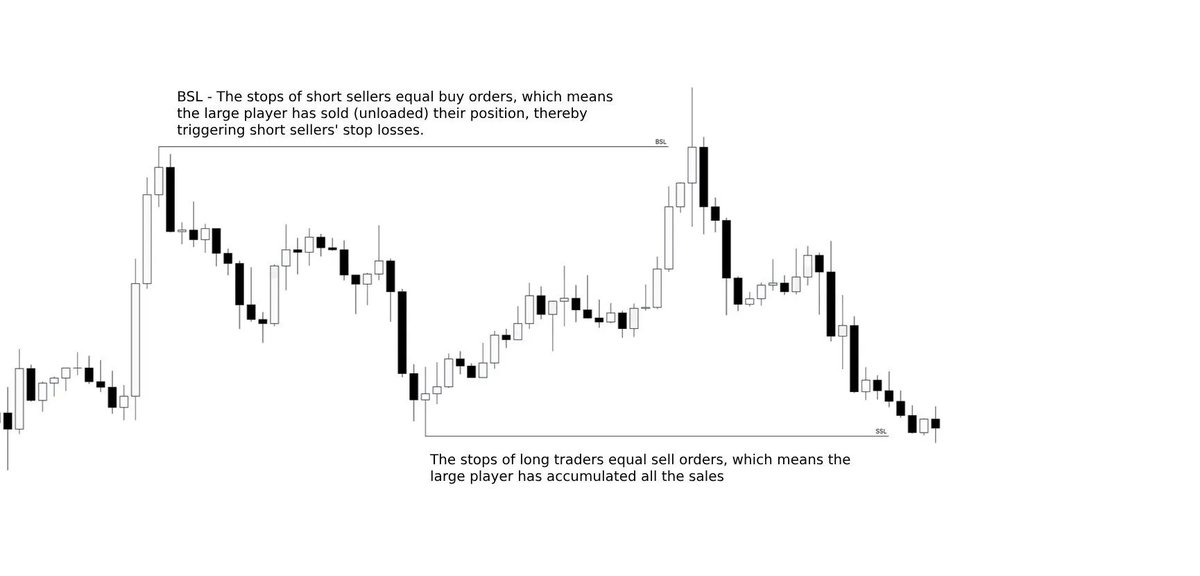
Fair Value Gaps are imbalances caused in the price, which will eventually be fulfilled.
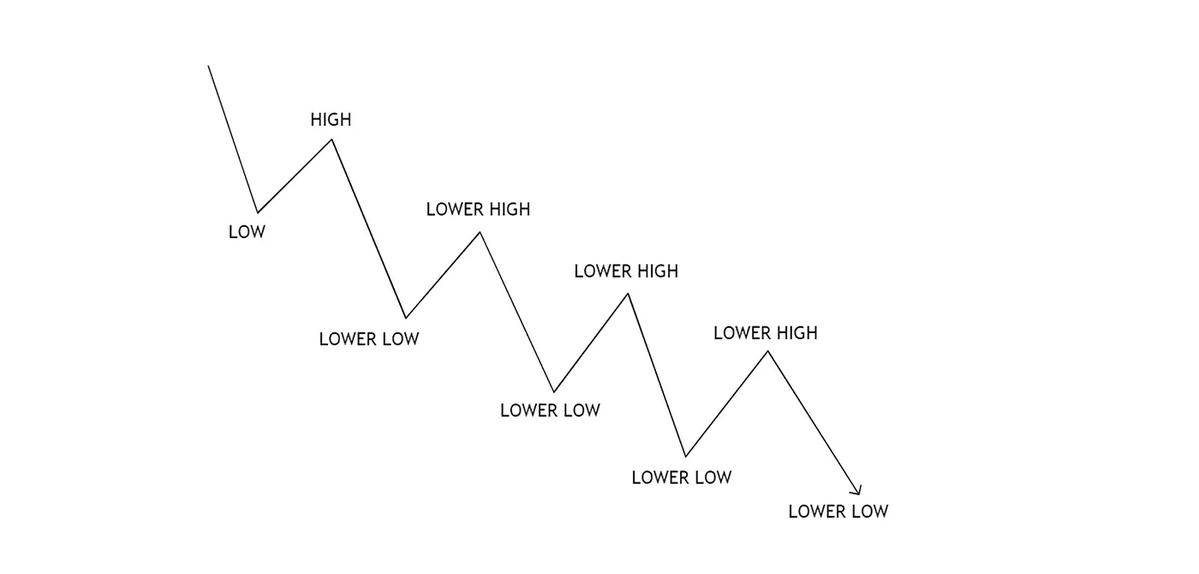
When sellers are dominant, Bearish FVGs are created (SIBI)
When buyers are in control, Bullish FVGs are created (BISI)
Fair Value Gaps are imbalances caused in the price, which will eventually be fulfilled.
When sellers are dominant, Bearish FVGs are created (SIBI)
When buyers are in control, Bullish FVGs are created (BISI)
2. Types of FVGs :
There are several types of FVGs.
Bullish, bearish, continuation, reversal…
In this THREAD I will explain the following types:
BISI, SIBI, Inverted FVG and Balanced price range.
There are several types of FVGs.
Bullish, bearish, continuation, reversal…
In this THREAD I will explain the following types:
BISI, SIBI, Inverted FVG and Balanced price range.
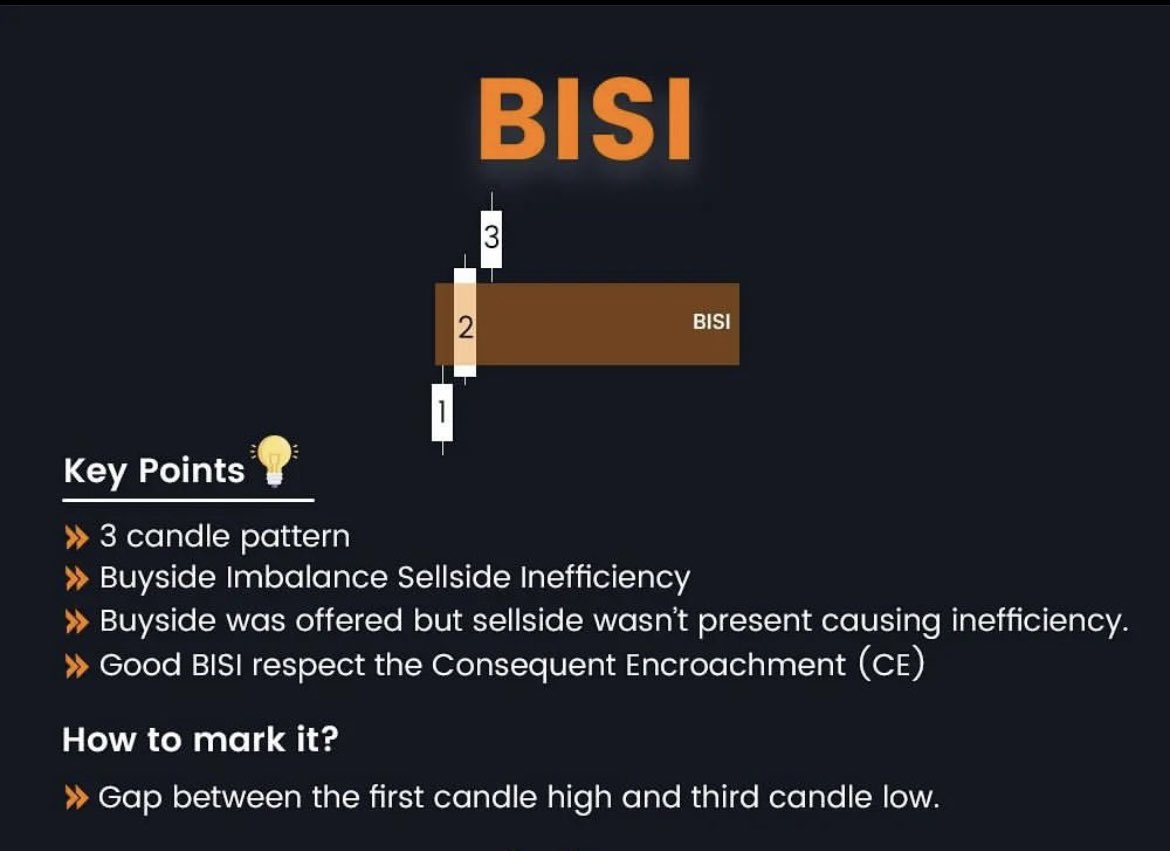
3. BISI
Buyers are in control. The gap of imbalance will be between the first candle high and third candle low.
It’s formed by a 3 candle pattern, in which the second candle is the one with the biggest volume.
Buyers are in control. The gap of imbalance will be between the first candle high and third candle low.
It’s formed by a 3 candle pattern, in which the second candle is the one with the biggest volume.
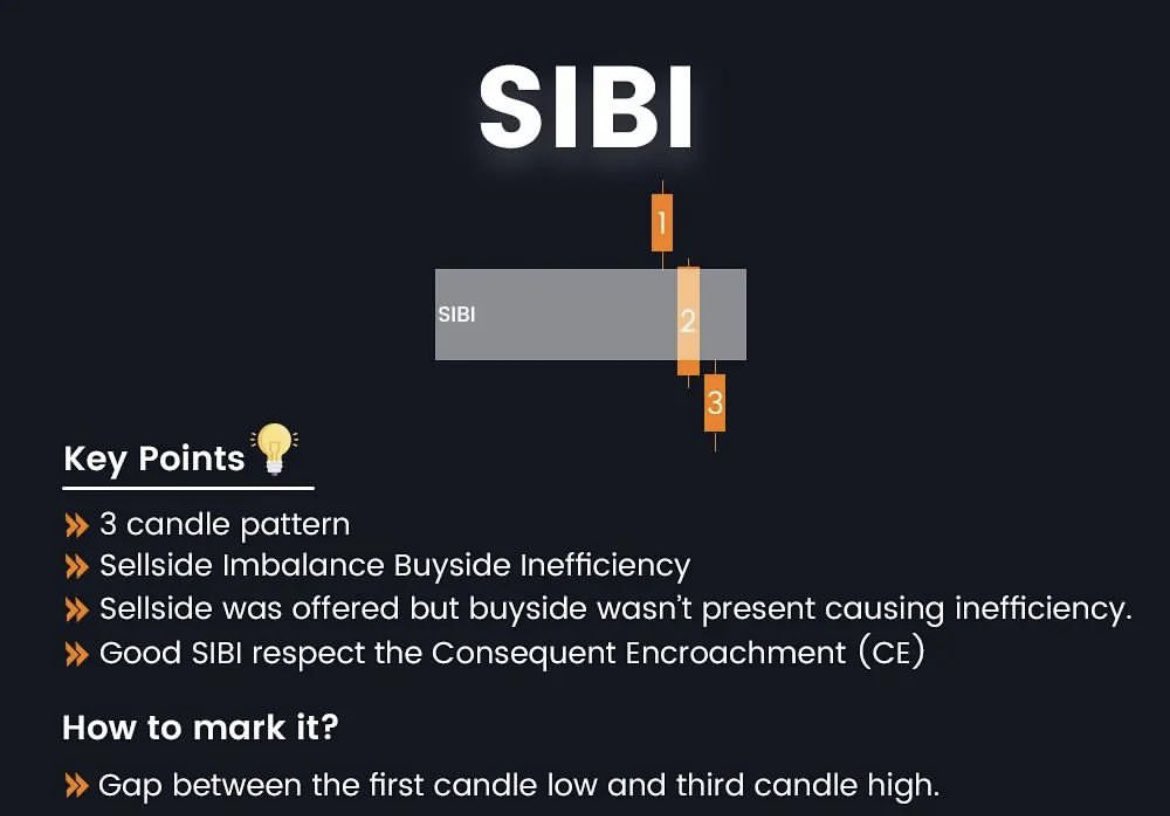
4. SIBI
Sellers are in control. The gap of imbalance will be between the first candle low and third candle high.
It’s formed by a 3 candle pattern, in which the second candle is the one with the biggest volume.
Sellers are in control. The gap of imbalance will be between the first candle low and third candle high.
It’s formed by a 3 candle pattern, in which the second candle is the one with the biggest volume.
5. Inverted FVG
Failed FVG's will act as reactions zones for price (as support or resistance)
SIBI = Acts as support
BISI = Acts as resistance
Failed FVG's will act as reactions zones for price (as support or resistance)
SIBI = Acts as support
BISI = Acts as resistance

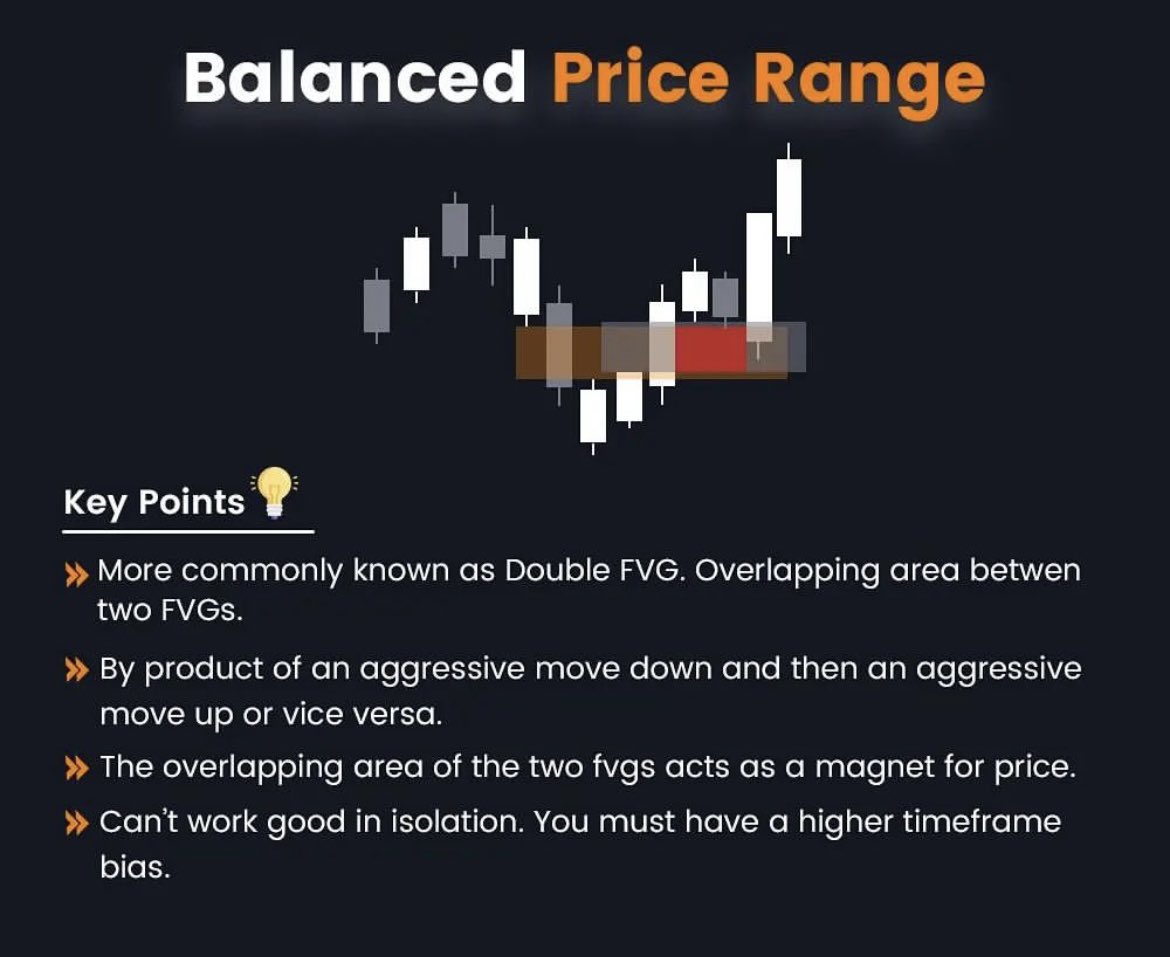
6. Balanced Price Range
It’s commonly known as “Double FVG”
It overlaps between two FVG's. This acts as a magnet for the price.
It’s commonly known as “Double FVG”
It overlaps between two FVG's. This acts as a magnet for the price.
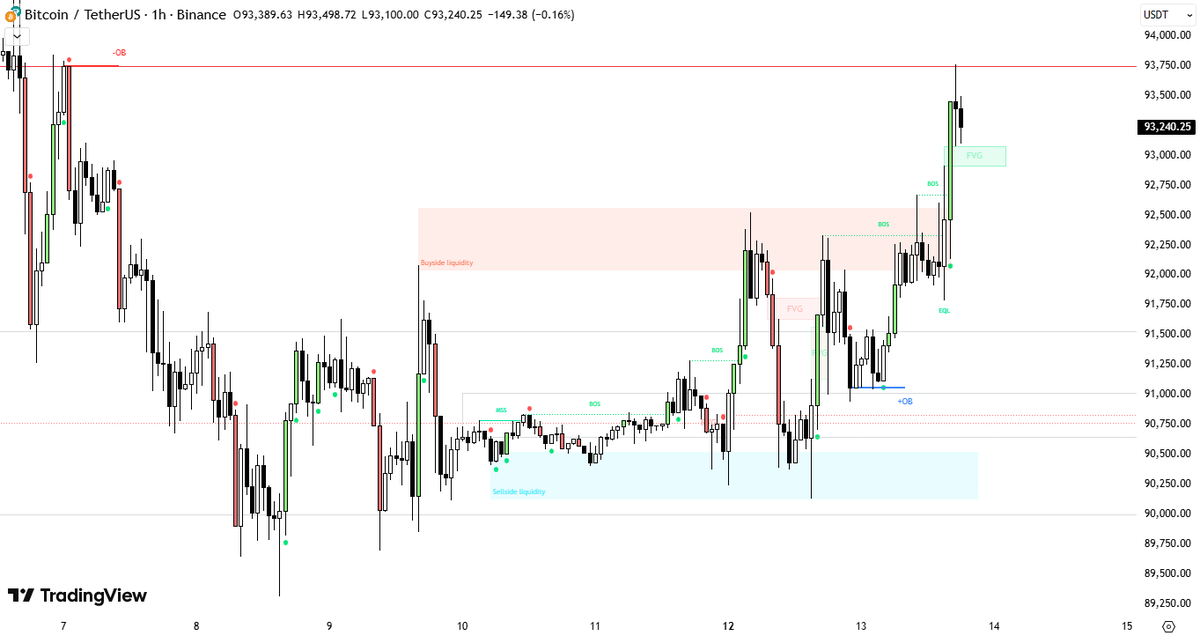
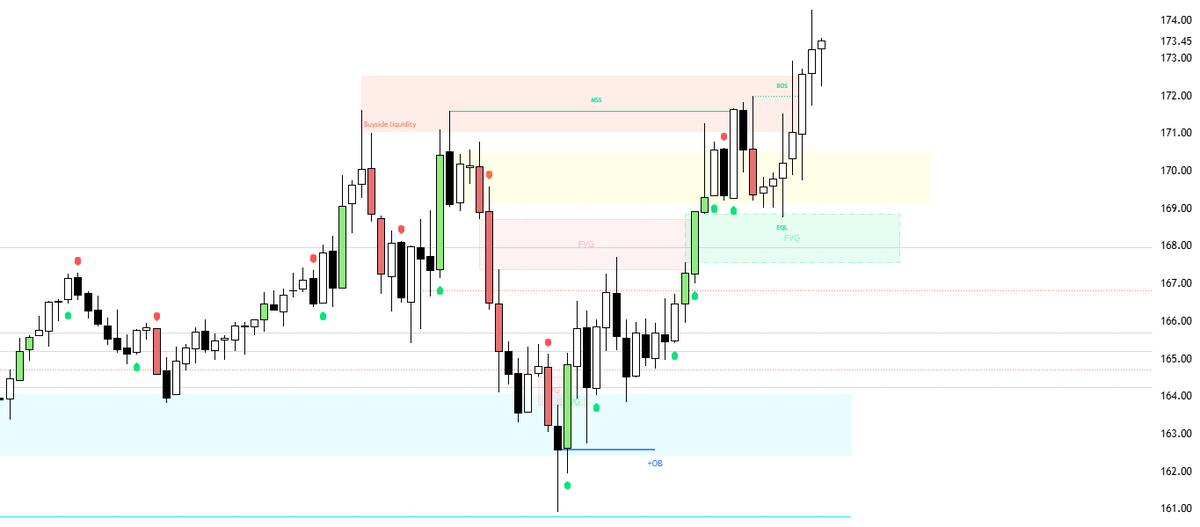
7. How to IDENTIFY High probability FVG's
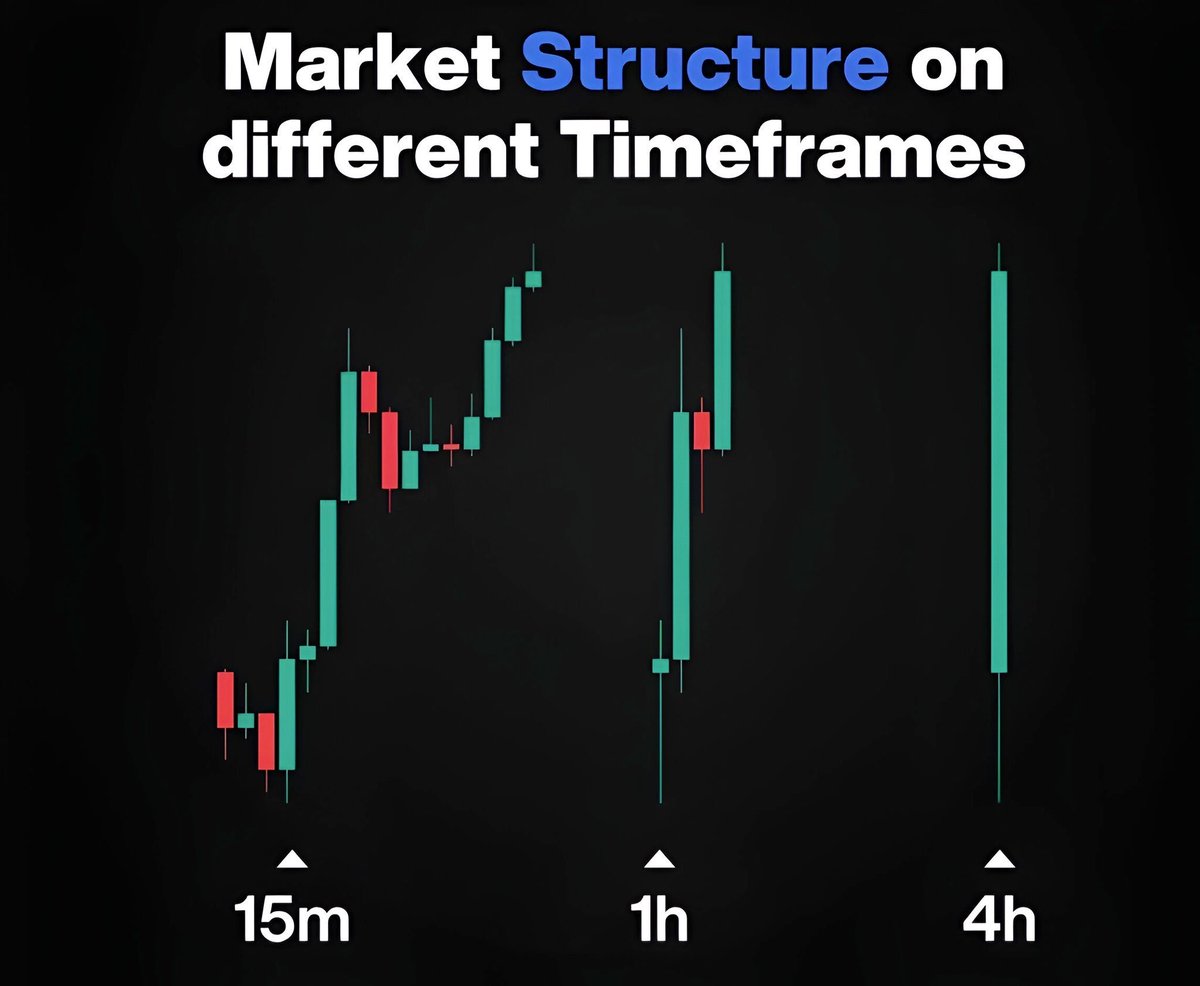
- Focus on HTF FVG’s
- Must have surpassed previous
FVG's
- Consecutive FVG's in the same direction
- Use OB's as confluence
- Focus on HTF FVG’s
- Must have surpassed previous
FVG's
- Consecutive FVG's in the same direction
- Use OB's as confluence

• • •
Missing some Tweet in this thread? You can try to
force a refresh