CryptoSoulz Profile picture
Apr 12 8 tweets 3 min read Read on X
In this THREAD I will explain “FVG's”

1. What is a “FVG”?
2. Types of FVG's
3. BISI
4. SIBI
5. Inverted FVG
6.Balanced price range
7. How to IDENTIFY FVG's

🧵 (1/8) Image
1. What is a “FVG”?

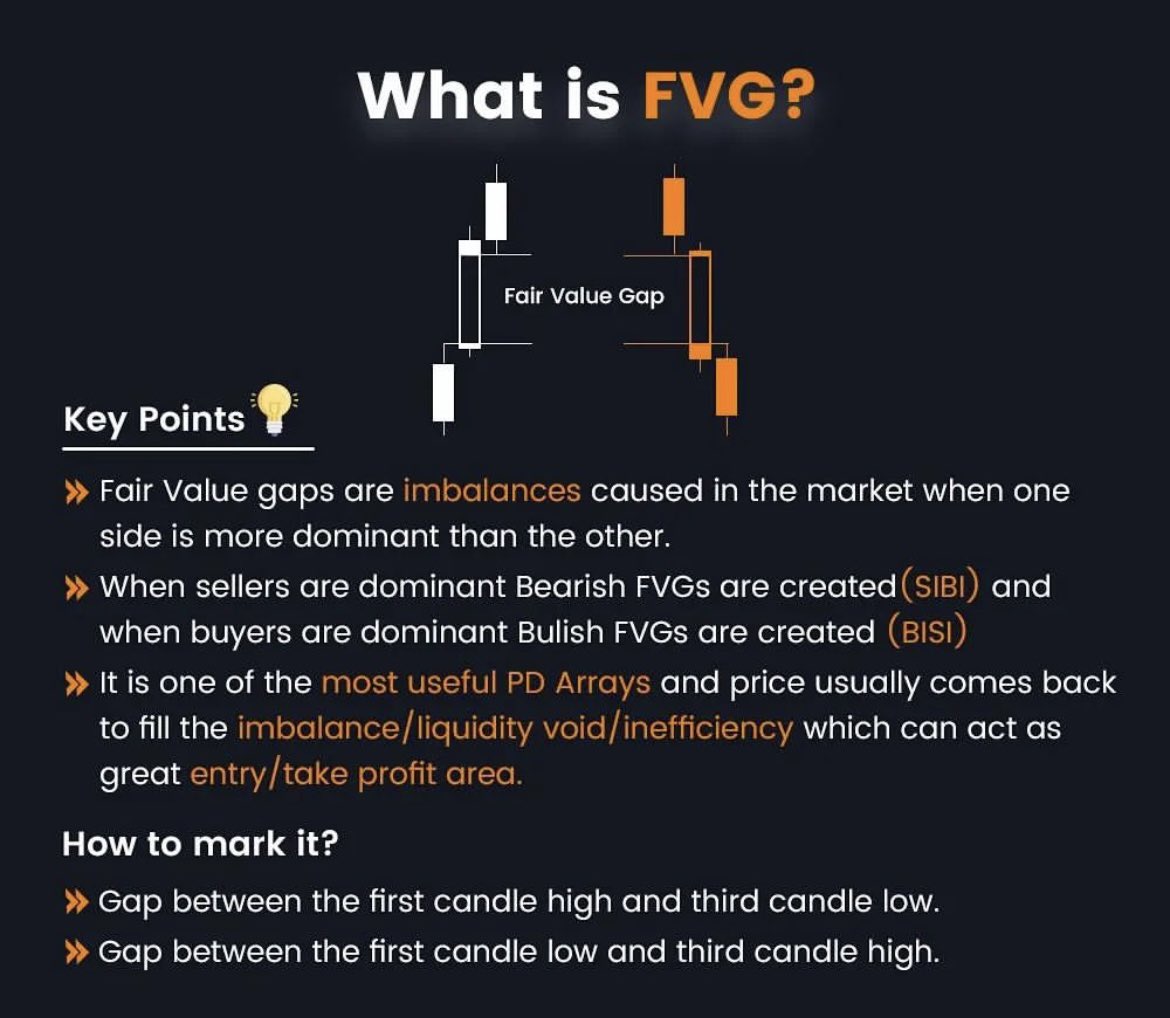
Fair Value Gaps are imbalances caused in the price, which will eventually be fulfilled.

When sellers are dominant, Bearish FVGs are created (SIBI)

When buyers are in control, Bullish FVGs are created (BISI) Image
2. Types of FVGs :

There are several types of FVGs.

Bullish, bearish, continuation, reversal…

In this THREAD I will explain the following types:

BISI, SIBI, Inverted FVG and Balanced price range. Image
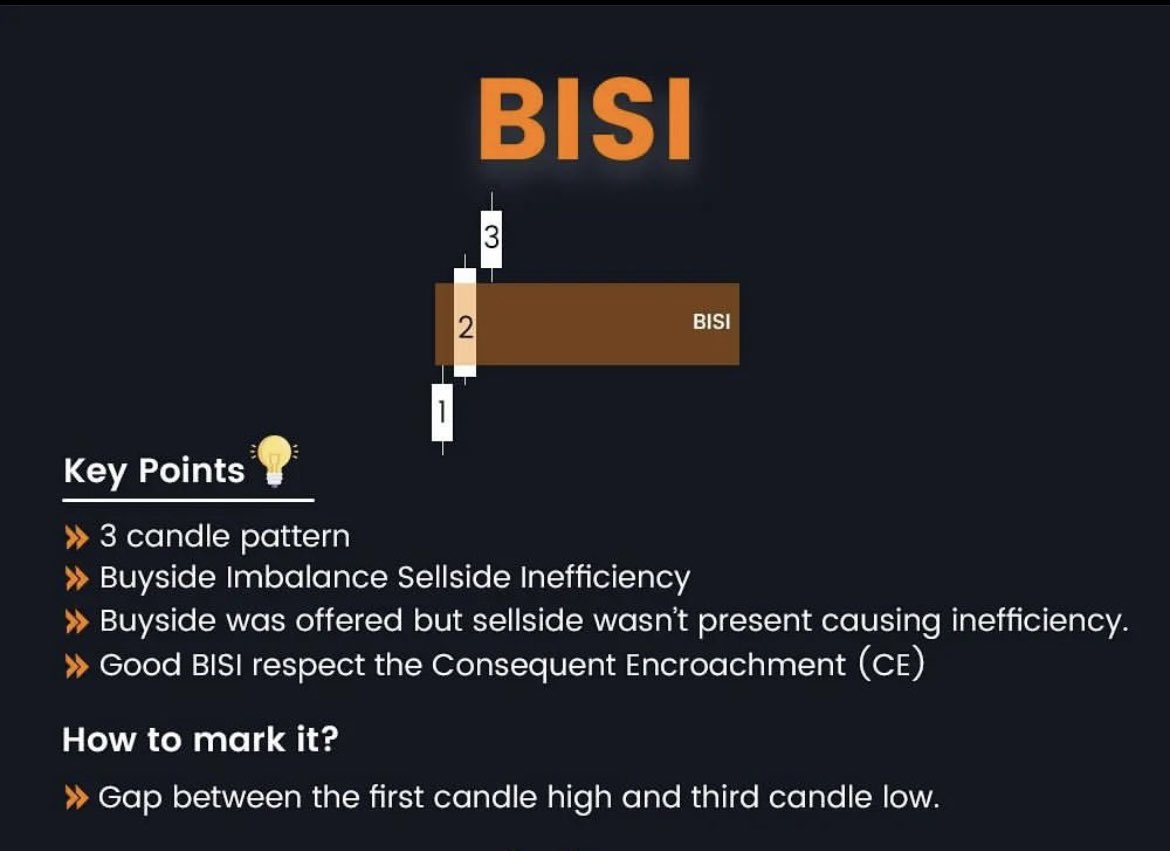
3. BISI

Buyers are in control. The gap of imbalance will be between the first candle high and third candle low.

It’s formed by a 3 candle pattern, in which the second candle is the one with the biggest volume. Image
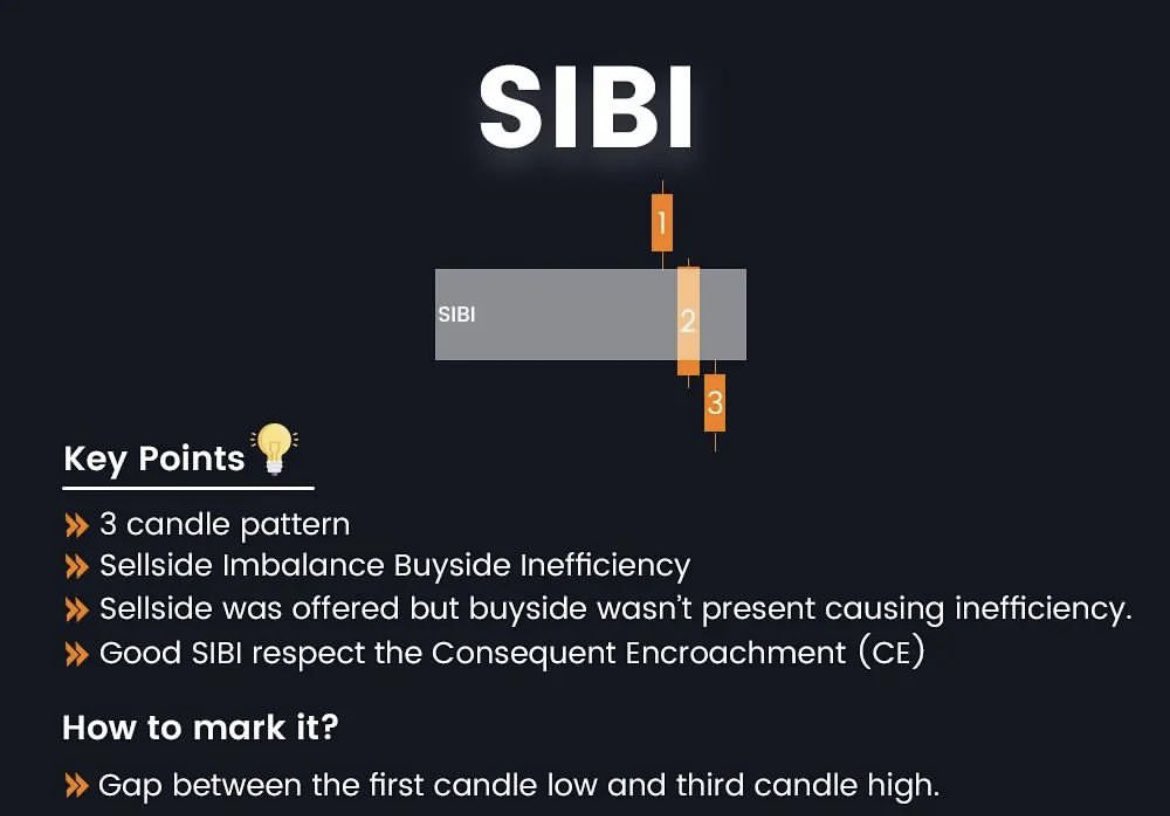
4. SIBI

Sellers are in control. The gap of imbalance will be between the first candle low and third candle high.

It’s formed by a 3 candle pattern, in which the second candle is the one with the biggest volume. Image
5. Inverted FVG

Failed FVG's will act as reactions zones for price (as support or resistance)

SIBI = Acts as support
BISI = Acts as resistance Image
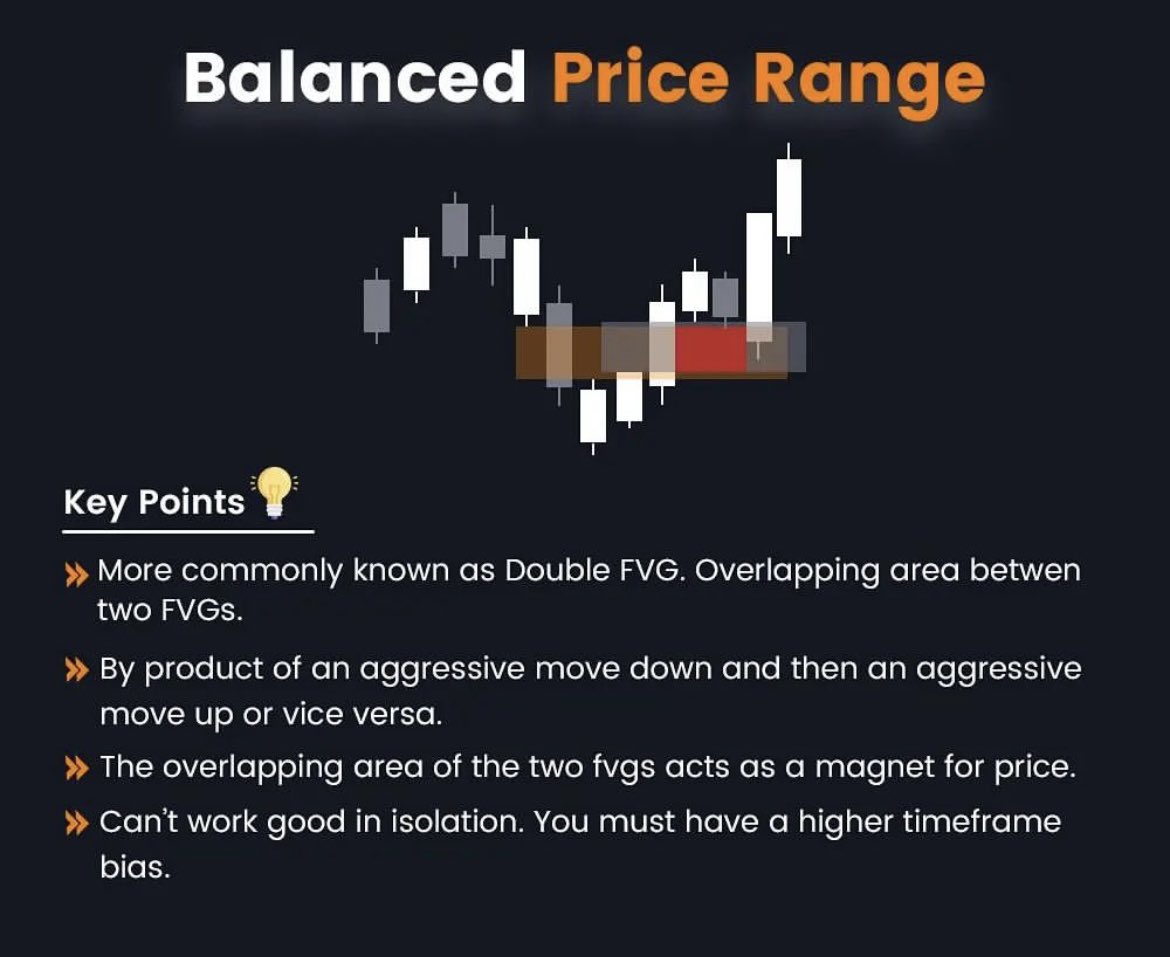
6. Balanced Price Range

It’s commonly known as “Double FVG”

It overlaps between two FVG's. This acts as a magnet for the price. Image
7. How to IDENTIFY High probability FVG's

- Focus on HTF FVG’s

- Must have surpassed previous
FVG's

- Consecutive FVG's in the same direction

- Use OB's as confluence Image

• • •

Missing some Tweet in this thread? You can try to force a refresh
 

Keep Current with CryptoSoulz

CryptoSoulz Profile picture

Stay in touch and get notified when new unrolls are available from this author!

Read all threads

This Thread may be Removed Anytime!

PDF

Twitter may remove this content at anytime! Save it as PDF for later use!

Try unrolling a thread yourself!

how to unroll video
  1. Follow @ThreadReaderApp to mention us!

  2. From a Twitter thread mention us with a keyword "unroll"
@threadreaderapp unroll

Practice here first or read more on our help page!

More from @SoulzBTC

Apr 10
In this THREAD I will explain “How to TIME the Market”

1. High probability setup
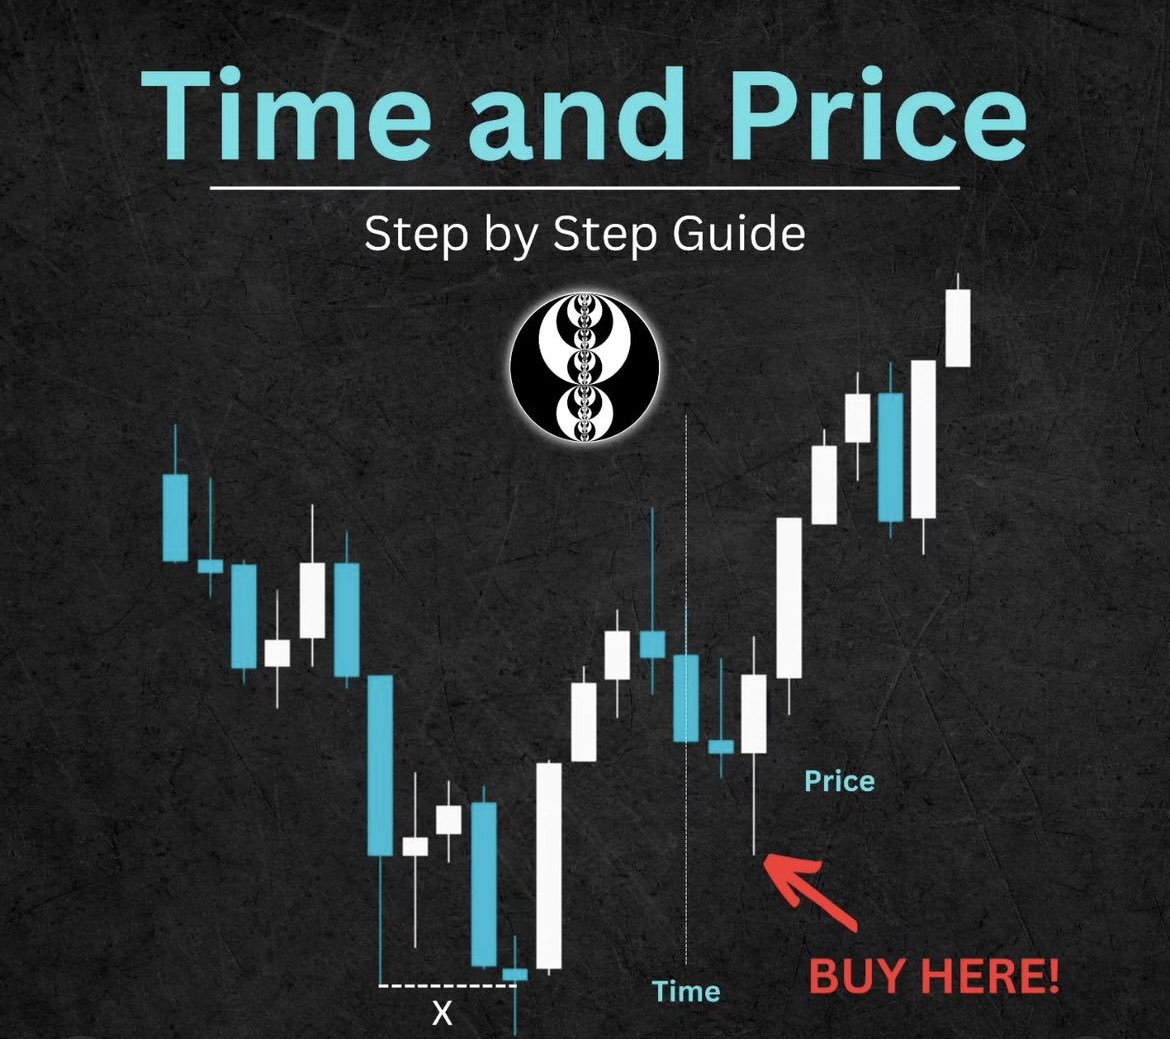
2. What is “Time and Price”
3. Time + Price = TP HIT
4. Trading examples using “Time + price”

🧵(1/7) Image
1. High probability setup:

When time and price aligns on a certain spot, gives a high probability setup for a trade.

Time: Opening of Asian market
Price: Bullish engulfing Image
2. What is “Time and price”

Price movement doesn’t exist without time.

Time and price will form a HTF bias, with it we can exploit fluctuations of price movements in LTF.

If you lack HTF bias, let the market structure and time guide you. Image
Read 7 tweets
Mar 31
In this THREAD I will explain “Order Block variations”

1. What is an “Order Block”?
2. Last Buy/Sell Leg & Candle
3. No wicks
4. Consolidation in Order Blocks
5. Order Blocks in a Range

🧵(1/7) Image
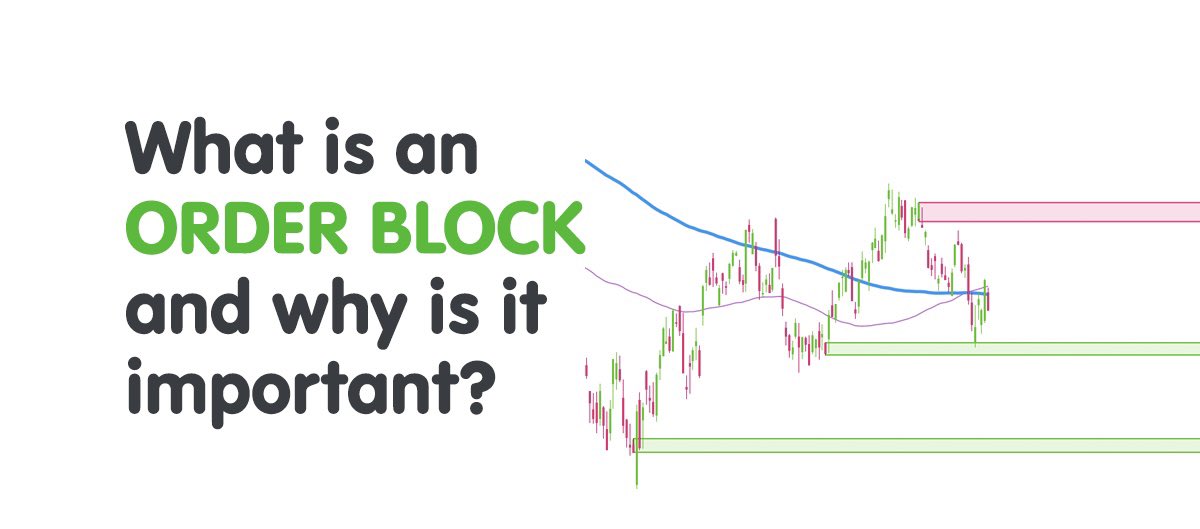
1. What is an “Order block”?

Specific price areas where large market participants, have previously placed significant buy/sell orders.

Many orders are present in these areas, which can have an impact on price movement, liquidity
Image
Image
2. Last BUY/SELL Candle & Leg:

Pullback zones and reversal zones are one of the main examples when OB are explained.

As you can see, price will look for liquidity in both sides.

Sometimes support/resistance may coincide with the present OB.
Image
Image
Read 7 tweets
Mar 25
In this THREAD I will explain "Price & Volume relationship"

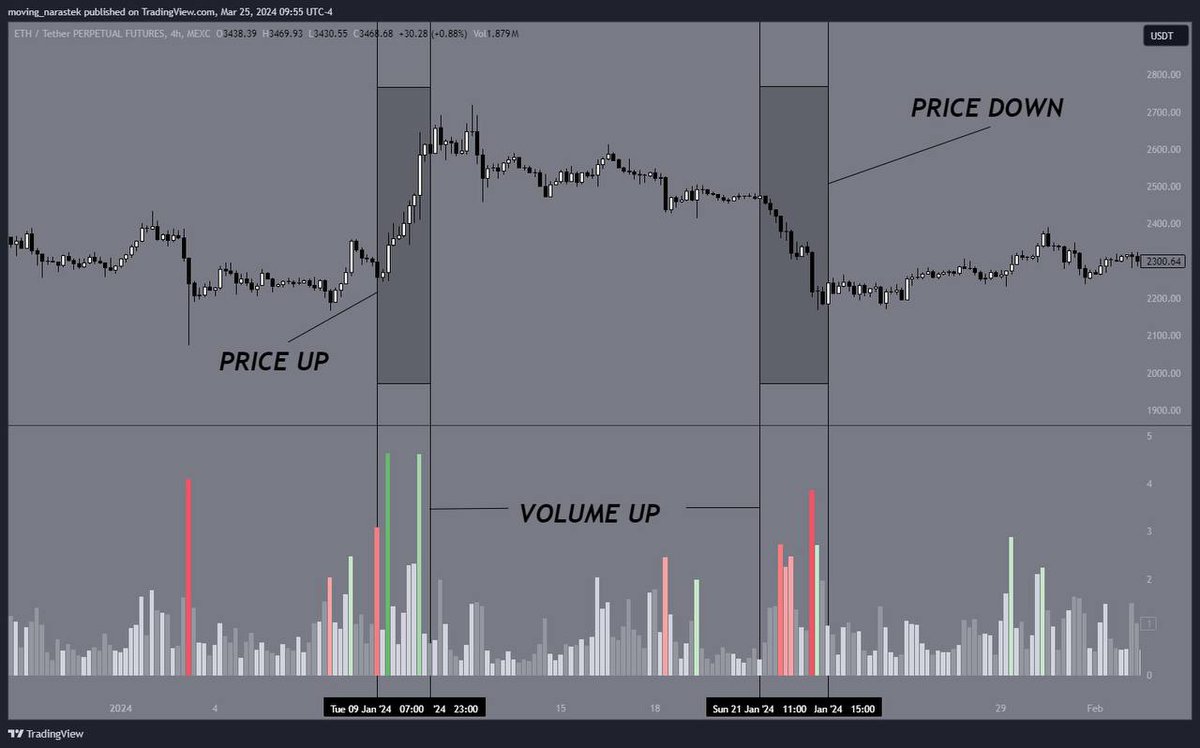
1. Price UP, Volume UP
2. Price UP, Volume DOWN
3. Price DOWN, Volume UP
4. Price DOWN, Volume DOWN
5. Relationship between PRICE, VOLUME and OI

🧵(1/7) Image
1. Price UP, Volume UP:

Volume is important because it has such a significant impact on price from an absolute and relative perspective.

When the uptrend is breaking resistance levels, and backed by increasing volume, is normally a buy.

Volume is an indicator of momentum. Image
2. Price UP, Volume DOWN:

Rising prices on declining volume can indicate declining momentum and potential reversal.

Falling prices on declining volume can equally signal a shift in direction.

As you can see in this example, MS changes to bearish shortly after. Image
Read 7 tweets
Mar 18
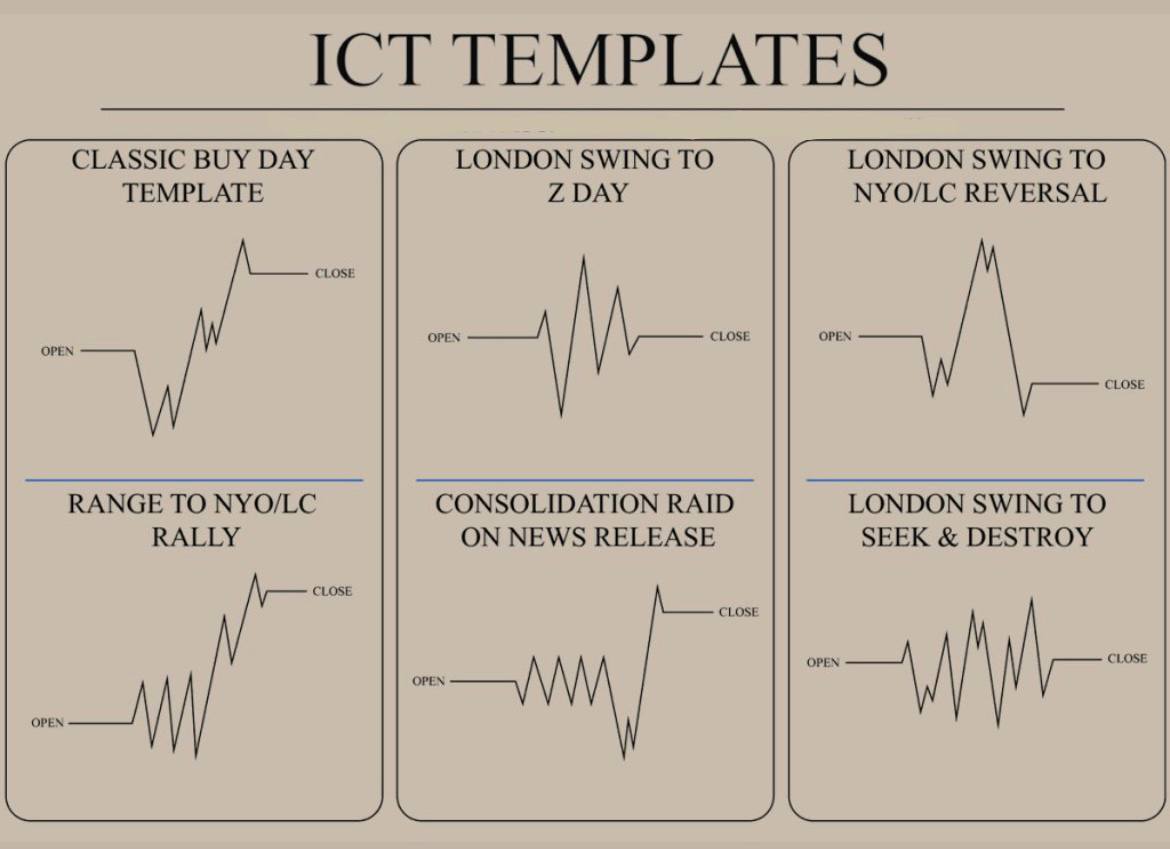
In this THREAD I will explain "ICT TEMPLATES"

1. Classic BUY Template
2. London Swing to Z Day
3. London Swing to NYO/LC reversal
4. Range to NYO/LC Rally
5. Consolidation raid on news release
6. London Swing to seek and destroy

🧵(1/8) Image
1. ICT Classic BUY Template

Takes place during the London session. NY session should provide a retracement to continue with the trend that was set during the London session.

When this profile is established, the LOW of the Day will happen during London session.
Image
Image
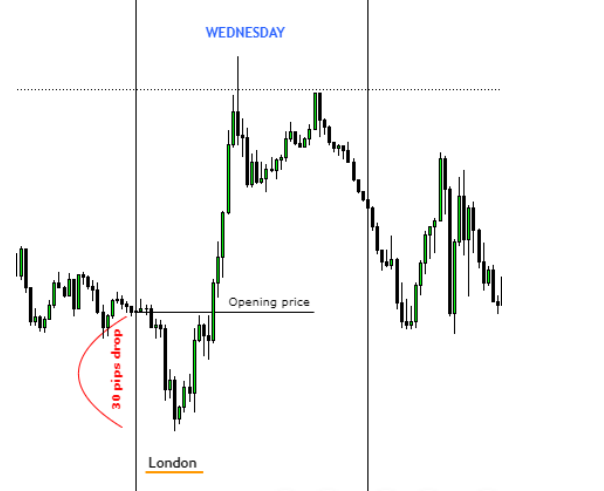
2. ICT LONDON SWING TO Z DAY:

Happens in the middle of a larger price swing when the trend is exhausted, after a large move.

Price will initially drop below the opening price, then run above the opening price and go back to the range.
Image
Image
Read 8 tweets
Mar 12
In this THREAD I will explain "Advanced Market Structure and Liquidity"

1. Swing high and Swing low
2. Protected highs and lows
3. Displacement
4. FVG

🧵(1/8) Image
1. Swing high and Swing low:

A Swing High is when price makes a high and is followed by two consecutive lower highs.

A Swing Low is when price makes a low and is immediately followed by two consecutive higher lows.
Image
Image
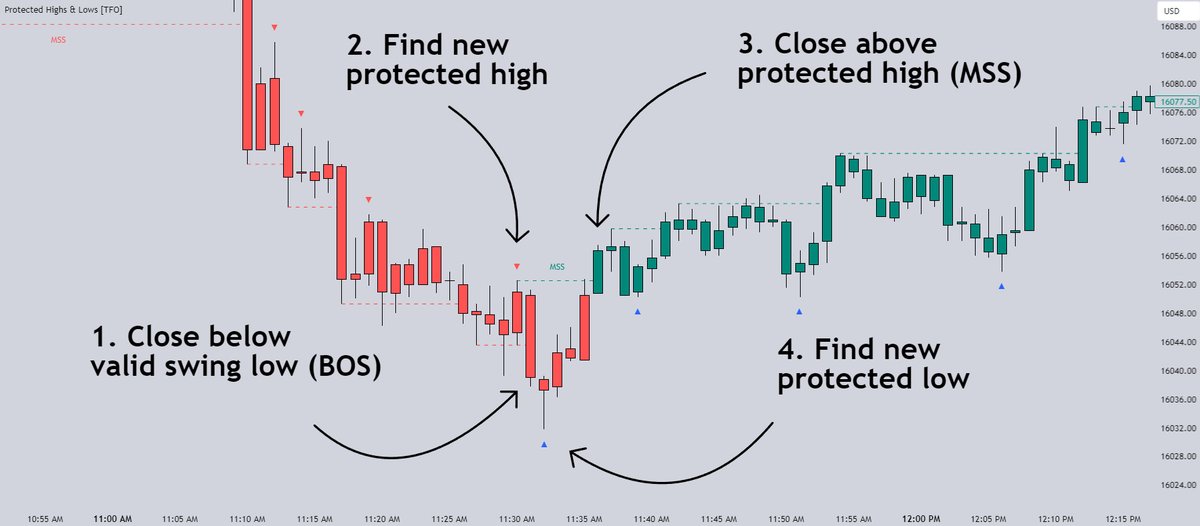
2. Protected highs and lows:

- Bearish scenario
- Bullish scenario

It's common to use fractal highs and lows to identify "significant" swing pivots.

When price closes through these pivots, we may identify a (MSS) for reversals or a BOS for continuations Image
Read 8 tweets
Mar 10
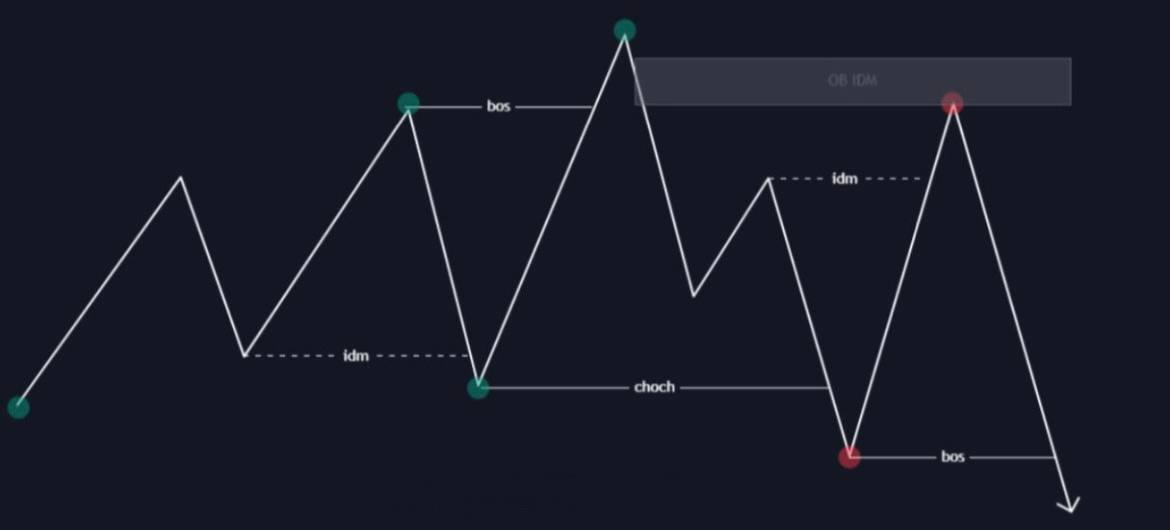
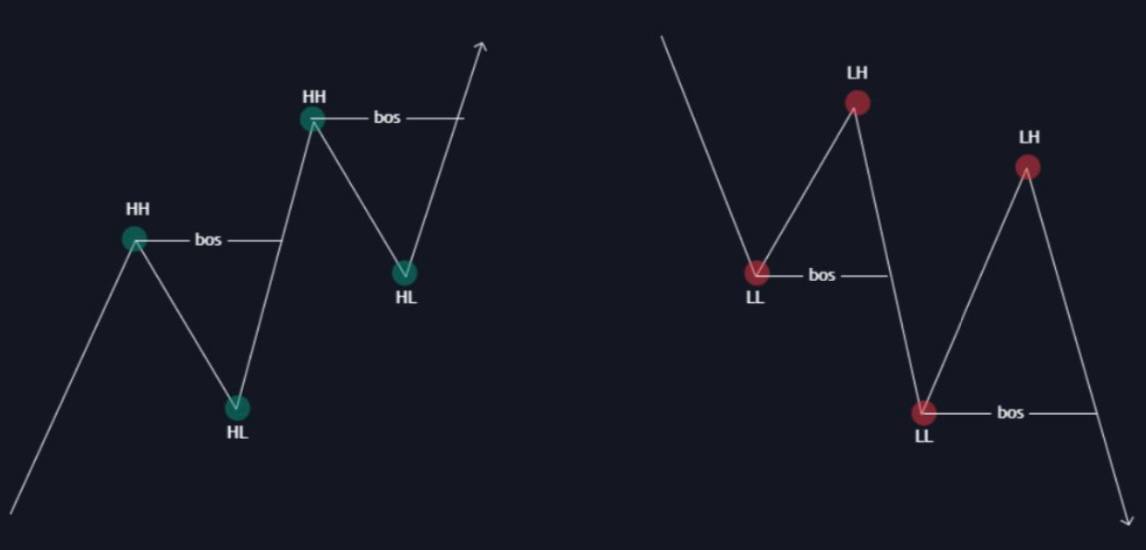
In this THREAD I will explain "Liquidity and Advanced SMC Strategy"

1. BSL and SSL
2. BOS
3. ChoCh
4. Inducement
5. Stop loss hunting

🧵(1/8)
Image
Image
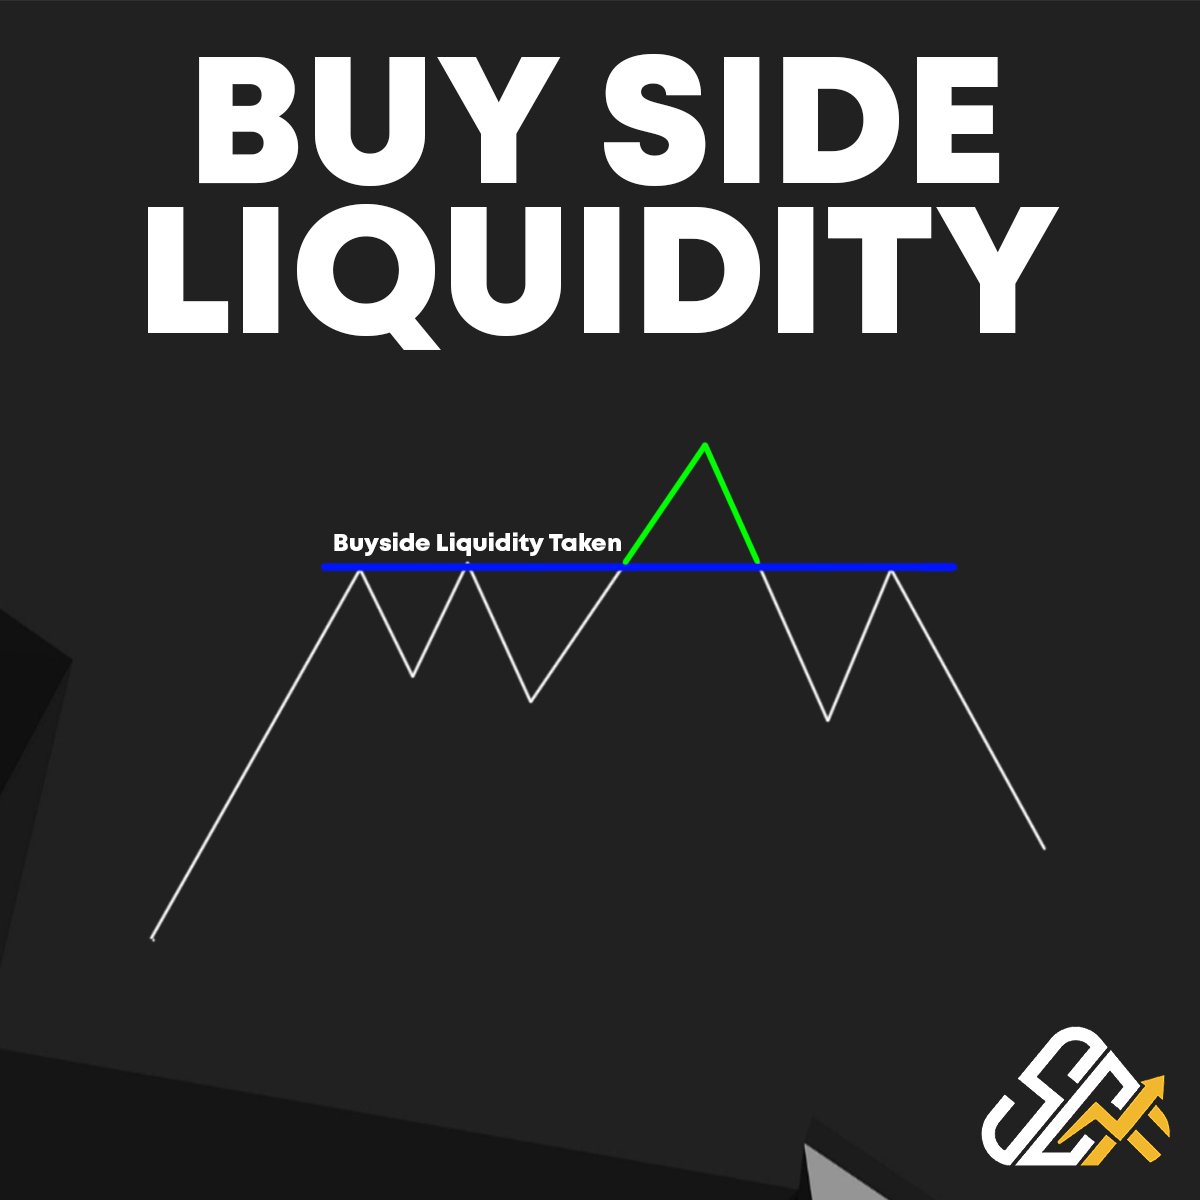
1. Buy-side Liquidity (BSL):

Buy side liquidity is where seller's SL (buy orders) and breakout trader's orders (buy stop limits) are placed to be executed.

It's an accumulation of orders above a range.
Image
Image
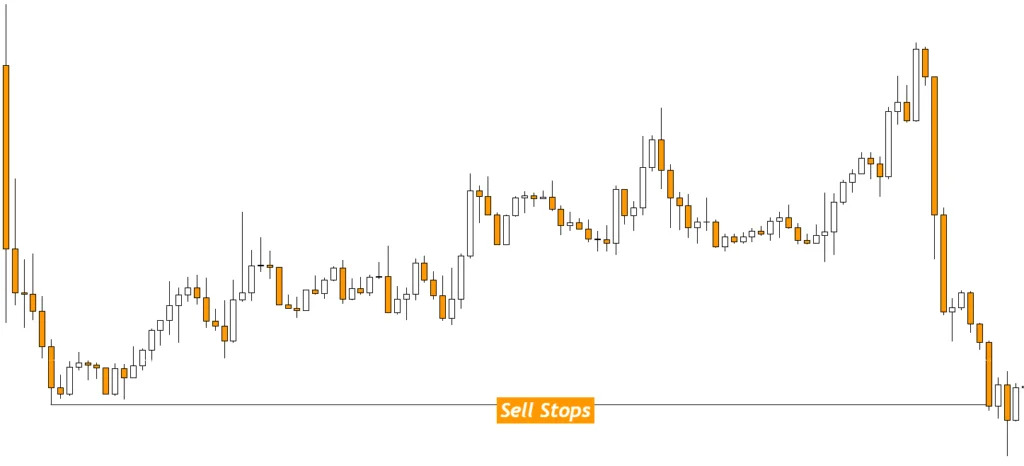
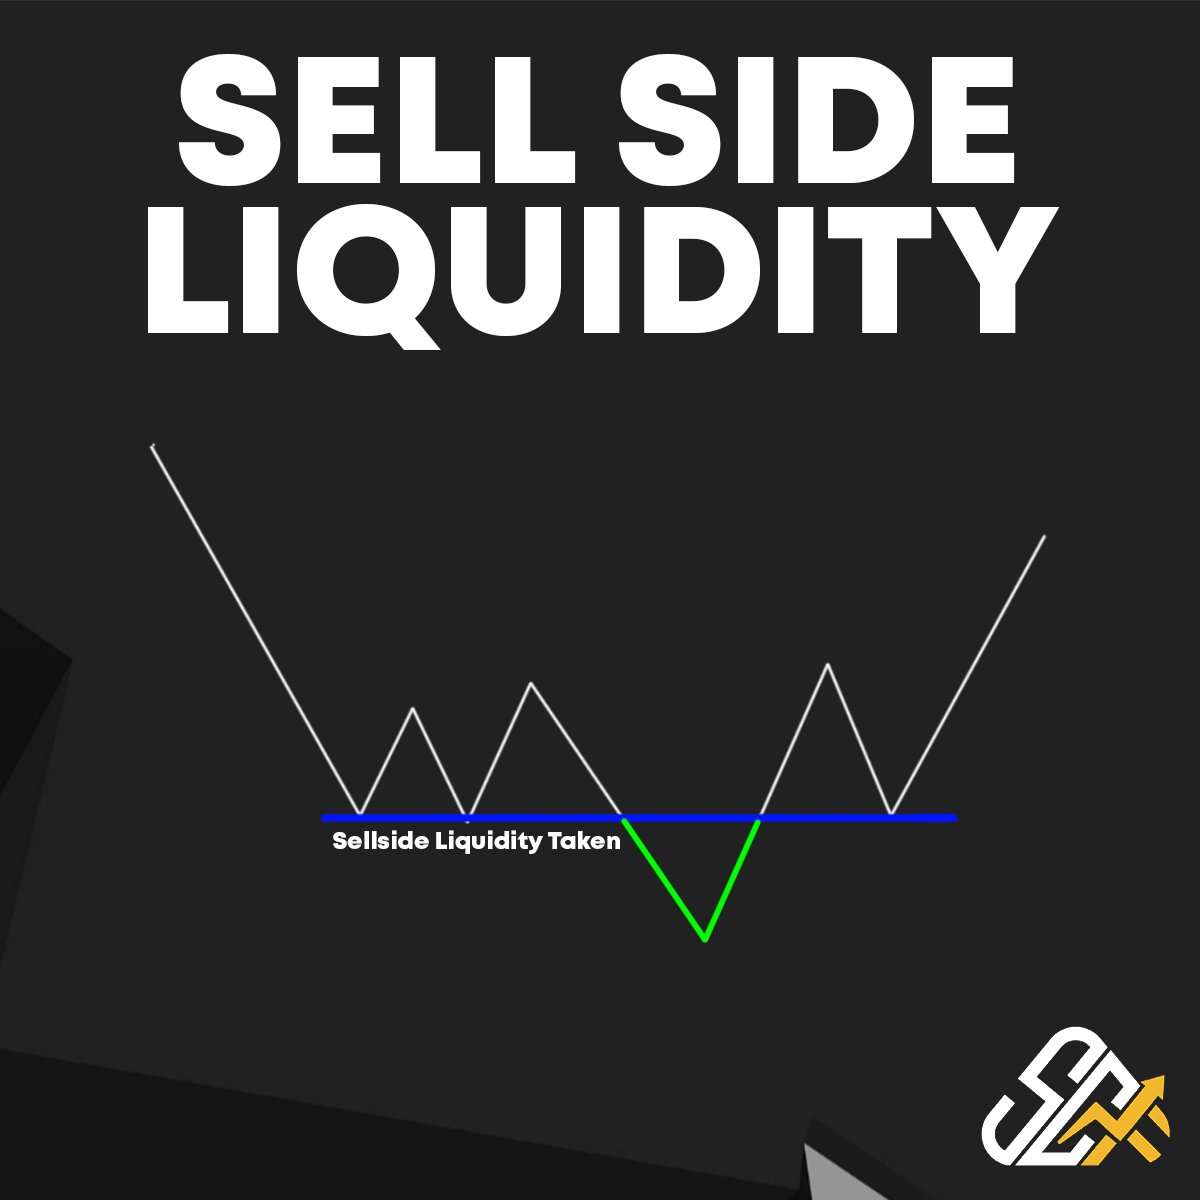
1.2 Sell-side Liquidity (SSL):

Sell side liquidity is where buyer's SL(sell orders) and breakout trader's orders (sell stop limits) are ready to be executed.

It's an accumulation of orders below a range.
Image
Image
Read 8 tweets

Did Thread Reader help you today?

Support us! We are indie developers!


This site is made by just two indie developers on a laptop doing marketing, support and development! Read more about the story.

Become a Premium Member ($3/month or $30/year) and get exclusive features!

Become Premium

Don't want to be a Premium member but still want to support us?

Make a small donation by buying us coffee ($5) or help with server cost ($10)

Donate via Paypal

Or Donate anonymously using crypto!

Ethereum

0xfe58350B80634f60Fa6Dc149a72b4DFbc17D341E copy

Bitcoin

3ATGMxNzCUFzxpMCHL5sWSt4DVtS8UqXpi copy

Thank you for your support!

Follow Us!

:(