The Chinchilla scaling paper by Hoffmann et al. has been highly influential in the language modeling community. We tried to replicate a key part of their work and discovered discrepancies. Here's what we found. (1/9)
We reconstructed the data by extracting the SVG from the paper, parsing out the point locations & colors, mapping the coordinates to model size & FLOP, and mapping the colors to loss values. This let us closely approximate their original dataset from just the figure. (2/9)
When we fit their parametric scaling law, we get strikingly different estimates (Chi-squared p-value <1e-60!). The differences are significant for the data-scaling coefficient β and the irreducible loss E. (3/9)
Hoffmann et al.'s estimated scaling law fits the reconstructed data very poorly compared to ours. Their residuals are not centered at 0 at all! Our model achieves a lower loss on 98% of data points. Clearly, their model does not fit the data. (4/9)
Hoffmann et al. also report extremely narrow confidence intervals for some key parameters. We calculate that you’d need about 600,000 data points to nail it down that precisely. By contrast, they likely had ~400. (5/9)
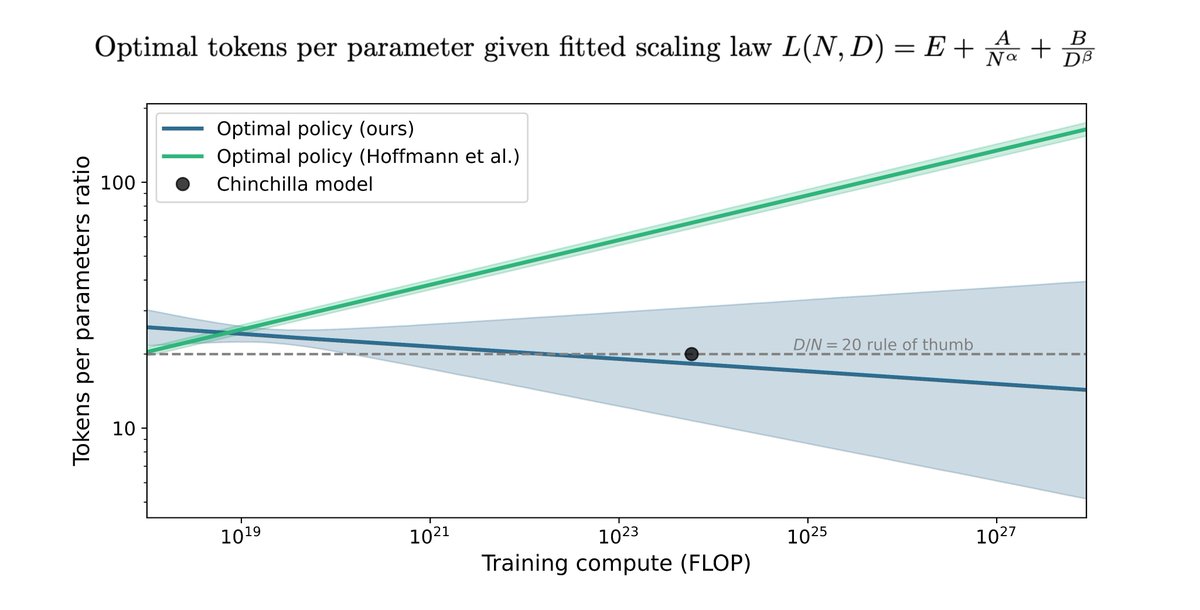
Moreover, Hoffmann et al.'s estimates imply a scaling policy inconsistent with their other results and the token-to-parameter ratio used for Chinchilla. Our estimates align better with these and have more reasonable uncertainty. (6/9)
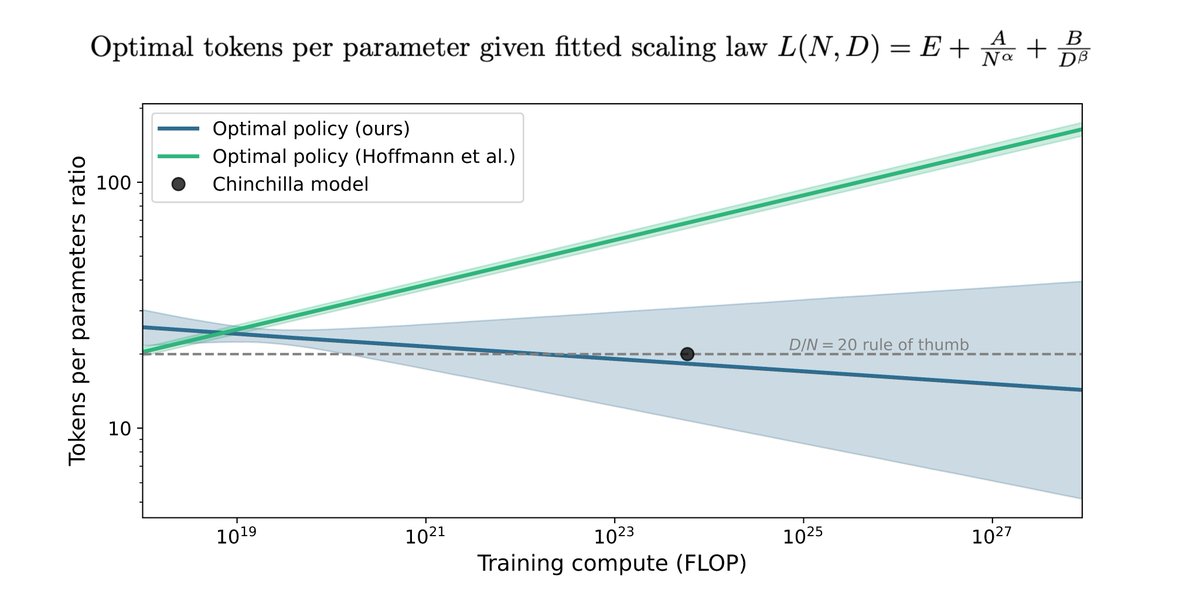
Hoffmann et al.’s paper has been highly influential in the language modeling community. Our analysis highlights some potential issues that warrant clarification. (7/9)
We have asked the authors for assistance, but we haven’t been able to get a response. (8/9)
Here is a short preprint that describes our findings in more detail: (9/9)
Worked on this togther with @EgeErdil2 , @MatthewJBar, and @justjoshinyou13.arxiv.org/abs/2404.10102
Language models have come a long way since 2012, when recurrent networks struggled to form coherent sentences. Our new paper finds that the compute needed to achieve a set performance level has been halving every 5 to 14 months on average. (1/10)
This rate of algorithmic progress is much faster than the two-year doubling time of Moore's Law for hardware improvements, and faster than other domains of software, like SAT-solvers, linear programs, etc. (2/10)
We estimate this using a dataset of over 200 language models from 2012 to 2023, evaluated on WikiText and Penn Treebank. By fitting a modified neural scaling law to this data, we estimate the rate of algorithmic efficiency improvements over time. (3/10)
How much progress in machine learning has been due to advances in algorithms (architectures, optimisers, activation functions, etc.), and how much as been due to the scaling of compute or datasets? @EgeErdil2 and I provide new answers: arxiv.org/abs/2212.05153
We use a dataset of over a hundred computer vision models from the last decade to investigate how better algorithms and architectures have enabled researchers to use compute and data more efficiently.
We find that every 9 months, the introduction of better algorithms contribute the equivalent of a doubling of compute budgets. This is much faster than the gains from Moore’s law! That said, there's uncertainty (our 95% CI spans 4 to 25 months).
I recently organized a contest for @Metaculus on investigations into predictions of the future of AI. This resulted in two-dozen insightful analyses by forecasters into the prospects of transformatively advanced AI systems. Here are my short summaries of some that stood out:
This piece by @EgeErdil2 uses a hyperbolic growth model to argue that an economy could be transformed fairly quickly following the widespread deployment of advanced AI metaculus.com/notebooks/1061…
He finds that a basic model implies that it'd take ~3 months to go from widespread deployment of AI to a radical transformation (with some uncertainty, but not much). At best, we may see transformative AI coming a year or two in advance.
A recent paper about innovation over the long run reveals a very neat snapshot of the composition of inventions over time. Using data on US patents, it identifies the following key waves: nber.org/system/files/w…
1840s—70s: Key manufacturing innovations occur (pneumatic process for cheap steel and sewing machine are invented); Transport (improvements in steam-engines. The Bollman bridge, air brake system, cable car are patented); Consumer Goods (board game, toothbrush, picture machine).
1870s-1900s: Electricity and Electronics (Edison patents the electric light, Bell the telephone. Others invent the microphone, computer motion picture, and the radio). In the 1890s Transport innovation peaks (the automobile, airplane, and the submarine are all patented).
A few months ago, I wrote an economics dissertation on whether machine learning models are getting harder to find. Here’s a summary of what I found:
Some background. @ChadJonesEcon, @johnvanreenen and others wrote an awesome article that found that ideas are getting harder to find: in semiconductors, agricultural production and medicine, research productivity has been declining steadily.
In my dissertation, I explored to how this story holds up for machine learning. I used a dataset on the top performing ML models on 93 machine learning benchmarks—mostly related to computer vision and NLP—and data on research input derived from data on publications.