Crémieux Profile picture
Apr 23, 2024 9 tweets 3 min read Read on X
Does diversity make teams work better?

Apparently not!

A new, comprehensive preregistered meta-analysis found that, whether the diversity was demographic, cognitive, or occupational, its relationship with performance was near-zero. Image
These authors were very thorough

Just take a look at the meta-analytic estimates. These are in terms of correlations, and they are corrected for attenuation

These effect sizes are significant due to the large number of studies, but they are very low, even after blowing them upImage
You may ask yourself: are there hidden moderators?

The answer looks to be 'probably not.' Team longevity, industry sector, performance measures, power distance, year or country of study, task complexity, team interdependence, etc.

None of it really mattered.

Here's longevity: Image
Here's power distance: Image
Here's collectivism: Image
But let's put this into practical terms.

Using these disattenuated effects, if you selected from two groups you expected to have comparable performance otherwise, but one was more diverse, you'd make the 'correct' (higher-performing) decision in 51% of cases (vs. 50%).
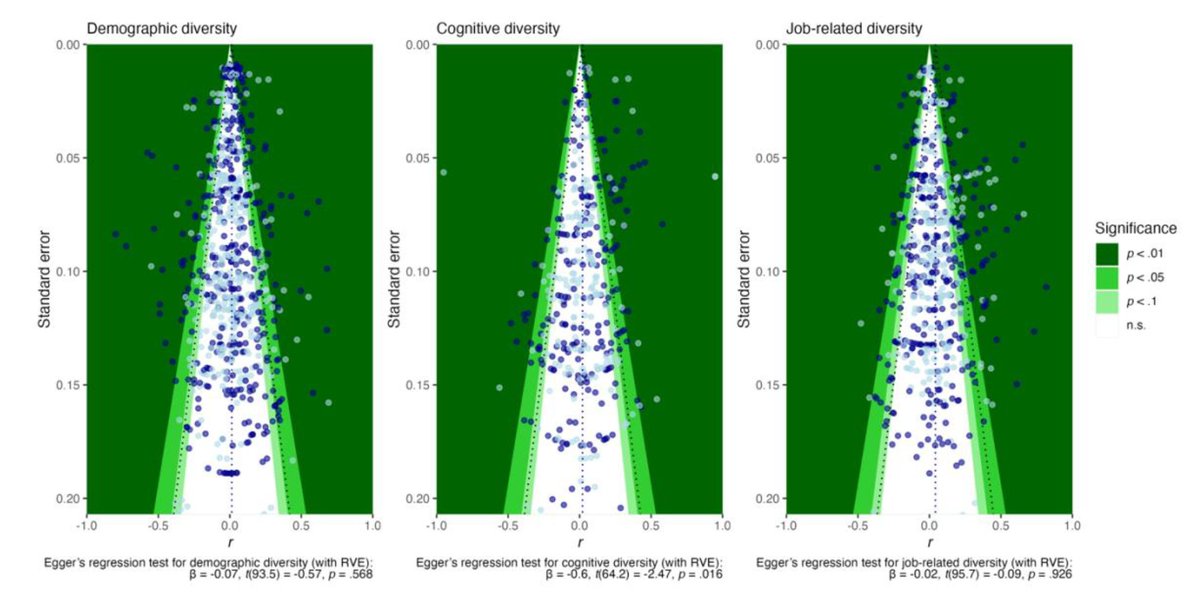
That assumes there really hasn't been any bias in what gets published. If there has been, you might want to adjust your estimate downwards towards zero, or upwards if you think the literature was rigged the other way.
The paper paints an unsupportive picture of the idea that diversity on its own makes teams more performant.

I recommend giving it a read.

• • •

Missing some Tweet in this thread? You can try to force a refresh
 

Keep Current with Crémieux

Crémieux Profile picture

Stay in touch and get notified when new unrolls are available from this author!

Read all threads

This Thread may be Removed Anytime!

PDF

Twitter may remove this content at anytime! Save it as PDF for later use!

Try unrolling a thread yourself!

how to unroll video
  1. Follow @ThreadReaderApp to mention us!

  2. From a Twitter thread mention us with a keyword "unroll"
@threadreaderapp unroll

Practice here first or read more on our help page!

More from @cremieuxrecueil

May 6
Chinese cities occasionally sell land to developers before buying out all the existing residents.

But sometimes existing residents refuse to be bought out, so developers are forced to build around them.

These are "nail houses"🧵
The most famous nail house is undoubtedly Wu Ping's home in Chongqing.

Wu Ping came to national acclaim when she and her husband refused to give up their property to make way for a luxury apartment complex.

They wanted more compensation, and they fought for it for three years. Image
Wu Ping and her husband refused to leave their property during the debate over the Wuquan Fa, Property Rights Law.

The debate was largely centered around whether and how China would protect property rights given their socialist ideals.Image
Read 18 tweets
May 6
I've seen a lot of people recently claim that the prevalence of vitiligo is 0.5-2%.

This is just not true. In the U.S. today, it's closer to a sixth of a percent, with some notable age- and race-related differences.

But where did the 0.5-2% claim come from?🧵 Image
The claim of a 0.5-2% prevalence emerged on here because Google's Gemini cited a 2020 review in the journal Dermatology which proclaimed as much in the abstract.

Simple enough, right? They must have a source that supports this estimate in the review somewhere.Image
They cite four studies for the 0.5-2% claim, so let's look into those studies. Image
Read 27 tweets
May 2
There's a myth that the Islamic world has figured out fertility, but it has not.

They show the same declining fertility rates that other places have. Barring Iraq, the Middle East has lower fertility rates than Israel now. Image
Exceptions: Yemen and maybe Palestine, both of which have terrible data, so their comparative situation is unclear.

But, two things on that:

Firstly, Jewish fertility is ahead of Arab fertility in Israel. Image
Secondly, Israeli fertility might be just ahead or slightly behind Palestinian fertility, depending on the source.

Israeli growth is definitely ahead of Palestinian growth due to immigration, Palestinian emigration, and Palestinian mortality.Image
Read 6 tweets
May 2
Relationships between class and fertility and IQ and fertility used to routinely be negative in the not-so-distant past.

But across the developed world, they're increasingly positive, albeit only slightly. In this Swedish birth cohort (1951-67), the transition came early: Image
In this example, there's also some interesting confounding: between families, IQ isn't monotonically associated with fertility, but within families, it is.

Something seems to suppress the IQ-fertility relationship between families!

See also:
Sweden's positive IQ-fertility gradient (which, above, is just for males, since it's draftee data), has been around for quite a while (but has varied, too), whereas in countries like France, Japan, and the U.S., the gradient shift towards being slightly positive is more recent. Image
Read 6 tweets
May 2
One of the reasons people are so pessimistic about fertility policy is because they misjudge the counterfactual🧵

Consider this. We have a country with a given fertility level: Image
The country intervenes with some fertility policy, and the fertility rate continues to fall.

The program is therefore dubbed a failure. Oh no! Image
But, had the program never been implemented, the fertility rate would have fallen much more.

This is the counterfactual, and it is roundly ignored in favor of the pessimistic conclusion that fertility policy simply does not work. Image
Read 10 tweets
Apr 30
This is a really strong claim based on really scant evidence.

Add in a control for family history or use Bonferroni instead of Benjamini-Hochberg and 5-aminovaleric acid betaine goes nonsignificant. Add in polygenic risk scores too and Cyclo(Leu-Pro) goes nonsignificant.
Using a small number of the total tests (multiple comparison correction was too lax), the model with both metabolites in it alone led to p-values of 0.3512 for 5-AVAB and 0.0188 for Cyclo(Leu-Pro) and that's from a model without family history or genetic risk.
I don't see any good reason why, but the authors preferred to make inferences from a model missing important controls they had available

But to make matters worse, 5-AVAB wasn't measured super well, and the analyses with cLP were not quantitative at all, as most data was missing
Read 7 tweets

Did Thread Reader help you today?

Support us! We are indie developers!


This site is made by just two indie developers on a laptop doing marketing, support and development! Read more about the story.

Become a Premium Member ($3/month or $30/year) and get exclusive features!

Become Premium

Don't want to be a Premium member but still want to support us?

Make a small donation by buying us coffee ($5) or help with server cost ($10)

Donate via Paypal

Or Donate anonymously using crypto!

Ethereum

0xfe58350B80634f60Fa6Dc149a72b4DFbc17D341E copy

Bitcoin

3ATGMxNzCUFzxpMCHL5sWSt4DVtS8UqXpi copy

Thank you for your support!

Follow Us!

:(