ONS LONG COVID DATA:
I’m still working through the raw data released yesterday by ONS revealing the prevalence of Long Covid in England & Scotland.
Some interesting (& concerning) data points are emerging so I wanted to do a quick thread on what it reveals for CHILDREN…
🧵

I’m still working through the raw data released yesterday by ONS revealing the prevalence of Long Covid in England & Scotland.
Some interesting (& concerning) data points are emerging so I wanted to do a quick thread on what it reveals for CHILDREN…
🧵
https://twitter.com/ons/status/1783418864954417185
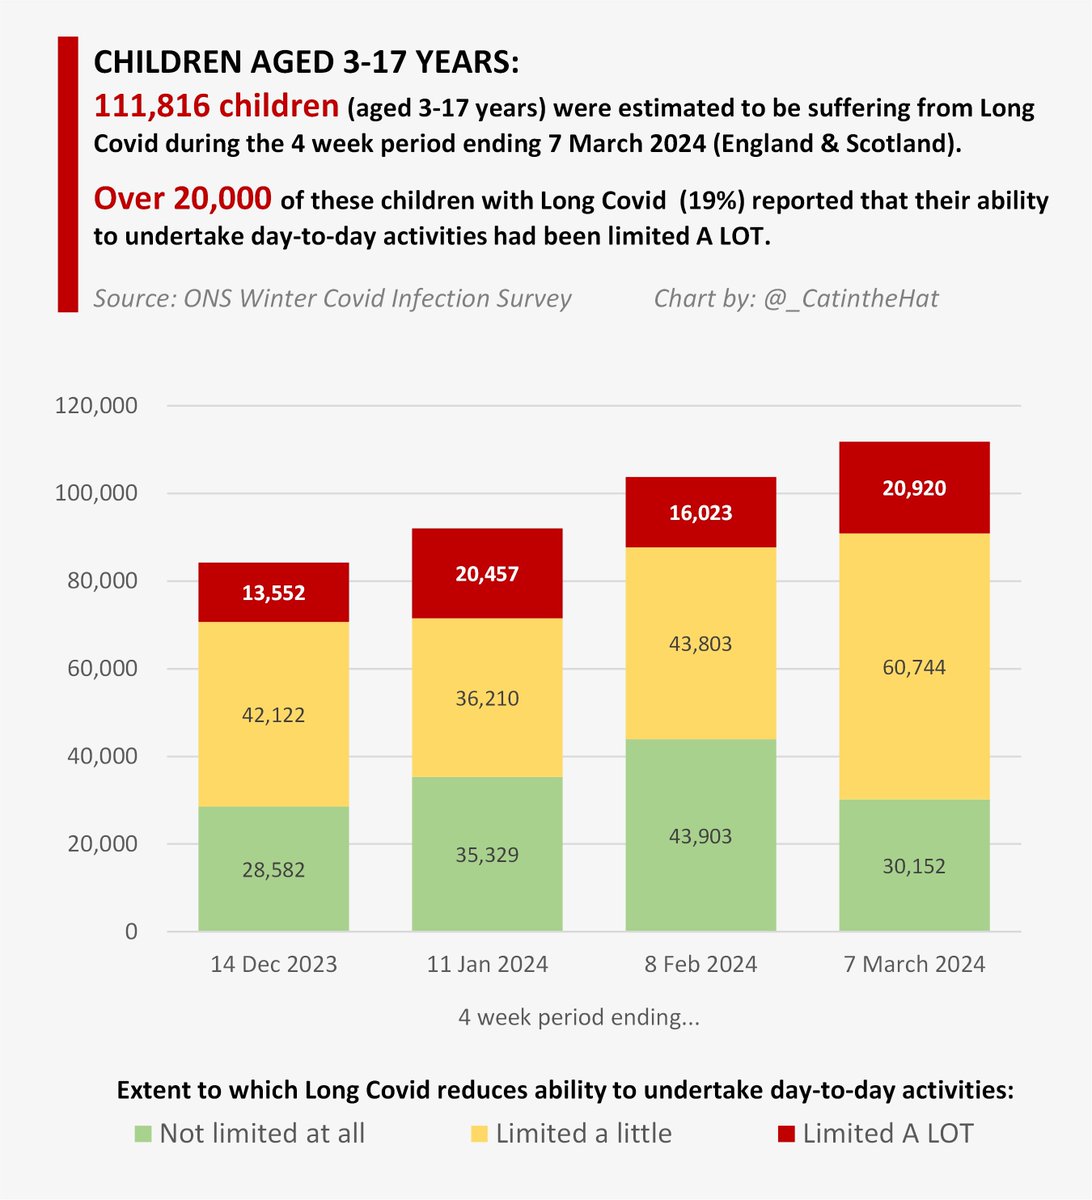
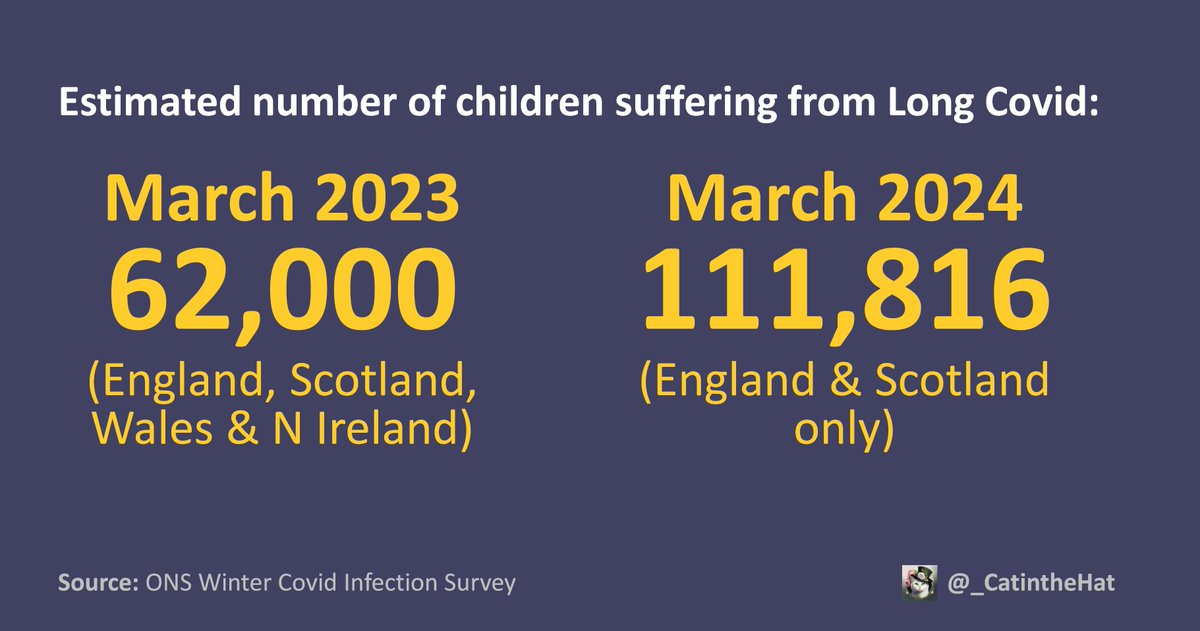
▪️111,816 children (aged 3-17 yrs) were estimated to be suffering from Long Covid during the 4 week period ending 7 Mar 2024 (England & Scotland).
▪️Over 20,000 of these kids with Long Covid reported that their ability to undertake day-to-day activities had been limited A LOT.
▪️Over 20,000 of these kids with Long Covid reported that their ability to undertake day-to-day activities had been limited A LOT.

Worryingly, the data suggests that the number of children with Long Covid is steadily increasing with each passing month…
…from 84k in December 2023 to over 111k in March 2024!
It’s risen by A THIRD in just 3 months.
…from 84k in December 2023 to over 111k in March 2024!
It’s risen by A THIRD in just 3 months.

Frustratingly, the data on duration of Long Covid symptoms is not broken down by age within the raw data, so we only have an overall aggregated view across all ages…

One thing jumps out at me from this chart is:
➡️ 30% of people with Long Covid have been suffering for LESS than a year.
In other words, these are NEW cases that have arisen since the last ONS Long Covid report in March 2023.
➡️ 30% of people with Long Covid have been suffering for LESS than a year.
In other words, these are NEW cases that have arisen since the last ONS Long Covid report in March 2023.

In fact, prevalence of Long Covid in children is now significantly higher than a year ago, in March 2023, when it was last reported.
At that time, 62,000 children were suffering from Long Covid…
… and that was UK-wide data whereas today’s new figures are for 🏴 & 🏴 only.
At that time, 62,000 children were suffering from Long Covid…
… and that was UK-wide data whereas today’s new figures are for 🏴 & 🏴 only.
https://twitter.com/jneill/status/1641425834660560896
Prevalence of Long Covid in children is lower than for adults (in some adult age groups, prevalence is up to 5x higher!)…
…but a small percentage of a big number is still a BIG number.
However you look at it, over 111k children with Long Covid is a horrifically large number.
…but a small percentage of a big number is still a BIG number.
However you look at it, over 111k children with Long Covid is a horrifically large number.

Unless you’ve experienced it yourself, it’s hard to comprehend the devastating impact Long Covid can have on young people.
Please spare a few minutes to watch this ITV News report which illustrates what it’s like for Long Covid kids & their families.
Please spare a few minutes to watch this ITV News report which illustrates what it’s like for Long Covid kids & their families.
The report above was the first in a series of Special Reports by @StaceyPooleITV.
They are hard to watch, but extremely informative.
You can find them all in the playlist below:
youtube.com/playlist?list=…
They are hard to watch, but extremely informative.
You can find them all in the playlist below:
youtube.com/playlist?list=…

The really scary thing is that Long Covid can affect any child, even after a mild initial infection… it’s totally random.
And with no mitigations whatsoever in schools, children keep getting infected over & over again… sometimes multiple times a year.
fortune.com/2023/01/05/ori…
And with no mitigations whatsoever in schools, children keep getting infected over & over again… sometimes multiple times a year.
fortune.com/2023/01/05/ori…

Previous ONS studies have shown that children are JUST AS LIKELY to develop Long Covid after their 2nd infection as those infected for the 1st time.
Just because they’ve had Covid once & were fine, it doesn’t mean they’ll be fine the next time…
ons.gov.uk/peoplepopulati…
Just because they’ve had Covid once & were fine, it doesn’t mean they’ll be fine the next time…
ons.gov.uk/peoplepopulati…

Long Covid does not have one specific set of symptoms.
It can affect any organ in your child’s body.
There are now hundreds of studies about Covid’s serious long-term effects on the lungs, heart, brain, kidneys, immune system… the list goes on & on.
publications.aap.org/pediatrics/art…
It can affect any organ in your child’s body.
There are now hundreds of studies about Covid’s serious long-term effects on the lungs, heart, brain, kidneys, immune system… the list goes on & on.
publications.aap.org/pediatrics/art…
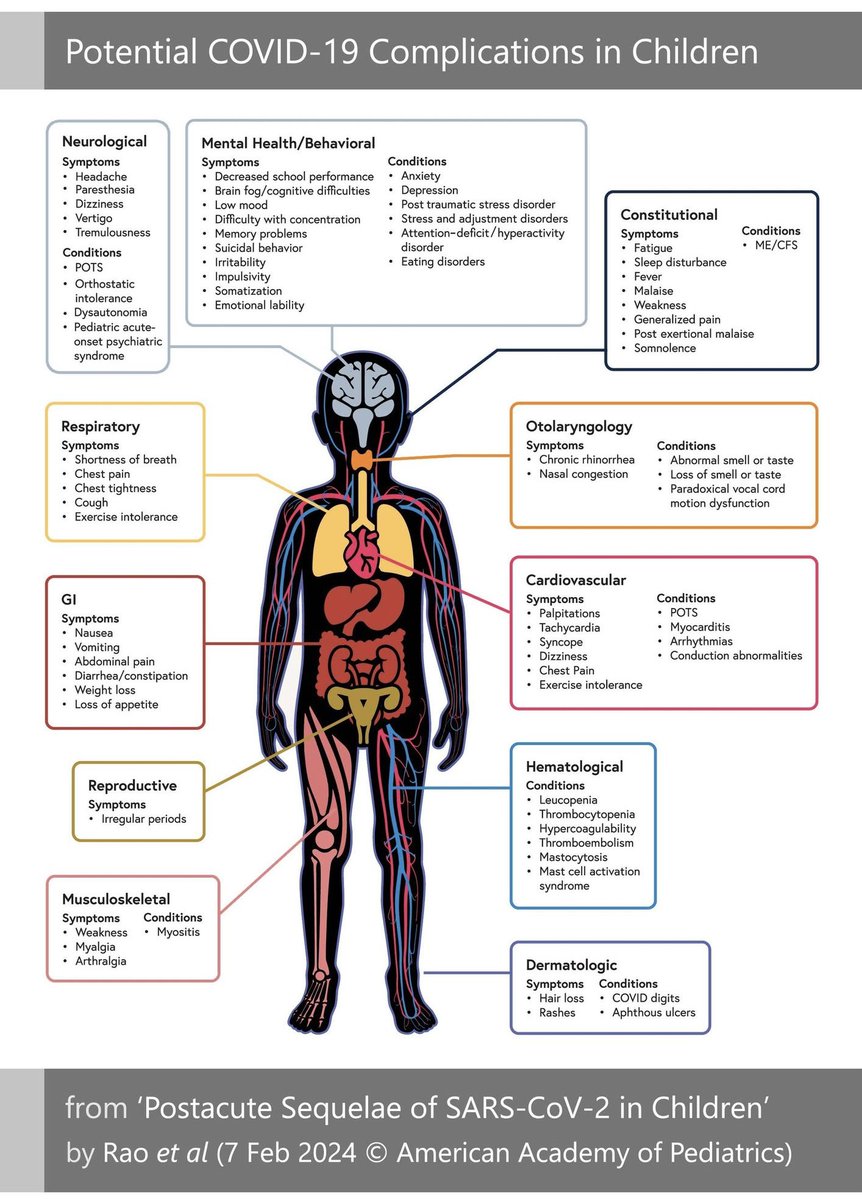
The aspect I’m most concerned about is the long-term damage which Covid can cause to the brain.
We now know that Covid infection can lead to a plethora of new neurological symptoms, including confusion, difficulty concentrating, memory problems, depression & anxiety.
We now know that Covid infection can lead to a plethora of new neurological symptoms, including confusion, difficulty concentrating, memory problems, depression & anxiety.
https://twitter.com/_catinthehat/status/1763878368242524370
“We fundamentally do not know the extent of the long-term damage continual reinfection with COVID will cause to children.
In spite of all the evidence for caution, we are now tossing children into a world with nearly zero protections.”
calgaryherald.com/opinion/column…
In spite of all the evidence for caution, we are now tossing children into a world with nearly zero protections.”
calgaryherald.com/opinion/column…

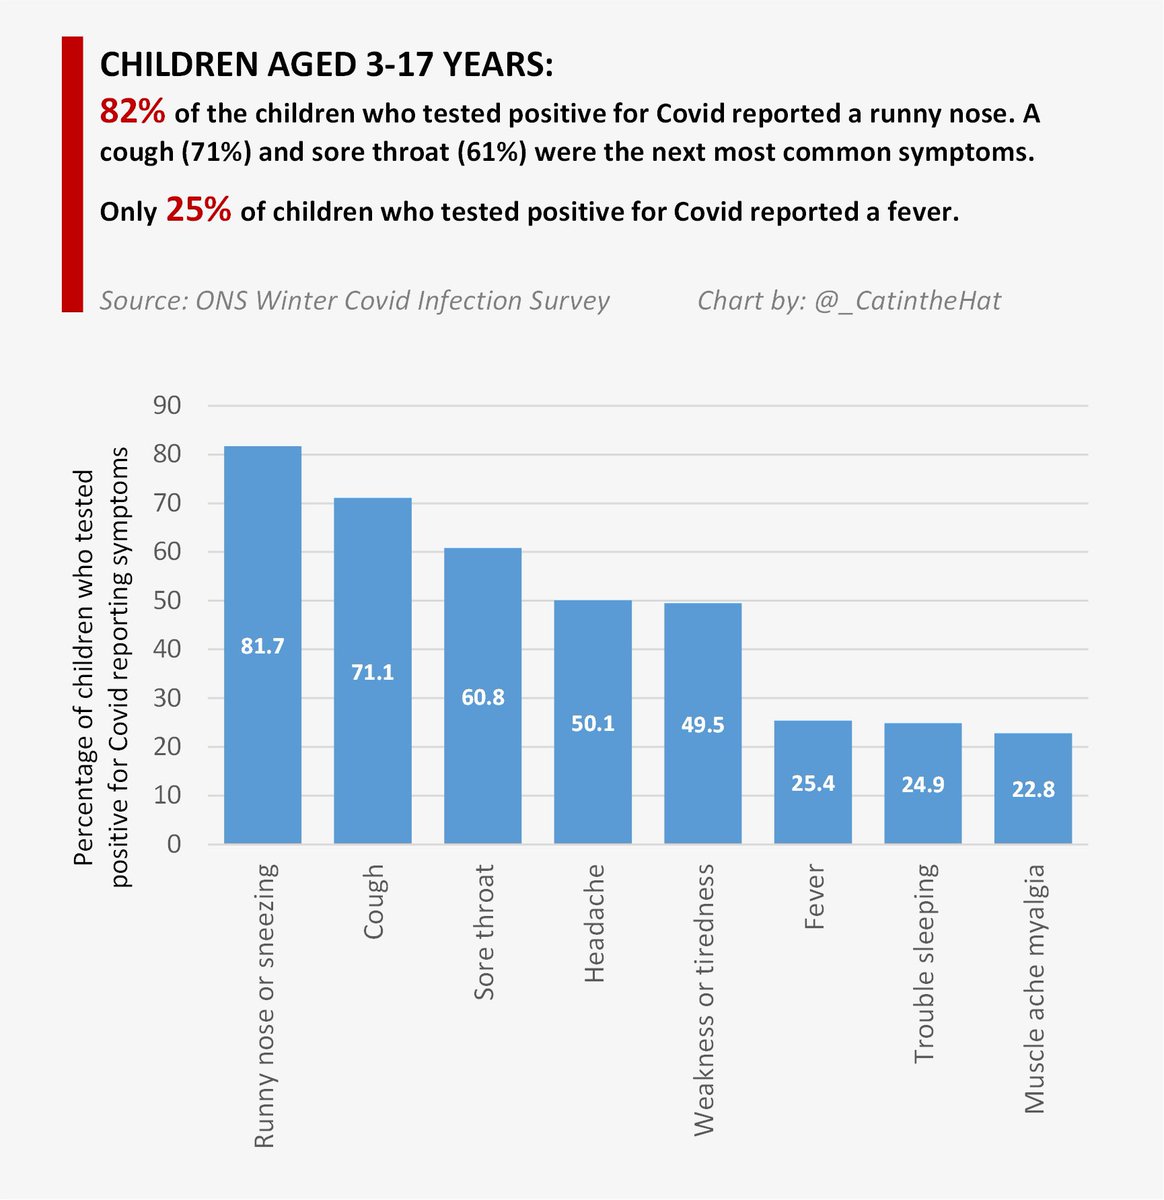
Another useful insight from the ONS data is prevalence of various symptoms amongst children who tested positive.
The most common symptoms for those with Covid were:
▪️runny nose: 82%
▪️cough: 71%
Fever was far less common, reported in just 25% of children who tested positive.
The most common symptoms for those with Covid were:
▪️runny nose: 82%
▪️cough: 71%
Fever was far less common, reported in just 25% of children who tested positive.
And yet, the government’s latest attendance drive actively encourages parents to send sick children to school, unless they have a fever.
But, as the ONS data clearly shows, around 75% of children who are infectious with Covid will NOT have a fever!
But, as the ONS data clearly shows, around 75% of children who are infectious with Covid will NOT have a fever!

And, of course, parents are told NOT to test their kids for Covid, so they’ll just send them to school with their Covid symptoms so they can merrily infect all their classmates.
I don’t blame the parents though - this is the official government guidance!
educationhub.blog.gov.uk/2023/10/11/wha…
I don’t blame the parents though - this is the official government guidance!
educationhub.blog.gov.uk/2023/10/11/wha…

This government guidance is so irresponsible and, frankly, dangerous.
What if there’s a clinically vulnerable child (like my son) in the class?
A runny nose for one kid may mean a lengthy hospital stay for another kid.
What if there’s a clinically vulnerable child (like my son) in the class?
A runny nose for one kid may mean a lengthy hospital stay for another kid.

It’s little wonder so many parents are furious about this ‘insulting’ and ‘dangerous’ attendance campaign which encourages parents to send sick children to school, as covered here in iNews by @AasmaDay.
inews.co.uk/news/education…
inews.co.uk/news/education…

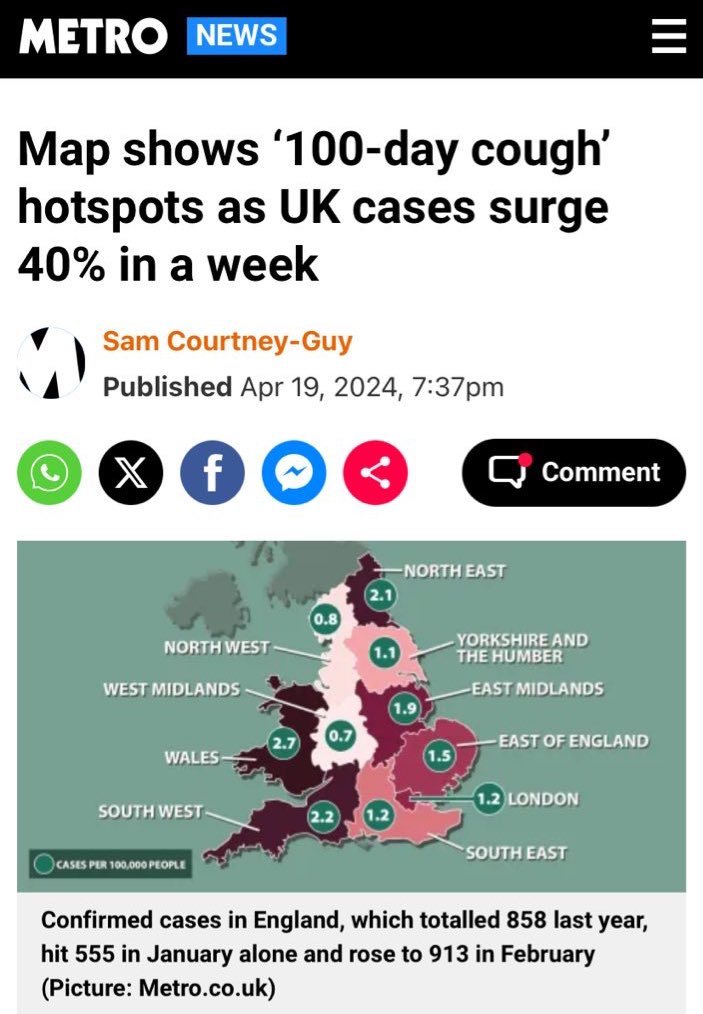
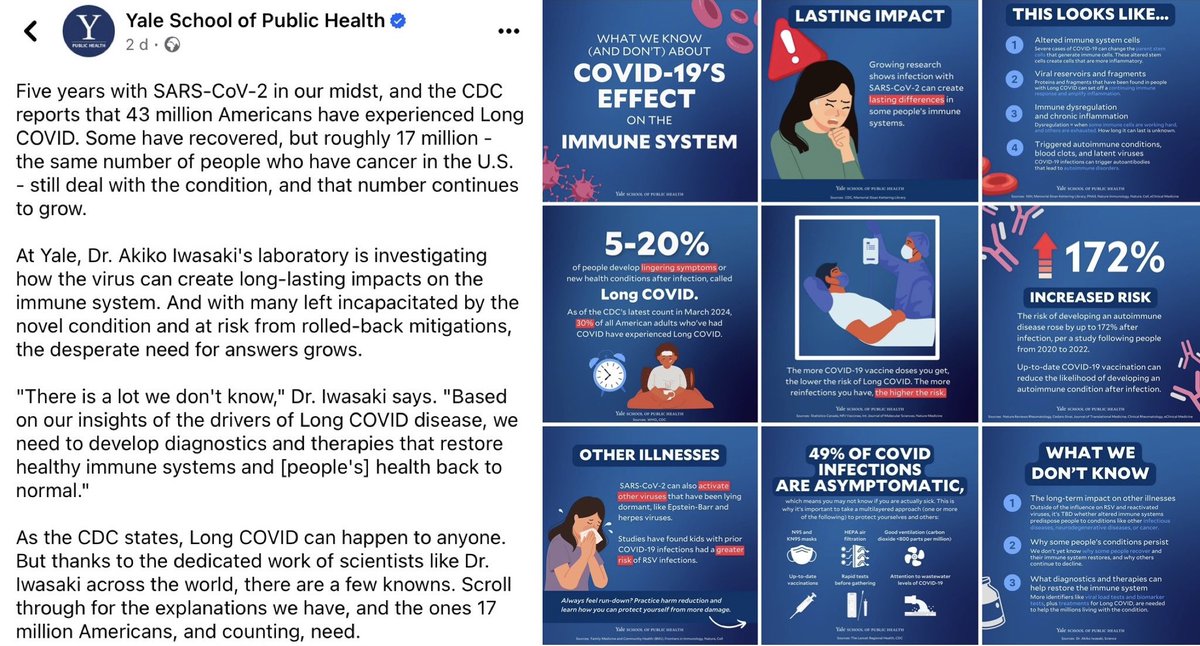
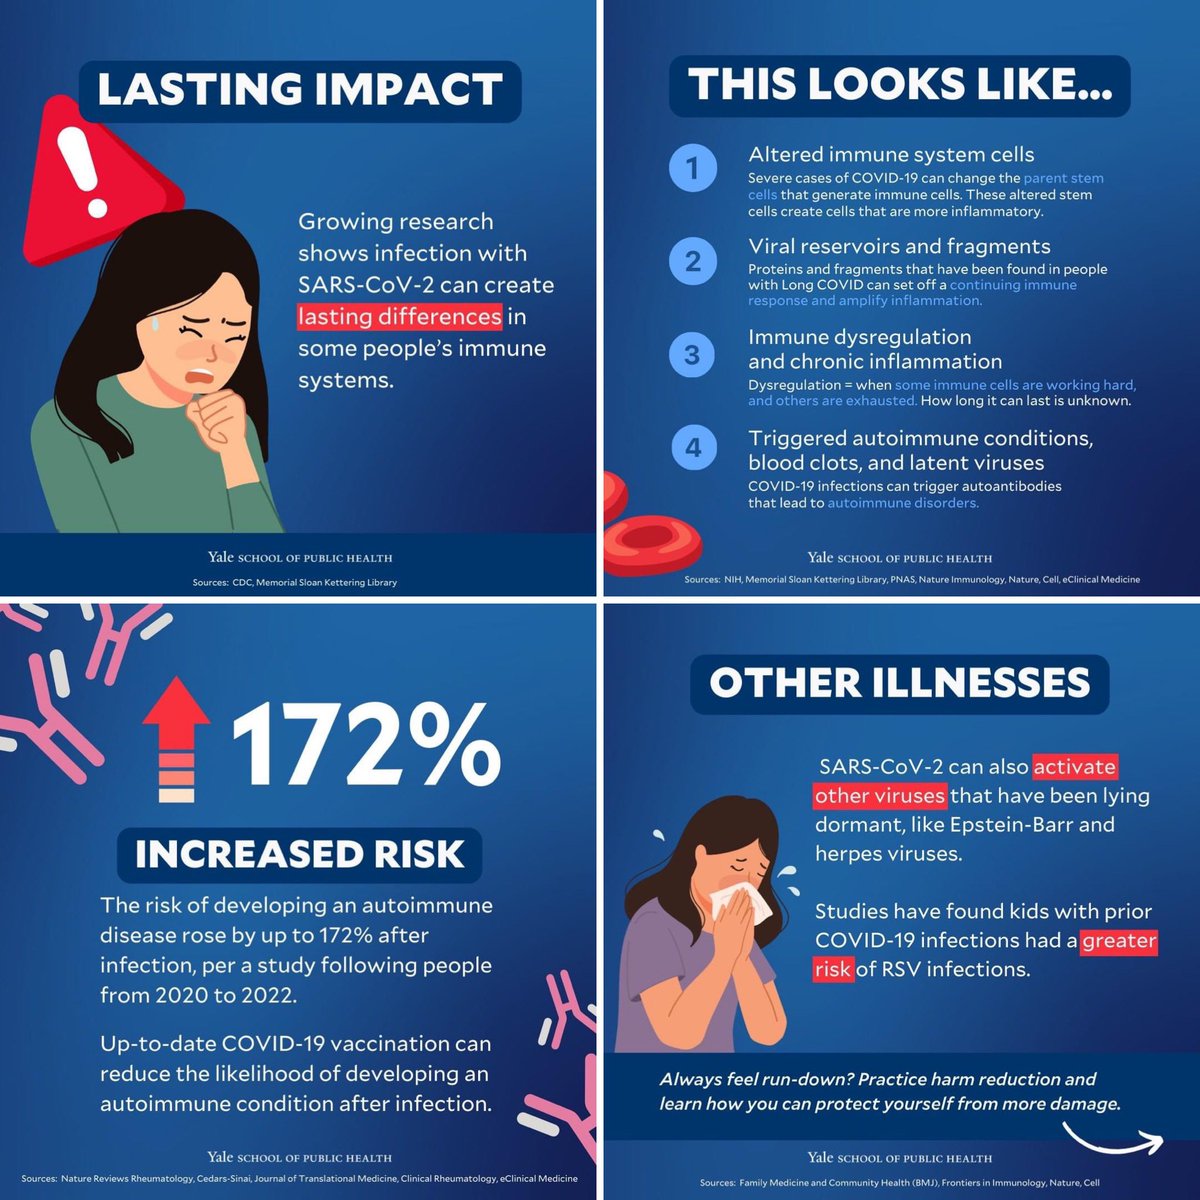
And then there’s the fact that the Covid infections themselves can create lasting differences in some people's immune systems which leaves them more susceptible to other diseases like RSV.
This may well be part of the reason we’re seeing a rapid rise in so many other illnesses.
This may well be part of the reason we’re seeing a rapid rise in so many other illnesses.
https://twitter.com/_catinthehat/status/1782209760630096168
It’s little wonder that pupil absences due to illness remain so stubbornly high!
Since the start of this academic year:
▪️overall absence: 7%
(vs 4.9% in pre-pandemic 2018/19)
▪️illness absence: 3.7%
(vs 2.5% in 2018/19)
➡️ 53% of all absences are due to ILLNESS!
Since the start of this academic year:
▪️overall absence: 7%
(vs 4.9% in pre-pandemic 2018/19)
▪️illness absence: 3.7%
(vs 2.5% in 2018/19)
➡️ 53% of all absences are due to ILLNESS!

And no, this is absolutely NOT normal.
Pre-pandemic, the average illness absence rate was about 2.5%.
Across the 2022/23 academic year, the illness absence rate was 3.7%.
That’s nearly 50% higher than pre-pandemic!
…and so far this academic year, it’s STILL at 3.7%.
Pre-pandemic, the average illness absence rate was about 2.5%.
Across the 2022/23 academic year, the illness absence rate was 3.7%.
That’s nearly 50% higher than pre-pandemic!
…and so far this academic year, it’s STILL at 3.7%.

If the government is serious about wanting to address the school attendance crisis, then they need to be looking at ways to reduce the spread of illness in schools.
And that means telling sick kids to stay home and also improving VENTILATION & AIR FILTRATION in classrooms.
And that means telling sick kids to stay home and also improving VENTILATION & AIR FILTRATION in classrooms.
https://twitter.com/_catinthehat/status/1744510863849967740
• • •
Missing some Tweet in this thread? You can try to
force a refresh