Cat in the Hat šŸˆā€ā¬› šŸŽ© šŸ‡¬šŸ‡§ Profile picture
Mum ā€¢ Lover of nature and clean, fresh air ā€¢ Passionate about science ā€¢ ā€œWithout data, youā€™re just another person with an opinion.ā€
21 subscribers
Nov 3 ā€¢ 6 tweets ā€¢ 4 min read
.@lukethereporter, did you write this horrendous article?!

Itā€™s packed full of misinformation. Please do better.

Read on and Iā€™ll explain whyā€¦ šŸ§µ

dailymail.co.uk/health/articleā€¦Image In the article, you cite the Cochrane review as proving that masks make ā€œlittle to no differenceā€ to someone's risk of catching Covid.

Were you aware that the Editor-in-Chief of Cochrane confirmed that this is an ā€œinaccurate & misleading interpretationā€?

cochrane.org/news/statementā€¦Image
Oct 31 ā€¢ 13 tweets ā€¢ 7 min read
Less than 8 months ago, back when the Tories were still in charge, a Labour MP stood up in parliament to ask a VERY important questionā€¦

He demanded to know what assessment the government had made of Long Covid on the workforce.

That MP was Andrew Gwynne (@GwynneMP)ā€¦

šŸ§µ Less than 4 months later, Labour won the electionā€¦

ā€¦and that MP, Andrew Gwynne, became our Minister for Public Health.

He was recently asked to answer a very similar question to the one he had posed back in March.

His reply was utterly disappointing.

questions-statements.parliament.uk/written-questiā€¦Image
Oct 31 ā€¢ 4 tweets ā€¢ 3 min read
A TALE OF TWO STUDIESā€¦

Two studies have assessed how the cumulative risk of developing Long Covid increases with each Covid infection.

Both studies independently produced almost identical figures, showing that the risk of developing Long Covid rises to ~37% after 3 infections. Image 1ļøāƒ£ STATISTICS CANADA COVID-19 HEALTH & ANTIBODY SURVEY (Dec 2023)

According to this study, the cumulative risk of developing Long Covid is:

šŸšØ15% after 1 infection

šŸšØ25% after 2 infections

šŸšØ38% after 3+ infections.

www150.statcan.gc.ca/n1/pub/75-006-ā€¦ x.com/_catinthehat/sā€¦Image
Oct 28 ā€¢ 4 tweets ā€¢ 2 min read
Letā€™s cut to the chase hereā€¦

1ļøāƒ£ NHS Staff Sickness Absences are still SIGNIFICANTLY higher than pre-pandemic.

2ļøāƒ£ The waves of NHS Staff Absences align almost perfectly with the waves of Covid.

If you want to fix the NHS, start by mitigating the transmission of Covid. Image These charts are courtesy of @1goodtern who, as usual, has done some excellent analysis of the raw data.

His first thread is attached above.

Hereā€™s his second thread which takes a look at the correlation between NHS Staff absences & the waves of Covid hospitalisations.
Oct 27 ā€¢ 24 tweets ā€¢ 12 min read
SPECIAL MESSAGE TO JOE WICKS
(@thebodycoach)

Dear Joe,

You posted a question on Twitter yesterday:

ā€œWhatā€™s your biggest barrier to getting fitterā€.

I wonder if you were surprised about the overwhelming feedback in the commentsā€¦?

šŸ§µ Sadly, to those of us paying attention, it was no surprise at all.

No one talks about Covid anymore...

ā€¦but meanwhile, MILLIONS of people are suffering, many bedridden behind closed doors.

The GP-Patient Survey recently revealed that 4.6% of the population have Long Covid. Image
Oct 26 ā€¢ 4 tweets ā€¢ 3 min read
If youā€™re a UK healthcare worker who is appalled by the inadequate IPC guidance in healthcare, please sign this ā€˜Vote of No Confidence in Dr Lisa Ritchie, Deputy Director for IPC at NHS England.

āœšŸ»Click the link below to digitally sign the letter ā¬‡ļø

forms.office.com/pages/responseā€¦ x.com/workingwithlc/ā€¦Image For details about why you should consider signing this letter, pls read my šŸ§µ below which contains a series of short clips from Dr Ritchieā€™s recent testimony at the Covid Inquiry.

The evidence she gave is extremely concerning & continues to have far-reaching consequences today. Image
Oct 26 ā€¢ 22 tweets ā€¢ 13 min read
LONG COVID in HEALTHCARE WORKERS

A new study from KCL has revealed that:

šŸšØ 34% of healthcare workers in England are now suffering from Long Covid.

In this thread šŸ§µ, I take a deep dive into the implications of this shocking statisticā€¦

kcl.ac.uk/news/long-coviā€¦Image In July 2023, The BMA published a report which presented the results of a survey of doctors with Long Covid.

It concluded:

ā€œThe impact on doctors' ability to work is considerable & devasting, with nearly 1 in 5 responding doctors left unable to work.ā€

bma.org.uk/media/7318/bmaā€¦Image
Oct 22 ā€¢ 8 tweets ā€¢ 4 min read
āš ļøNEW UKHSA DASHBOARDāš ļø

Its prime purpose appears to be to minimise the impact of Covid.

Why else would this ā¬‡ļø be your landing page?
ā–ŖļøPositivity rate for flu & RSV
ā–ŖļøCases for Covid

Come on @UKHSA, this isnā€™t clever or funny.

Why not show comparable metrics?

šŸ§µ Image ā€¦because when you *do* show comparable metrics, itā€™s not nearly such a rosy story in terms of the current Covid situation, is it?

Can someone please remind me what the point of a ā€˜Health Security Agencyā€™ is?

Isnā€™t it to keep the public informed about potential health risks? Image
Oct 22 ā€¢ 25 tweets ā€¢ 11 min read
COVID PREVALENCE IN ENGLAND

A few folks have asked me what my best guess is re: Covid prevalence right now.

The truth is, we canā€™t be sure.

Covid surveillance has diminished so far that thereā€™s no robust data anymore.

But there are at least a few clues from these two chartsā€¦ Image These charts show the two most robust metrics available:
1. PCR positivity rate
2. Covid hospitalisations.

Now letā€™s compare where we are now vs the peak of last Winterā€™s wave.

ā–ŖļøLast Winterā€™s wave is highlighted in purple.

ā–ŖļøThe orange line is where we are now (as of 12 Oct). Image
Oct 18 ā€¢ 5 tweets ā€¢ 3 min read
EXCESS DEATHS (England & Wales):

Whenever you see ā€˜excess deathā€™ figures for 2024, remember that the ā€˜excessā€™ is calculated against an estimated ā€˜expectedā€™ valueā€¦

ā€¦so if the ā€˜expectedā€™ value is wrong, then the ā€˜excessā€™ figure will be meaningless.

And it *is* wrongā€¦

1/ Image ā€¦unless you believe that thereā€™ll be MORE deaths this year than the very worst & most deadly period of the pandemic in 2020?

(Itā€™s actually quite worrying that the experts at ONS believe that the effect of the ongoing pandemic on mortality rates to be THAT significant).

/2
Oct 16 ā€¢ 5 tweets ā€¢ 2 min read
Government guidance tells parents that itā€™s totally fine to send children to school if they have Covid symptoms and that children should NOT be tested for Covid (unless specifically told to do so by a doctor).

Who thinks this policy will help IMPROVE pupil attendance rates? šŸ¤” Link to current government guidance for people with symptoms of a respiratory virus, including Covid-19:

gov.uk/guidance/peoplā€¦Image
Oct 11 ā€¢ 5 tweets ā€¢ 2 min read
Thereā€™s a couple of interesting charts in this weekā€™s National flu & Covid surveillance report.

1. This chart shows Acute Respiratory Infection incidents:

šŸŸ¢ See that tiny green sliver at the top of each bar? Thatā€™s FLU.

šŸŸ£ See that huge purple band in each bar? Thatā€™s COVID. Image 2. This chart looks at the seasonality of Covid.

āž”ļø There is NO seasonality to Covid.

It comes in waves throughout the year, in any season - Spring, Summer, Autumn and Winter.

The height of the peaks is just as bad (sometimes worse) in Summer vs Winter. Image
Oct 6 ā€¢ 10 tweets ā€¢ 6 min read
Back in Nov 2021, the govt released a campaign across digital channels, radio & newspapers highlighting how Covid particles are AIRBORNE & hang in the air like smoke.

The campaign was titled: ā€œSTOP COVID-19 HANGING AROUNDā€

Below is one of the short films from the campaign ā¬‡ļø More details about this nationwide campaign to ā€œSTOP COVID-19 HANGING AROUNDā€ can be found at the link below:

gov.uk/government/newā€¦Image
Oct 6 ā€¢ 24 tweets ā€¢ 11 min read
COVID INQUIRY

Iā€™ve posted a number of tweets from the Inquiry hearing on 16 Sept.

This was the day that Dr Lisa Ritchie took the stand. She chaired the IPC Cell which wrote the Covid infection control guidance for UK hospitals.

Iā€™ve collated all the tweets in this thread šŸ§µ Just to give a little background, Dr Lisa Ritchie is nurse who specialises in Infection Prevention & Control (IPC).

She is currently Head of IPC at NHS England.

Her title is Dr because she has a PhD, but she is not a medically qualified doctor.

dailyrecord.co.uk/news/local-newā€¦Image
Oct 3 ā€¢ 10 tweets ā€¢ 4 min read
Earlier this year, Economist Impact convened an international Advisory Council to reach a consensus on how Long Covid should be defined, understood & addressed globally.

The Advisory Council have now published their (unanimously ratified) Consensus Statement on Long Covid.

šŸ§µ Image Introduction

Without a concerted effort to develop a standardised framework for long Covid, the global community's ability to understand and address this condition will remain limited, posing ongoing challenges for individuals, healthcare systems and society. Image
Sep 30 ā€¢ 4 tweets ā€¢ 2 min read
Riddle me thisā€¦ā“ā“

Anaesthetists & intensive care doctors working in the HIGHEST risk areas where aerosol generating procedures (AGPs) were being performed on Covid patients ended up being at far LOWER risk than other HCWs in terms of infection & Covid-related mortality.

Why? Thereā€™s an obvious answer to thisā€¦

ā€¦but obvious answers were not forthcoming from Dr Lisa Ritchie (Head of IPC at NHS England).

Somewhat perplexed by the answers heā€™s receiving, Counsel tries again to tease out a straight answer from her, but once again hits a brick wall.
Sep 29 ā€¢ 8 tweets ā€¢ 3 min read
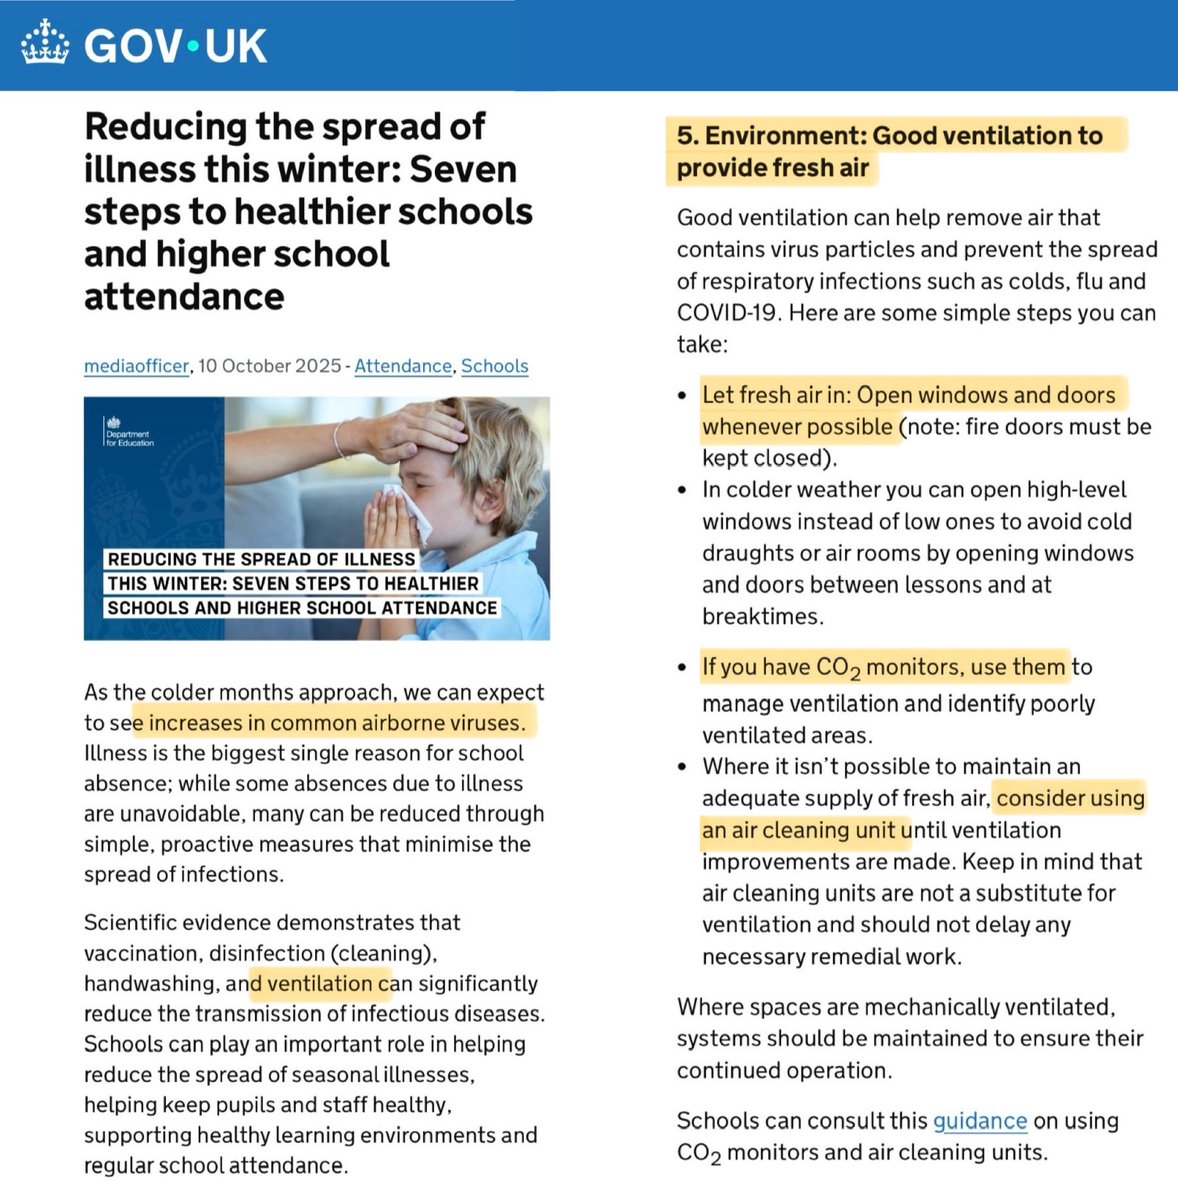
This is the Pupil Attendance Ladder from a school in Essex, England.

Just read the words written alongside each attendance threshold. šŸ¤¬

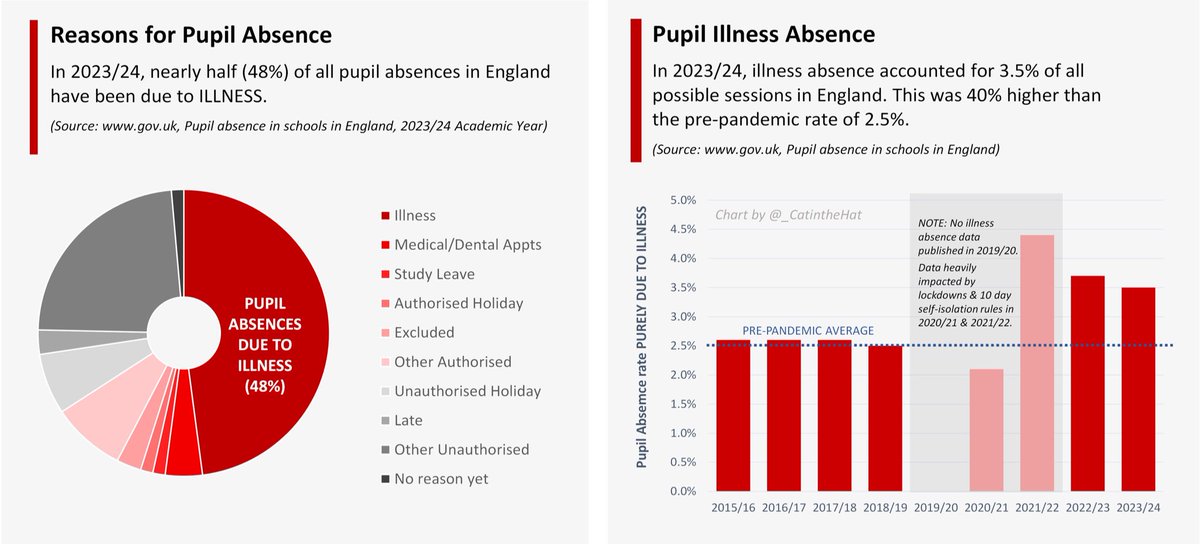
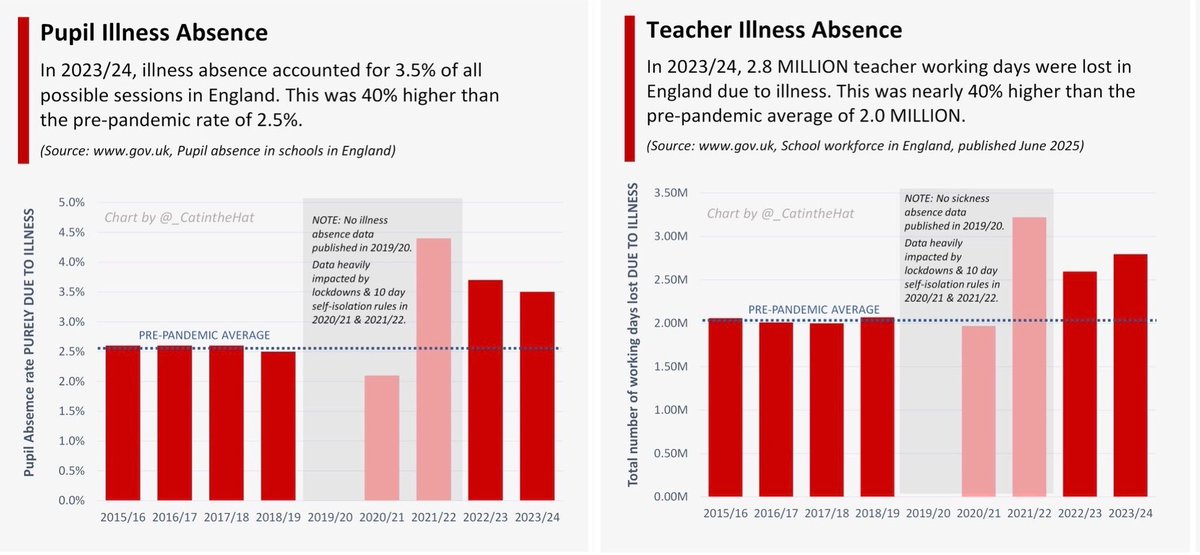
Schools are making ZERO attempt to reduce the spread of illness and yet the children themselves are blamed when they are repeatedly off sick. Image Attendance data shows that the primary driver of pupil absences is ILLNESS.

In 2023/24:

ā–Ŗļø49% of all pupil absences were due to ILLNESS.

ā–ŖļøPupil illness absence accounted for 3.5% of all possible sessions in England.

ā–ŖļøPupil illness absence was 40% higher than pre-pandemic. Image
Sep 28 ā€¢ 6 tweets ā€¢ 3 min read
Schools from United Learning in England are forcing students & parents to sign an ā€˜Attendance Pledgeā€™ which requires them to:

ā€œALWAYS COME INTO SCHOOL, EVEN IF YOU FEEL UNWELLā€

šŸ¤Æ This is unbelievable!

This will NOT reduce illness absence, it will just spread it to others. Image Honestly, how did it come to this?

This attendance policy is so incredibly irresponsible and dangerous, especially to clinically vulnerable kids like my son.

But even for kids who arenā€™t clinically vulnerable, each Covid infection risks triggering new long-term health issues. Image
Sep 18 ā€¢ 5 tweets ā€¢ 3 min read
This is Prof Susan Hopkins, Chief Medical Advisor at UKHSA, explaining why she doesnā€™t think that FFP3 masks should be recommended (instead of fluid resistant surgical masks) in hospitals - even when there is an accepted risk of airborne transmission.

šŸšØPaging @trishgreenhalgh
Itā€™s then pointed out to Prof Hopkins that, in the IPC Cell Minutes for 22 Dec 2020, the representative from PHE had stated:

ā€œOur understanding of aerosol transmission has changed. A precautionary approach to move to FFP3 masks whilst we are awaiting evidence should be advised.ā€
Sep 17 ā€¢ 7 tweets ā€¢ 3 min read
This is Dr Lisa Ritchie who was the Head of Infection Prevention & Control for NHS England & Chair of the IPC Cell.

In this video, she explains why patients should never wear FFP3 masks - even if they are known to be highly infectious or if they are clinically vulnerableā€¦

/1 The rationale she gives is that FFP3 masks have valves which the infectious particles can ā€˜leakā€™ out through.

Surely the obvious next question is:

So why donā€™t they recommend UNVALVED FFP3 masks for infectious or clinically vulnerable patients?

/2 Image
Sep 13 ā€¢ 17 tweets ā€¢ 9 min read
@NHSConfed Hi @NHSConfed @ConfedMatthew

Did you investigate the impact of Long Covid in driving the numbers of people dropping out of the workforce due to long term sickness?

There are 2M people in England & Scotland suffering from Long Covidā€¦

ā€¦or 2.2M if you extrapolate across the UK. Image @NHSConfed @ConfedMatthew Of those affected by Long Covid, around 1 in 5 (19.2%) report that their symptoms are so debilitating that their day-to-day activities are severely limited.

Thatā€™s 381,000 people in England & Scotlandā€¦

ā€¦or ~412,000 if you extrapolate across the whole of the UK. Image