Josep Ferrer Profile picture
Apr 27, 2024 โ€ข 9 tweets โ€ข 3 min read โ€ข Read on X
Ever felt lost in Python's universe of data types? ๐ŸŒŒ

Then dive into the basics with me today!

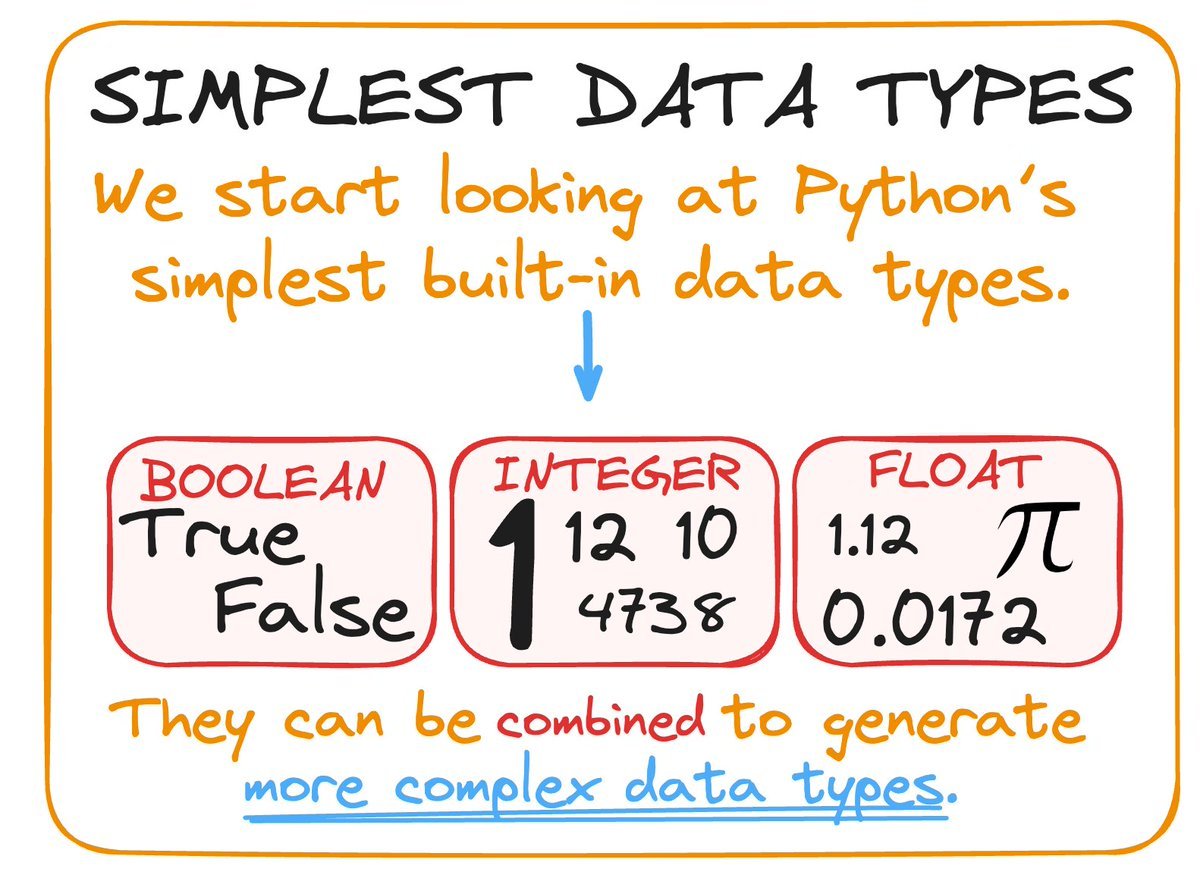
Today we're exploring Booleans, Integers, and Floats โ€“ the core elements in Python's data type galaxy! ๐Ÿš€๐Ÿ Image
These data types are like the atoms of Python.

We start with them individually and later combine them into larger structures like lists and dictionaries.

It's a journey from simplicity to complexity! Image
1๏ธโƒฃ ๐—•๐—ข๐—ข๐—Ÿ๐—˜๐—”๐—ก๐—ฆ
Booleans are the on/off switches of Python ๐Ÿšฆ.

Booleans decide your code's route, guiding it with simple yet powerful TRUE or FALSE signals.

They're the silent guardians of logic! Image
2๏ธโƒฃ ๐—œ๐—ก๐—ง๐—˜๐—š๐—˜๐—ฅ๐—ฆ
Integers are the digital legos in Python ๐Ÿงฑ

From 0 to infinity...

they're the countable stones that pave the path of loops and arrays in your code. Image
3๏ธโƒฃ ๐—™๐—Ÿ๐—ข๐—”๐—ง๐—ฆ
Floats are the Artists of Precision ๐ŸŽจ

They're the precision points that give your calculations depth and detail, just like the delicate brush strokes on a canvas. Image
๐ŸŽผ ๐—›๐—ฎ๐—ฟ๐—บ๐—ผ๐—ป๐—ถ๐˜‡๐—ถ๐—ป๐—ด ๐—ก๐˜‚๐—บ๐—ฏ๐—ฒ๐—ฟ๐˜€ - ๐—ง๐—ต๐—ฒ ๐—œ๐—ป๐˜๐—ฒ๐—ด๐—ฒ๐—ฟ-๐—™๐—น๐—ผ๐—ฎ๐˜ ๐—•๐—ฎ๐—น๐—น๐—ฒ๐˜
Mixing Integers and Floats in Python is like a duet in music ๐ŸŽถ

Python conducts the harmony, elevating Integers to Floats for a symphony of precise computations. Image
4๏ธโƒฃ ๐—–๐—ข๐—ก๐—ฉ๐—˜๐—ฅ๐—ง๐—œ๐—ก๐—š ๐——๐—”๐—ง๐—” ๐—ง๐—ฌ๐—ฃ๐—˜๐—ฆ
Transforming data types in Python is like a wizard's spell ๐Ÿง™โ€โ™‚๏ธ.

Changing data types in Python is like casting a spell. With a flick of a function, watch a Boolean transform into an Integer or a Float! Image
Understanding Python's data types is like mastering the alphabet of a new language. ๐Ÿ“š

It empowers you to write code that's clear, efficient, and impactful.

Ready to experiment with these fundamental types?
And this is all for now! ๐Ÿค“

Did you like the thread?

Then join my freshly started DataBites newsletter to get all my content right to your mail every Sunday! ๐Ÿงฉ

๐Ÿ‘‰๐Ÿป open.techwriters.info/rfeers
Image

โ€ข โ€ข โ€ข

Missing some Tweet in this thread? You can try to force a refresh
ใ€€

Keep Current with Josep Ferrer

Josep Ferrer Profile picture

Stay in touch and get notified when new unrolls are available from this author!

Read all threads

This Thread may be Removed Anytime!

PDF

Twitter may remove this content at anytime! Save it as PDF for later use!

Try unrolling a thread yourself!

how to unroll video
  1. Follow @ThreadReaderApp to mention us!

  2. From a Twitter thread mention us with a keyword "unroll"
@threadreaderapp unroll

Practice here first or read more on our help page!

More from @rfeers

Apr 19
Multiple-class Logistic Regression clearly explained ๐Ÿ‘‡๐Ÿป

(Don't forget to bookmark for later! ๐Ÿ˜‰) Image
By default, Logistic Regression is like a coin toss - heads or tails, A or B.

But what if you have multiple classes?

That's where we adapt our model for MULTIPLE CHOICES!
There are two main ways:
1๏ธโƒฃ ๐—ข๐—ก๐—˜-๐—ฉ๐—ฆ-๐—ฅ๐—˜๐—ฆ๐—ง (๐—ข๐˜ƒ๐—ฅ):
The Logistic Regression model excels in classifying binary choices.

So... what if we train multiple Logistic Regression classifiers for every class?

๐Ÿ’ก The idea would be to focus on classifying a single class vs the rest. Image
Read 13 tweets
Apr 15
Simple Linear Regression exemplified for dummies๐Ÿ‘‡๐Ÿป

(Don't forget to bookmark for later! ๐Ÿ˜‰) Image
1๏ธโƒฃ ๐——๐—”๐—ง๐—” ๐—š๐—”๐—ง๐—›๐—˜๐—ฅ๐—œ๐—ก๐—š ๐—ฃ๐—›๐—”๐—ฆ๐—˜
We're using height and weight - a classic duo often assumed to have a linear relationship.

But assumptions in data science? No way! ๐Ÿง

Let's find out:
- Do height and weight really share a linear bond? Image
Do you like this post?

Then join my DataBites newsletter to get all my content right to your mail every Sunday! ๐Ÿงฉ

๐Ÿ‘‰๐Ÿป ๐Ÿค“databites.tech
Read 18 tweets
Apr 14
Linear Regression clearly explained ๐Ÿ‘‡๐Ÿป Image
Linear regression is the simplest statistical regression method used for predictive analysis.

It can be performed with multiple variables.... but today we'll focus on a single one.

Also known as Simple Linear Regression.
1๏ธโƒฃ ๐—ฆ๐—œ๐— ๐—ฃ๐—Ÿ๐—˜ ๐—Ÿ๐—œ๐—ก๐—˜๐—”๐—ฅ ๐—ฅ๐—˜๐—š๐—ฅ๐—˜๐—ฆ๐—ฆ๐—œ๐—ข๐—ก
In Simple Linear Regression, we use one independent variable to predict a dependent one.

The main goal? ๐ŸŽฏ
Finding a line of best fit.

It's simple yet powerful, revealing hidden trends in data. Image
Read 13 tweets
Mar 15
Linear Regression clearly explained ๐Ÿ‘‡๐Ÿป Image
Linear regression is the simplest statistical regression method used for predictive analysis.

It can be performed with multiple variables.... but today we'll focus on a single one.

Also known as Simple Linear Regression.
1๏ธโƒฃ ๐—ฆ๐—œ๐— ๐—ฃ๐—Ÿ๐—˜ ๐—Ÿ๐—œ๐—ก๐—˜๐—”๐—ฅ ๐—ฅ๐—˜๐—š๐—ฅ๐—˜๐—ฆ๐—ฆ๐—œ๐—ข๐—ก
In Simple Linear Regression, we use one independent variable to predict a dependent one.

The main goal? ๐ŸŽฏ
Finding a line of best fit.

It's simple yet powerful, revealing hidden trends in data. Image
Read 13 tweets
Mar 13
The Transformer's encoder clearly explained ๐Ÿ‘‡๐Ÿป Image
1๏ธโƒฃ ๐—ช๐—›๐—”๐—ง'๐—ฆ ๐—ง๐—›๐—˜ ๐—˜๐—ก๐—–๐—ข๐——๐—˜๐—ฅ? ๐Ÿง 

The Encoder is the part responsible for processing input tokens through self-attention and feed-forward layers to generate context-aware representations.

๐Ÿ‘‰ Itโ€™s the powerhouse behind understanding sequences in NLP models. Image
Are you enjoying this post?

Then join my newsletter DataBites to get all my content right to your mail every week! ๐Ÿงฉ

๐Ÿ‘‰๐Ÿป databites.tech
Read 16 tweets
Feb 21
Logistic Regression clearly explained with visuals๐Ÿ‘‡๐Ÿป

(Don't forget to bookmark for later! ๐Ÿ˜‰)
1๏ธโƒฃ ๐—Ÿ๐—ข๐—š๐—œ๐—ฆ๐—ง๐—œ๐—– ๐—ฅ๐—˜๐—š๐—ฅ๐—˜๐—ฆ๐—ฆ๐—œ๐—ข๐—ก
It is a binary classification model used to classify our input data into two main categories.

It can be extended to multiple classifications... but today we'll focus on a binary one.

Also known as Simple Logistic Regression. Image
2๏ธโƒฃ ๐—›๐—ข๐—ช ๐—ง๐—ข ๐—–๐—ข๐— ๐—ฃ๐—จ๐—ง๐—˜ ๐—œ๐—ง?
The Sigmoid Function is our mathematical wand, turning numbers into neat probabilities between 0 and 1.

It's what makes Logistic Regression tick, giving us a clear 'probabilistic' picture. Image
Read 14 tweets

Did Thread Reader help you today?

Support us! We are indie developers!


This site is made by just two indie developers on a laptop doing marketing, support and development! Read more about the story.

Become a Premium Member ($3/month or $30/year) and get exclusive features!

Become Premium

Don't want to be a Premium member but still want to support us?

Make a small donation by buying us coffee ($5) or help with server cost ($10)

Donate via Paypal

Or Donate anonymously using crypto!

Ethereum

0xfe58350B80634f60Fa6Dc149a72b4DFbc17D341E copy

Bitcoin

3ATGMxNzCUFzxpMCHL5sWSt4DVtS8UqXpi copy

Thank you for your support!

Follow Us!

:(