Struggling with Machine Learning algorithms? 🤖
Then you better stay with me! 🤓
We are going back to the basics to simplify ML algorithms.
... today's turn is Multiple Linear Regression! 👇🏻
Then you better stay with me! 🤓
We are going back to the basics to simplify ML algorithms.
... today's turn is Multiple Linear Regression! 👇🏻

In MLR, imagine you're baking.
You've got different ingredients or variables.
You need the perfect recipe (model) for your cake (prediction).
Each ingredient's quantity (coefficient) affects the taste (outcome).
You've got different ingredients or variables.
You need the perfect recipe (model) for your cake (prediction).
Each ingredient's quantity (coefficient) affects the taste (outcome).
1️⃣ 𝗗𝗔𝗧𝗔 𝗚𝗔𝗧𝗛𝗘𝗥𝗜𝗡𝗚 𝗣𝗛𝗔𝗦𝗘
We're using height and weight - a classic duo often assumed to have a linear relationship.
But assumptions in data science? No way! 🧐
Let's find out:
- Do height and weight really share a linear bond?
We're using height and weight - a classic duo often assumed to have a linear relationship.
But assumptions in data science? No way! 🧐
Let's find out:
- Do height and weight really share a linear bond?

2️⃣ 𝗗𝗔𝗧𝗔 𝗘𝗫𝗣𝗟𝗢𝗥𝗔𝗧𝗜𝗢𝗡 𝗧𝗜𝗠𝗘! 🕵️♂️
Before we get our hands dirty with modeling, let's take a closer look at our data.
Remember, the essence of a great model lies in truly understanding your data first. 🗝️
However... what about Gender?
Before we get our hands dirty with modeling, let's take a closer look at our data.
Remember, the essence of a great model lies in truly understanding your data first. 🗝️
However... what about Gender?
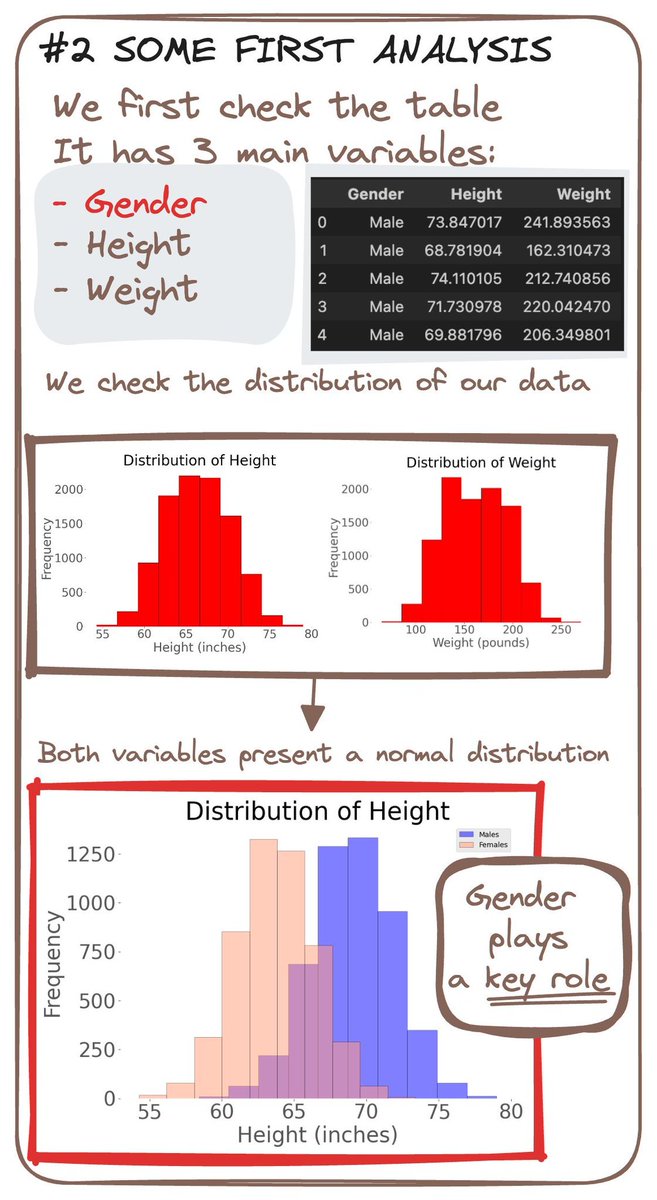
𝗚𝗘𝗡𝗗𝗘𝗥'𝗦 𝗥𝗢𝗟𝗘
Let's start with the basics: when we plot height against weight, we see a linear pattern emerge.
However... when we consider gender...
It turns out that it significantly affects the weight for a given height.
Let's start with the basics: when we plot height against weight, we see a linear pattern emerge.
However... when we consider gender...
It turns out that it significantly affects the weight for a given height.
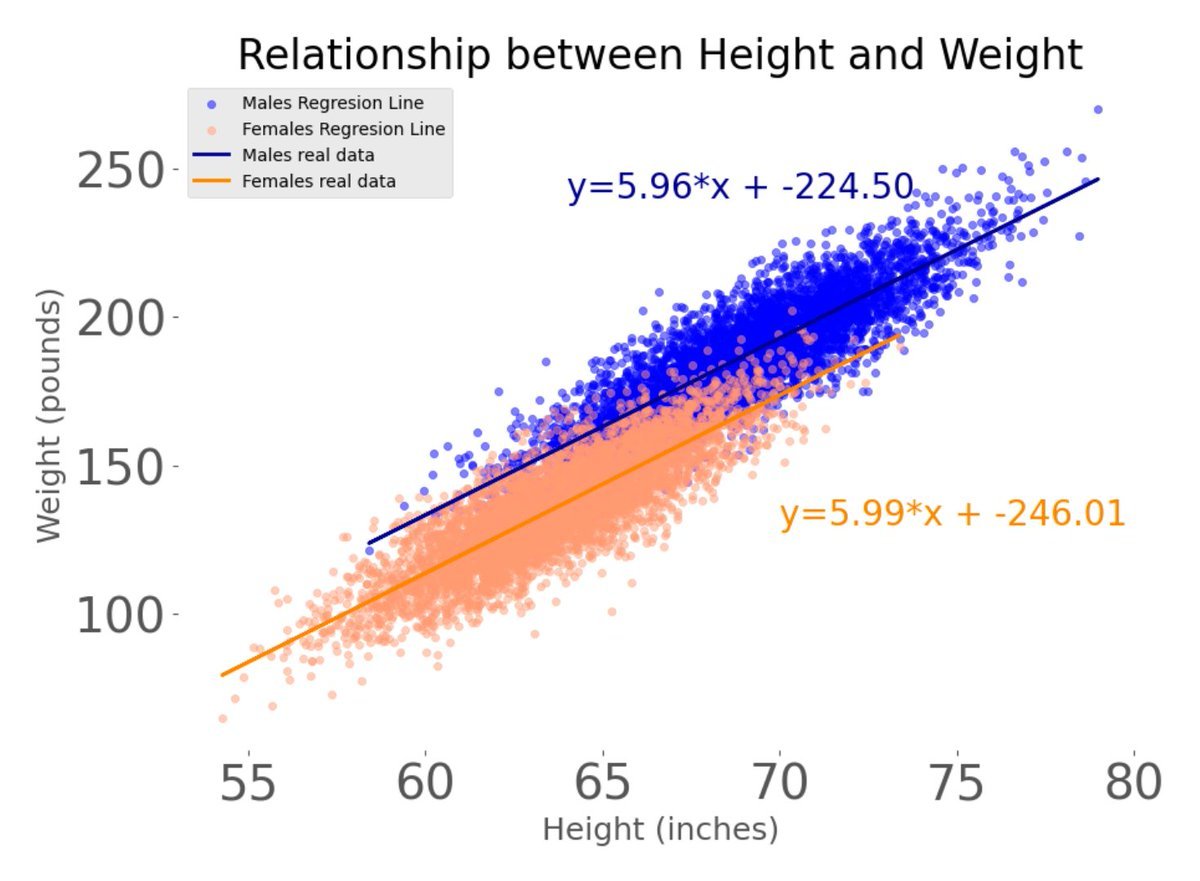
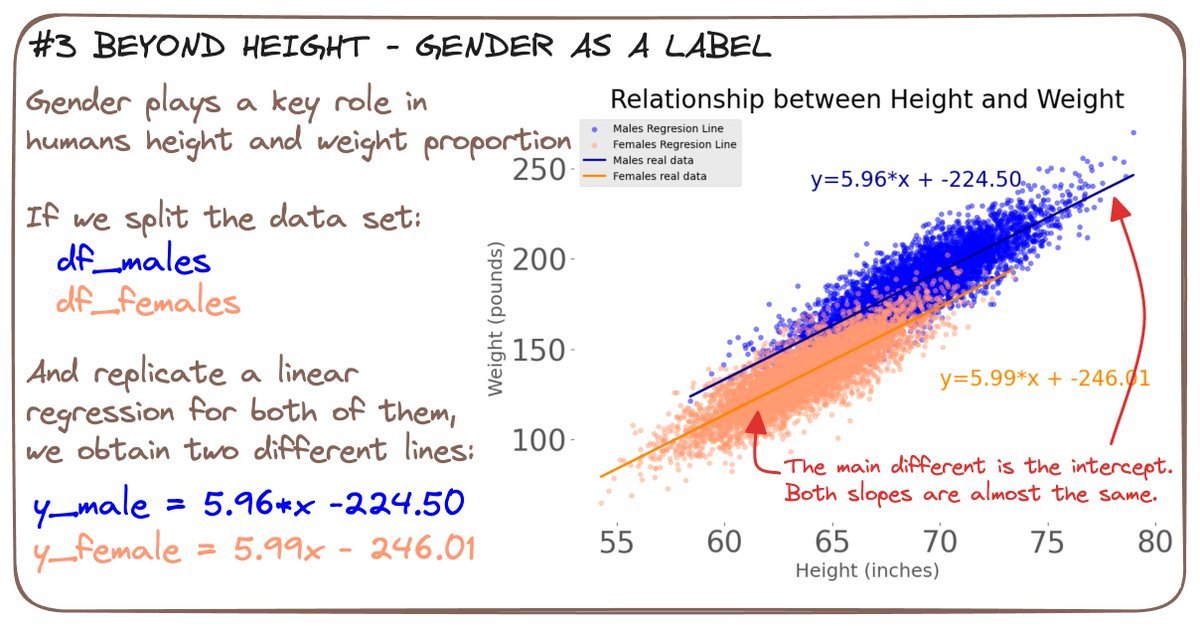
3️⃣ 𝗕𝗘𝗬𝗢𝗡𝗗 𝗛𝗘𝗜𝗚𝗛𝗧
Splitting our data by gender, we can perform two SINGLE linear regression.
The slopes of these lines are almost identical, which indicates a similar behavior.
But what about the intercepts?
They tell us that start from different baselines. 🚦
Splitting our data by gender, we can perform two SINGLE linear regression.
The slopes of these lines are almost identical, which indicates a similar behavior.
But what about the intercepts?
They tell us that start from different baselines. 🚦
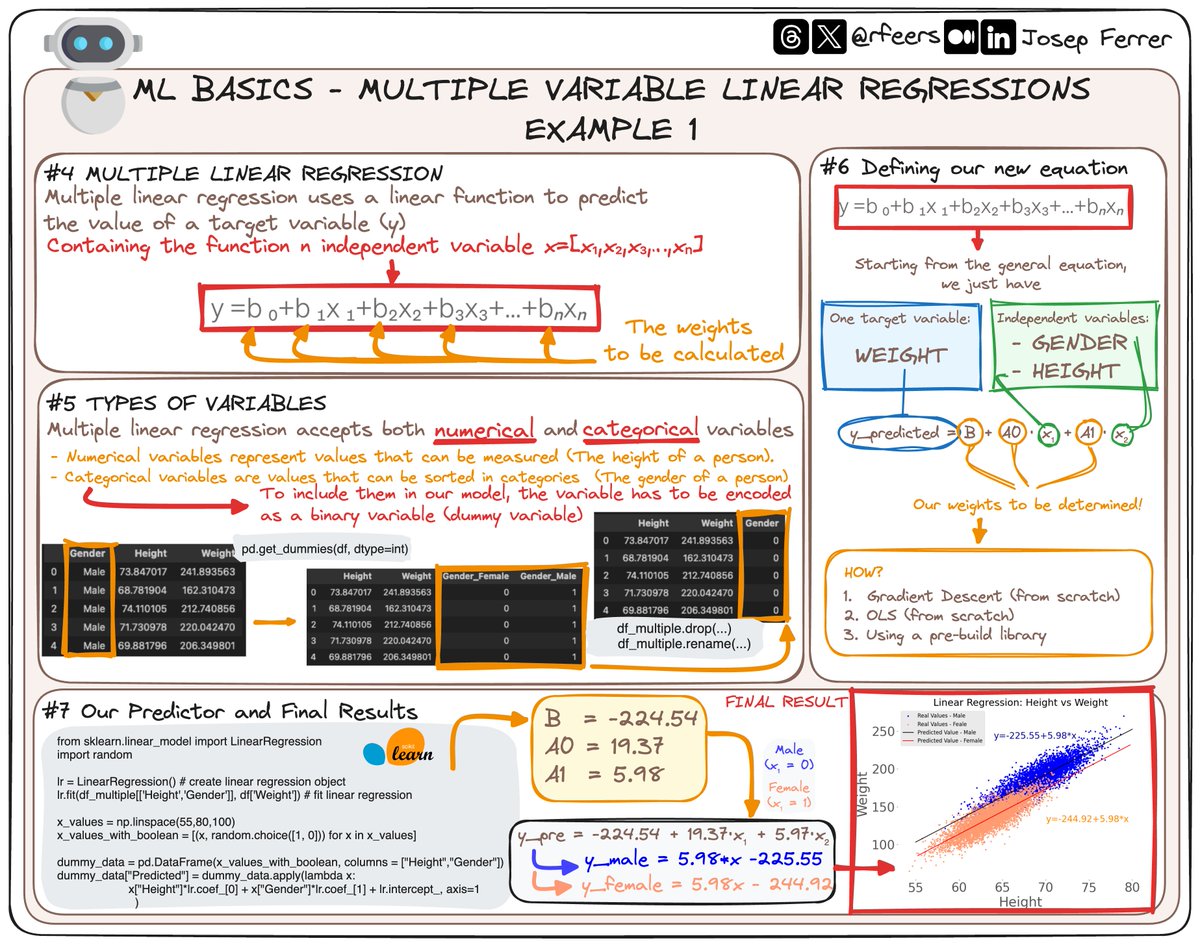
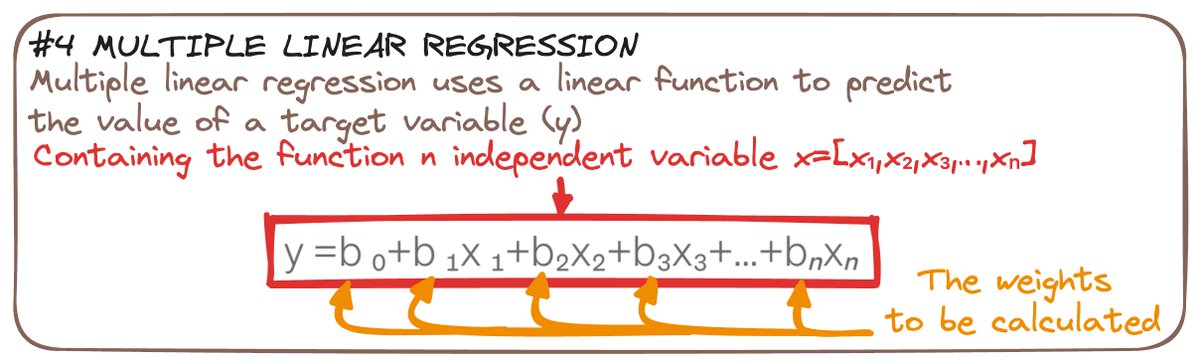
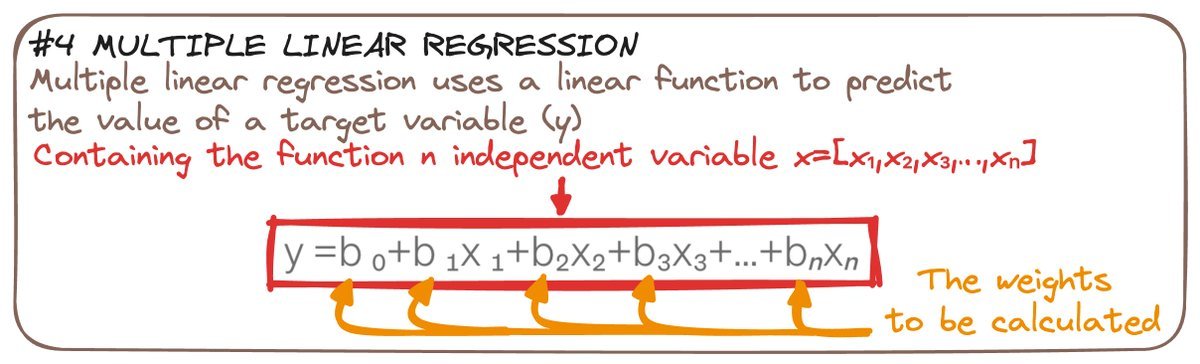
4️⃣ 𝗠𝗨𝗟𝗧𝗜-𝗩𝗔𝗥𝗜𝗔𝗕𝗟𝗘 📐
We can add multiple variables to perform a MULTIPLE Linear Regression.
The core theory is the same: We still use a linear function to predict our target.
But we can track N independent values
So we can consider both Height and Gender ➡️ N=2
We can add multiple variables to perform a MULTIPLE Linear Regression.
The core theory is the same: We still use a linear function to predict our target.
But we can track N independent values
So we can consider both Height and Gender ➡️ N=2
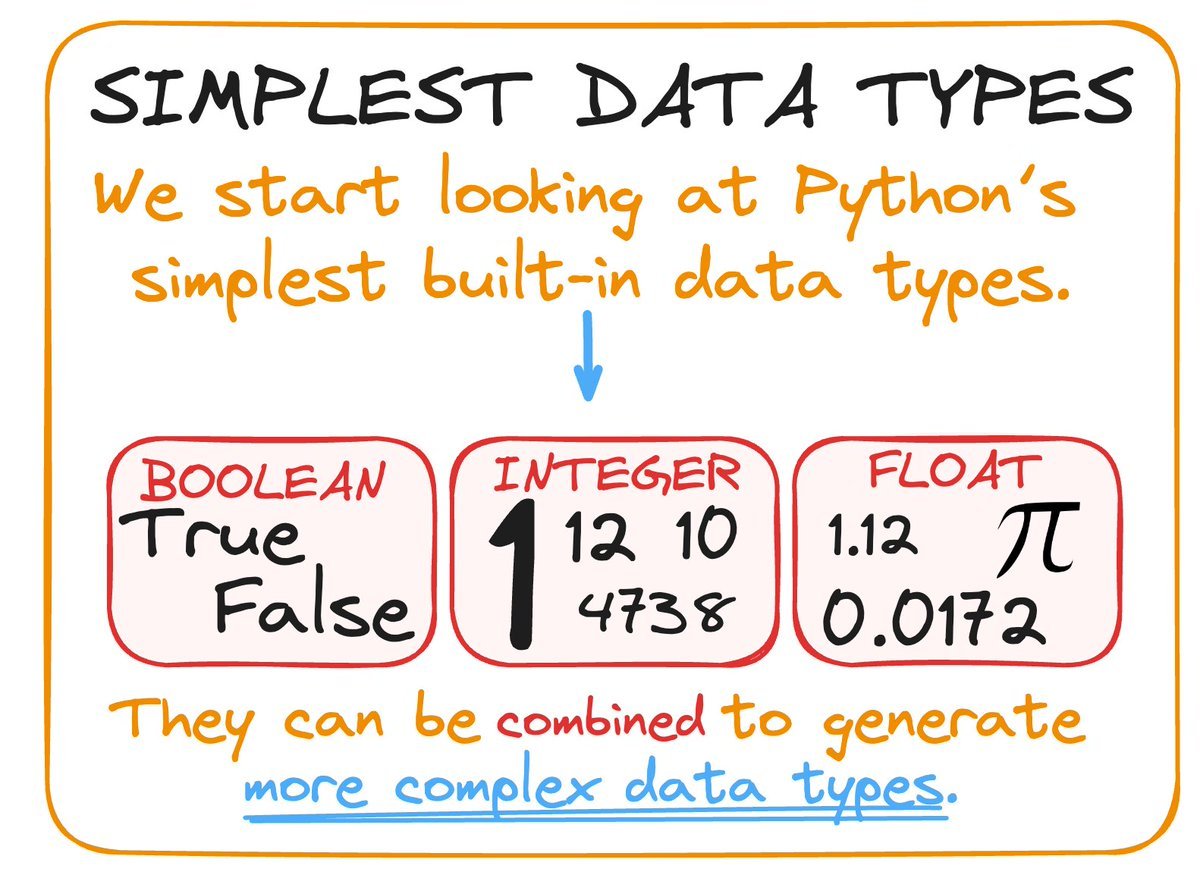
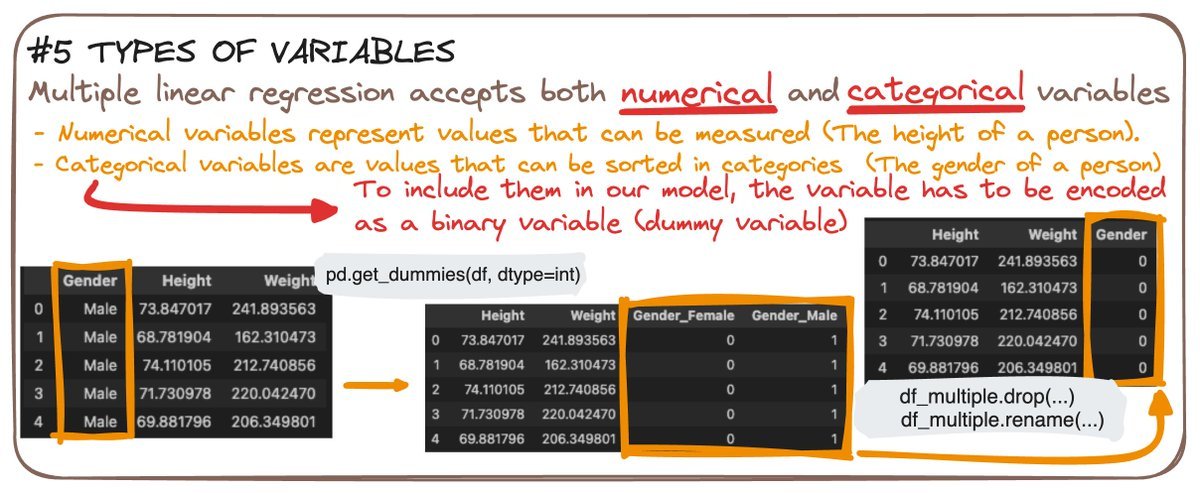
5️⃣ 𝗧𝗬𝗣𝗘𝗦 𝗢𝗙 𝗩𝗔𝗥𝗜𝗔𝗕𝗟𝗘𝗦 🎲
MLR accepts both numbers and categories.
HEIGHT is a numerical variable - which is a variable that can be measured.
GENDER is a category - It splits our data into different groups.
MLR accepts both numbers and categories.
HEIGHT is a numerical variable - which is a variable that can be measured.
GENDER is a category - It splits our data into different groups.

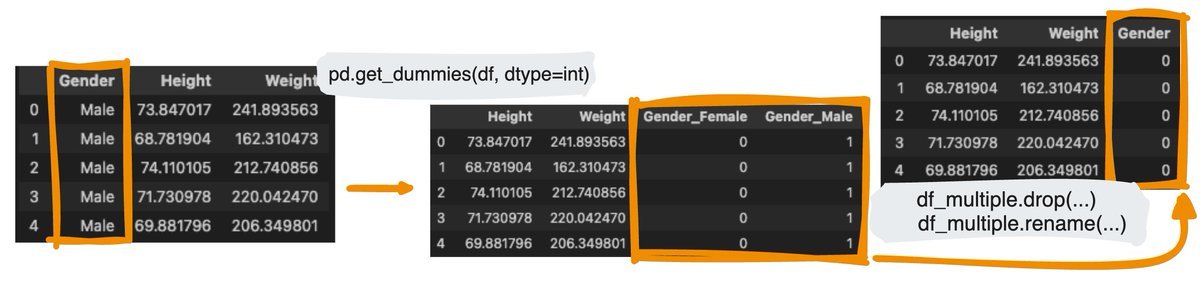
To consider categories in our model, they have to be encoded into a binary variable.
So say hello to dummy variables! 👋🏻
We can easily convert our gender variable into a boolean one with 1 and 0.
So say hello to dummy variables! 👋🏻
We can easily convert our gender variable into a boolean one with 1 and 0.
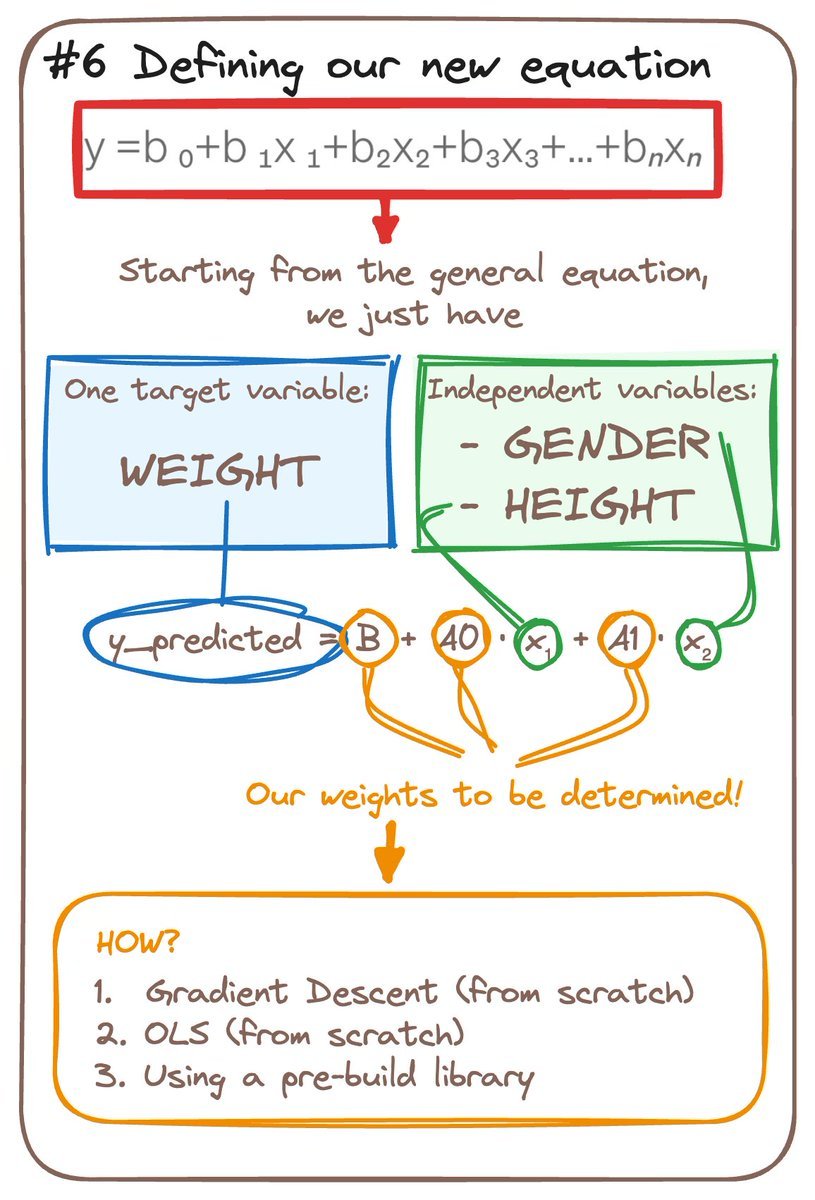
6️⃣ 𝗧𝗛𝗘 𝗘𝗤𝗨𝗔𝗧𝗜𝗢𝗡 🧮
Our regression equation is like a secret recipe.
It tells us how much of each ingredient (variables) we need.
Any unit increase in height makes the weight increase.
But gender affects this relationship too.
So we need to compute the weights!
Our regression equation is like a secret recipe.
It tells us how much of each ingredient (variables) we need.
Any unit increase in height makes the weight increase.
But gender affects this relationship too.
So we need to compute the weights!
7️⃣ 𝗙𝗜𝗡𝗔𝗟 𝗥𝗘𝗦𝗨𝗟𝗧𝗦 🏁
We can use scikit-learn to implement such MLR.
The code is quite straightforward and we can easily obtain all three weights.
We get a single equation for both cases.
We can use scikit-learn to implement such MLR.
The code is quite straightforward and we can easily obtain all three weights.
We get a single equation for both cases.
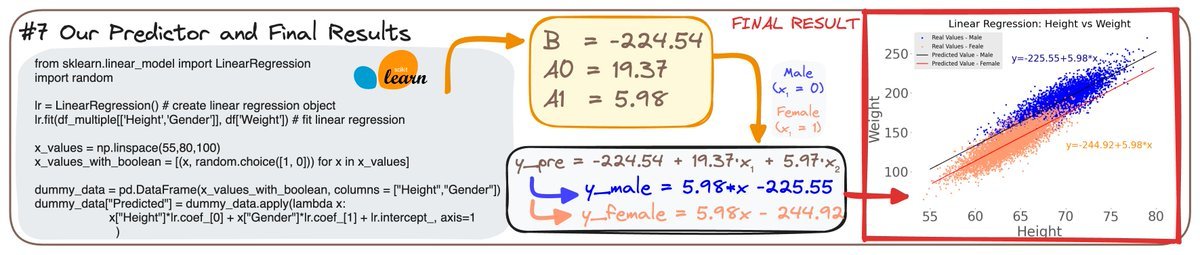
When considering that gender is either 0 or 1, we obtain two equations.
And they are quite similar to the ones we obtained in the beginning.
So this is all for now on Linear Regression.
Next week I'll write about Logistic Regression!
So you better stay tuned! 🤓
And they are quite similar to the ones we obtained in the beginning.
So this is all for now on Linear Regression.
Next week I'll write about Logistic Regression!
So you better stay tuned! 🤓
Did you like this thread?
Then join my freshly started DataBites newsletter to get all my content right to your mail every Sunday! 🧩
👉🏻 open.techwriters.info/rfeers
Then join my freshly started DataBites newsletter to get all my content right to your mail every Sunday! 🧩
👉🏻 open.techwriters.info/rfeers
• • •
Missing some Tweet in this thread? You can try to
force a refresh