
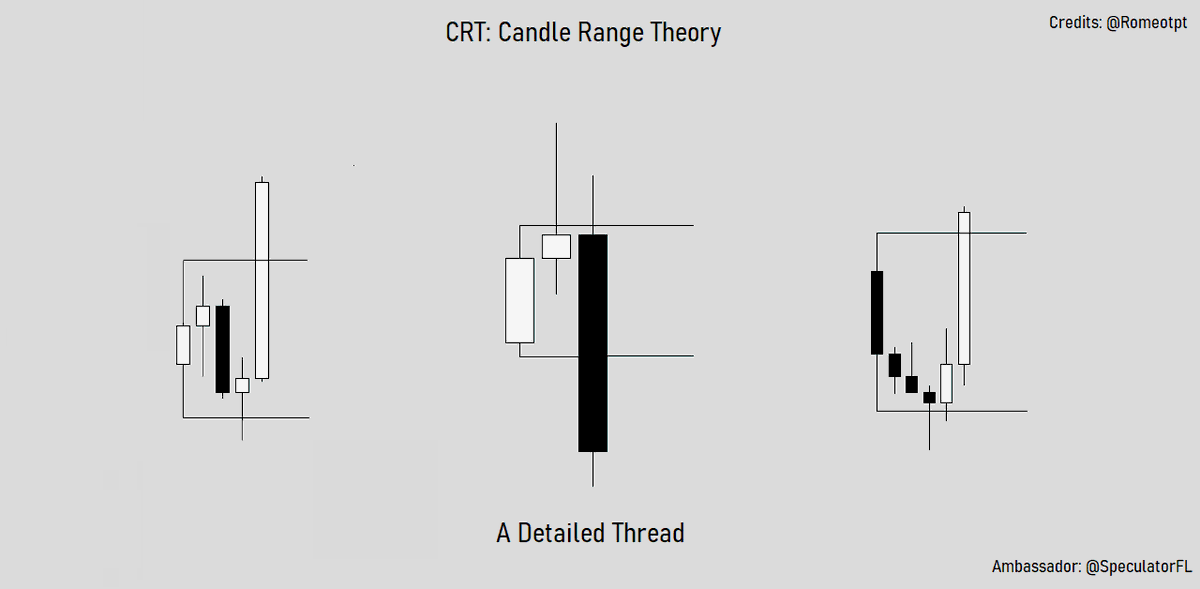
CRT: Candle Ranges Theory
A detailed thread explaining everything about CRT. 🧵
- Origin - Theory - Advance Protocols - Conjunction of CRT - Trade ideas - Filtering CRT - Application.
Let it be known that everything else is inferior.
Credits: @Romeotpt
A detailed thread explaining everything about CRT. 🧵
- Origin - Theory - Advance Protocols - Conjunction of CRT - Trade ideas - Filtering CRT - Application.
Let it be known that everything else is inferior.
Credits: @Romeotpt
The origins of CRT:
There's considerable debate about the true authorship of CRT, yet the answer is unequivocal: it is @Romeotpt.
Aside from R, the only secondary source for CRT is @SpeculatorFL [Me] and few chefs.
Anyone else claiming to know anything about CRT is fully lying
There's considerable debate about the true authorship of CRT, yet the answer is unequivocal: it is @Romeotpt.
Aside from R, the only secondary source for CRT is @SpeculatorFL [Me] and few chefs.
Anyone else claiming to know anything about CRT is fully lying

I have compiled all the fragments of CRT into a single comprehensive thread.
The YouTube video I promised is still in progress and will be uploaded in late May.
Until then, study this thread diligently.
youtube.com/@SpeculatorFL
The YouTube video I promised is still in progress and will be uploaded in late May.
Until then, study this thread diligently.
youtube.com/@SpeculatorFL

CRT Core Concept and Theory:
The fundamental theory and concept of CRT can be summarized as "Every single candle is a range."
Each candle, similar to a conventional range, possesses both H/L along with fixed O/C prices.
The fundamental theory and concept of CRT can be summarized as "Every single candle is a range."
Each candle, similar to a conventional range, possesses both H/L along with fixed O/C prices.

Furthermore, according to CRT every candle harbors its own PO3 [Power of 3] or AMD.
By capitalizing on this understanding, we can exploit the range of each candle using specific protocols during the manipulation or distribution phase
- Accumulation
- Manipulation
- Ditribution.
By capitalizing on this understanding, we can exploit the range of each candle using specific protocols during the manipulation or distribution phase
- Accumulation
- Manipulation
- Ditribution.

Distinguishing CRT from Typical Ranges:
Many people question how CRT differs from typical ranges. The answer lies in several key points: (See Picture)
- Objectivity
- Feasibility
- Technicality
- Mechanical
- Simple
- Refined
- Innovated
- Scalable.
Many people question how CRT differs from typical ranges. The answer lies in several key points: (See Picture)
- Objectivity
- Feasibility
- Technicality
- Mechanical
- Simple
- Refined
- Innovated
- Scalable.

Utilizing CRT Effectively:
The proper approach to leveraging CRT for identifying trade ideas involves integrating it with TSQ (The Sequence) and Turtle Soup.
The phases of TSQ include:
- CRT Turtle Soup
- CSD
- OTE
- Continuation
- KOD (Kiss of Death)
- Turtle Soup
The proper approach to leveraging CRT for identifying trade ideas involves integrating it with TSQ (The Sequence) and Turtle Soup.
The phases of TSQ include:
- CRT Turtle Soup
- CSD
- OTE
- Continuation
- KOD (Kiss of Death)
- Turtle Soup


Combining CRT with TSQ:
Integrating CRT with TSQ not only simplifies and objectify your entries on lower timeframes but also eliminates complexities often encountered in lower timeframe entries while trading.
"Everything beings with a TS, everything ends with a TS"
Integrating CRT with TSQ not only simplifies and objectify your entries on lower timeframes but also eliminates complexities often encountered in lower timeframe entries while trading.
"Everything beings with a TS, everything ends with a TS"

Selecting the Right CRT:
Technically, any candle can be considered a CRT. However, to pinpoint the most accurate and precise CRT, several protocols should be followed.
I will elaborate on some of these protocols in detail to empower you to choose the right CRT independently.
Technically, any candle can be considered a CRT. However, to pinpoint the most accurate and precise CRT, several protocols should be followed.
I will elaborate on some of these protocols in detail to empower you to choose the right CRT independently.

These are some of the most intricate and significant protocols:
- LTF CRT with HTF CRT
- Inside bars within CRT
- CRT formed at specific times
- Key levels around CRT
- Pairing different CRT
- Market profile with CRT
- LTF CRT with HTF CRT
- Inside bars within CRT
- CRT formed at specific times
- Key levels around CRT
- Pairing different CRT
- Market profile with CRT
Inside Bars within CRT:
This protocol holds significant importance within CRT. Inside bars appearing within a CRT represents the accumulation of interest around CRT.
The greater the number of inside bars, the better the CRT.
This protocol holds significant importance within CRT. Inside bars appearing within a CRT represents the accumulation of interest around CRT.
The greater the number of inside bars, the better the CRT.

When multiple inside bars occur within a CRT, the strategy is straightforward:
Await for a purge of one side. Once either side is purged, it provides a potential bias and draws liquidity toward the opposite 50% of the range or the opposing end of the range.
Await for a purge of one side. Once either side is purged, it provides a potential bias and draws liquidity toward the opposite 50% of the range or the opposing end of the range.


Another enhancement to the inside bars protocol involves waiting for a CSD to occur on the timeframe below it. This additional step provides a more accurate and high probability bias and drawing on liquidity.
This one extra step alone increases the probability by 50% margin.
This one extra step alone increases the probability by 50% margin.


Key levels around CRT serve as catalysts for reactions and expansion to the opposing end of the range. The hierarchy of key levels, from highest to lowest quality, includes:
- Rejection blocks.
- Orderblocks
- Fair value gaps
- Breakers
- Rejection blocks.
- Orderblocks
- Fair value gaps
- Breakers

Example:
If you're using H4 for finding CRT, then you must use the daily timeframe for coupling key levels with it.
Similarly, if you're using the daily for finding CRT, then you use the weekly timeframe for coupling key levels with it.
I'll delve further into it on my YT.
If you're using H4 for finding CRT, then you must use the daily timeframe for coupling key levels with it.
Similarly, if you're using the daily for finding CRT, then you use the weekly timeframe for coupling key levels with it.
I'll delve further into it on my YT.


Combining [Inside bars] and [Key level]:
By combining the first two protocols, we can elevate our CRT's quality to a more advanced level, resulting in better accuracy and precision.
As we incorporate additional protocols , the quality of our CRT continues to improves.
By combining the first two protocols, we can elevate our CRT's quality to a more advanced level, resulting in better accuracy and precision.
As we incorporate additional protocols , the quality of our CRT continues to improves.


CRT formed at specific times:
As we all know, Time > Price.
This core principle guides our trading decisions, focusing on specific times of the day or week. By recognizing the importance of time over price, we can filter out less accurate CRTs and select higher-quality ones.
As we all know, Time > Price.
This core principle guides our trading decisions, focusing on specific times of the day or week. By recognizing the importance of time over price, we can filter out less accurate CRTs and select higher-quality ones.

Timing of CRT Purges:
Just as high-quality CRTs form at specific times, high-quality purges of CRT ranges also occur at specific times.
This illustrates the synergy between time and CRT analysis. We can apply the 159 and 369 analogy here to enhance your understanding.
Just as high-quality CRTs form at specific times, high-quality purges of CRT ranges also occur at specific times.
This illustrates the synergy between time and CRT analysis. We can apply the 159 and 369 analogy here to enhance your understanding.


Pairing multiple CRT:
I've already provided a wealth of protocols, and here's another fantastic one to add to the mix: pairing different CRTs within the same timeframe.
I've already provided a wealth of protocols, and here's another fantastic one to add to the mix: pairing different CRTs within the same timeframe.

In this example, we observe a macro CRT where one side has already been purged, providing us with a bias and DOL towards the opposing end of the CRT.
As we approach this opposing end, we can search for micro CRTs within it and exploits it
CSD could also confirm the purge.
As we approach this opposing end, we can search for micro CRTs within it and exploits it
CSD could also confirm the purge.

Using CSD to confirm Bias and DOL:
A significant protocol for CRT involves waiting for a CSD to occur on the timeframe below the one where you've identified the CRT. This step confirms your bias and DOL.
However, it's crucial to use this protocol in conjunction with the others.
A significant protocol for CRT involves waiting for a CSD to occur on the timeframe below the one where you've identified the CRT. This step confirms your bias and DOL.
However, it's crucial to use this protocol in conjunction with the others.

LTF CRT within a HTF CRT:
Using LTF CRT within a HTF CRT is one of the most frequently asked questions about CRT. This protocol is allows us to establish our bias and DOL and confirms it.
LTF CRT within HTF CRT significantly enhances the quality and probability of a CRT.
Using LTF CRT within a HTF CRT is one of the most frequently asked questions about CRT. This protocol is allows us to establish our bias and DOL and confirms it.
LTF CRT within HTF CRT significantly enhances the quality and probability of a CRT.


Trade Protocols for CRT:
- When one side of the CRT is purged, your first target should be the 50% level of the opposing end.
- If the CRT is of high quality, based on the protocols followed, you may opt to hold the trade longer toward the opposing end.
- When one side of the CRT is purged, your first target should be the 50% level of the opposing end.
- If the CRT is of high quality, based on the protocols followed, you may opt to hold the trade longer toward the opposing end.

The more protocols that you use to find a CRT the higher would be the quality of the CRT.
- Each protocol added, further increases the margin of quality and probability by 11%.
- Use all the protocols in a sound logical manner with all the other market profiles.
- Each protocol added, further increases the margin of quality and probability by 11%.
- Use all the protocols in a sound logical manner with all the other market profiles.
Everyone who has read till the end will have a lot to study, and this may have even made their day. Now go to the charts and study this, and reverse engineer this as much as you can.
Happy studying, and share this with everyone.
I would love to see at least 400 reposts.
Happy studying, and share this with everyone.
I would love to see at least 400 reposts.


The video is also in the works and will be uploaded in late May.
My point with these reposts is just to gauge genuine interest and to see if the people are really interested in the right things.
My point with these reposts is just to gauge genuine interest and to see if the people are really interested in the right things.
• • •
Missing some Tweet in this thread? You can try to
force a refresh


