#Variant update for #Ontario, #Canada (to Apr. 17, 2024)
The JN.1.* +FLiRT variants now make up 20% of sequences and XDK.* which is recombinant of JN.1.1.1 and XBB.1.16.11 has made an appearance at 5%. Graph tools by @Mike_Honey_ 🧵1/

The JN.1.* +FLiRT variants now make up 20% of sequences and XDK.* which is recombinant of JN.1.1.1 and XBB.1.16.11 has made an appearance at 5%. Graph tools by @Mike_Honey_ 🧵1/


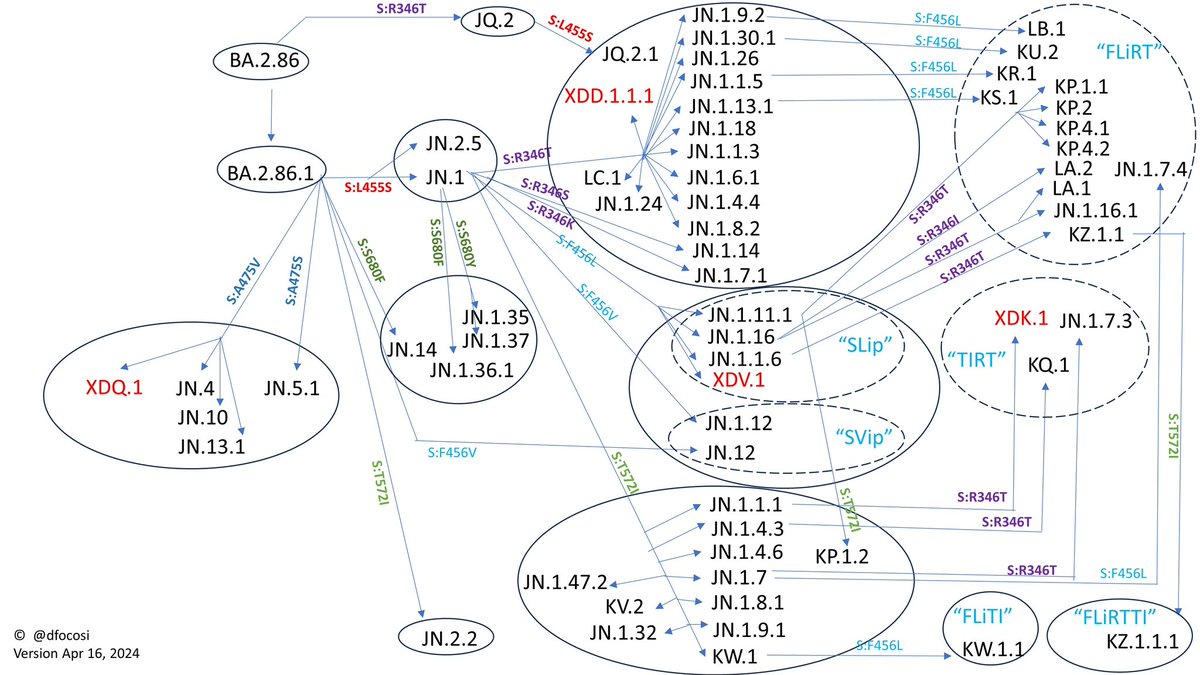
FLiRT is a nickname for variants with F456L & R356T mutations which seem to provide an advantage over the JN.1 Pirola variants without them. You can see the current FLiRT variants here from @dfocosi. 2/

JN.1 #Pirola has dropped to around 20% frequency and JN.1.4 is hovering at 14% while the FLiRTs are gaining: KS.1 at 10%, KP.1.1 at 4%, KP.2 at 3% and XDK.1 at 4%. 3/

@Mike_Honey_ is now automatically generating new variant reports when he updates his data for various locations so it is easy to just click on a link and get the latest PDF version of the report instead of having to navigate through his tool. 4/
You can get the latest Ontario variant report here ( ).
You can get the latest Canada variant report here ( ). 5/mike-honey.github.io/covid-19-genom…
mike-honey.github.io/covid-19-genom…
You can get the latest Canada variant report here ( ). 5/mike-honey.github.io/covid-19-genom…
mike-honey.github.io/covid-19-genom…
How well can people with previous vaccines and/or infections neutralize these JN.1 +FLiRT variants? Pre-print studies are starting to come out evaluating this. XBB infection on its own provides almost no neutralization against the FLiRTs ( ). 6/
https://twitter.com/yunlong_cao/status/1782775678343205220
The results show someone infected with JN.1 only has half the neutralization with the KP.3 FLiRT variant and people who had a previous XBB infection was worse at 2.4x lower. 7/

These neutralization levels are quite low (NT50 around from 51 to 177) compared to the levels we used to get with the original vaccines vs original (WT) virus so you don't want to start off behind using JN.1 for a fall vaccine. 8/
Neutralization against KP.2 FLiRT was significantly lower than those against JN.1 in all cases but especially those who have never been infected before the XBB.1.5 vaccine ( ). 9/
https://twitter.com/SystemsVirology/status/1784011459036602700
@threadreaderapp please unroll
These results are the mutations we are seeing today. In another 6 months when a new vaccine is supposed to be deployed, results could be a lot worse than 50% lower than an already low number so new vaccines should at least catch up with current escape mutations. 10/
Despite many hospitals declaring the end of the respiratory virus season in Ontario and relaxing or removing mask requirements already, there is still a lot of viral activity going on. 11/
The % positivity in Ontario from viral tests ( ):
7.8% = Entero/Rhinovirus
5.9% = Human metapneumovirus
5.7% = Parainfluenza
5.6% = COVID-19
5.2% = Seasonal Human Coronavirus
3.9% = Influenza
1.1% = Adenovirus
0.7% = RSV
12/publichealthontario.ca/en/Data-and-An…
7.8% = Entero/Rhinovirus
5.9% = Human metapneumovirus
5.7% = Parainfluenza
5.6% = COVID-19
5.2% = Seasonal Human Coronavirus
3.9% = Influenza
1.1% = Adenovirus
0.7% = RSV
12/publichealthontario.ca/en/Data-and-An…
You can find weekly Ontario stats including variants at ( ) and ( ). 13/covid.gilchrist.ca/Ontario.html
gilchrist.great-site.net/jeff/COVID-19/…
gilchrist.great-site.net/jeff/COVID-19/…
The visualization tool for variants was created by @Mike_Honey_ ( ). 14/app.powerbi.com/view?r=eyJrIjo…
To learn how to create a Sankey diagram of variants circulating in your area, please read this guide ( ). 15/
https://twitter.com/jeffgilchrist/status/1745415266144600073
To learn how to see what variants are circulating in your area, please read this guide ( ). 16/
https://twitter.com/jeffgilchrist/status/1647232148397498368
• • •
Missing some Tweet in this thread? You can try to
force a refresh