In this THREAD I will explain “Advanced Market Structure”
1. Turtle Soup
2. CISD
3. Inversion FVG
4. How to trade using FVG's
1. Turtle Soup
2. CISD
3. Inversion FVG
4. How to trade using FVG's

1. Turtle Soup
Turtle soup pattern seeks to identify potential trend reversals in the market.
It's based“fakeouts” where price briefly breaks out of a significant support or resistance level.
Before reversing back in the opposite direction.
Turtle soup pattern seeks to identify potential trend reversals in the market.
It's based“fakeouts” where price briefly breaks out of a significant support or resistance level.
Before reversing back in the opposite direction.

1.1 Turtle Soup
Price basically moves for two main reasons:
(I) To Balance an Imbalance
(II) To Hunt the Liquidity
After hunting the liquidity, price move to hunt the liquidity of other side, which is termed as turtle soup pattern.
Price basically moves for two main reasons:
(I) To Balance an Imbalance
(II) To Hunt the Liquidity
After hunting the liquidity, price move to hunt the liquidity of other side, which is termed as turtle soup pattern.

1.2 How to Trade using Turtle Soup
First thing to check:
(I) Higher Timeframe Order Flow
(II) Higher timeframe DOL Level
(III) Internal Range Liquidity Level
Then go to LTF and mark the recent IRL in opposite direction of higher time frame order flow.
First thing to check:
(I) Higher Timeframe Order Flow
(II) Higher timeframe DOL Level
(III) Internal Range Liquidity Level
Then go to LTF and mark the recent IRL in opposite direction of higher time frame order flow.

2. CISD
Is a concept used in TA, within the context of order block trading.
It aims to identify potential reversals in the market.
It’s mainly focused on the closing price relative to the opening price of upward candles.
Is a concept used in TA, within the context of order block trading.
It aims to identify potential reversals in the market.
It’s mainly focused on the closing price relative to the opening price of upward candles.

2.2 Bullish CISD
Price runs stop loss through sell side Liquidity.
This is also known as “manipulation”
After that, the following candle closes over the last down close candle.
Changing the state of delivery to BULLISH.
Price runs stop loss through sell side Liquidity.
This is also known as “manipulation”
After that, the following candle closes over the last down close candle.
Changing the state of delivery to BULLISH.

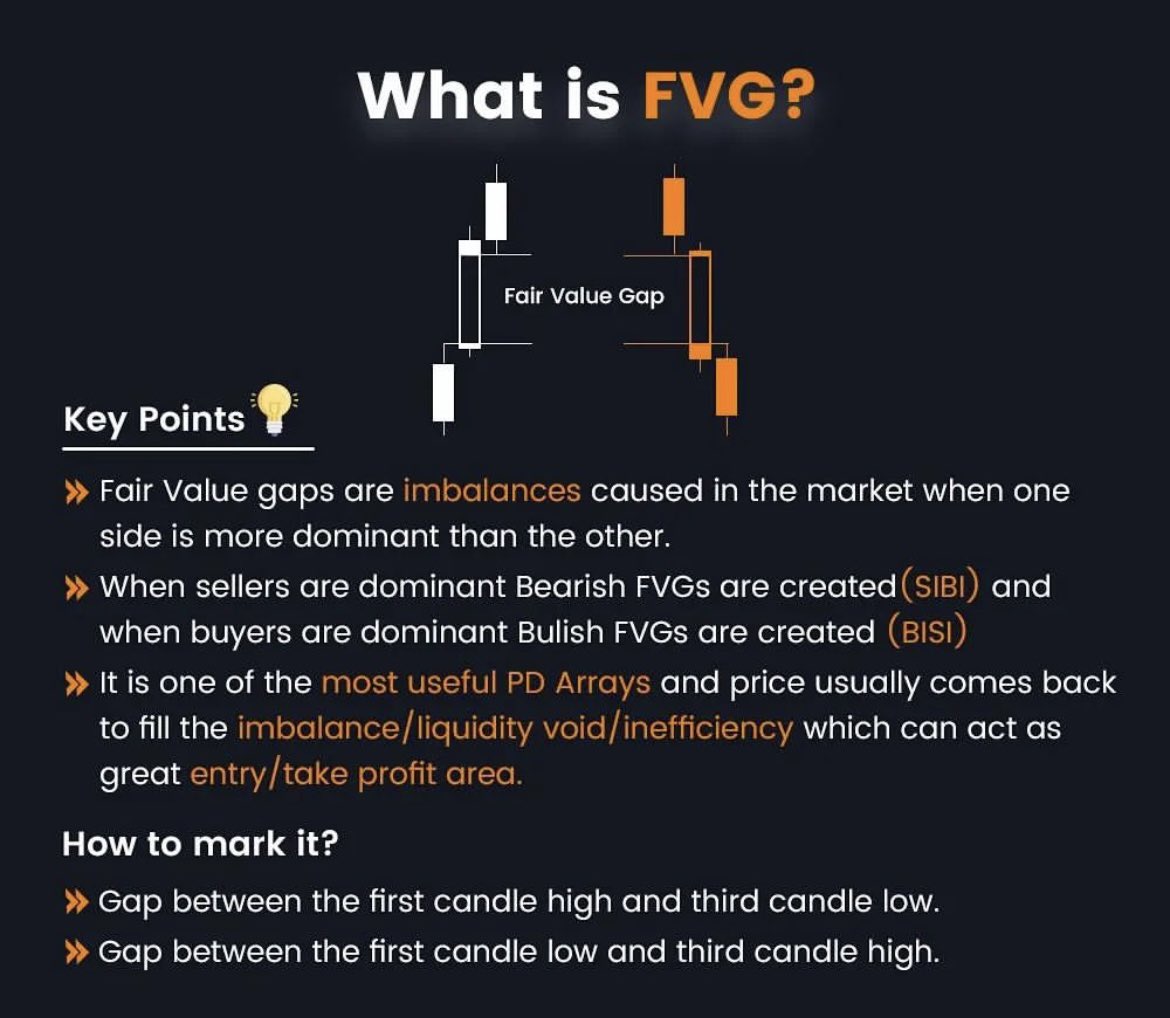
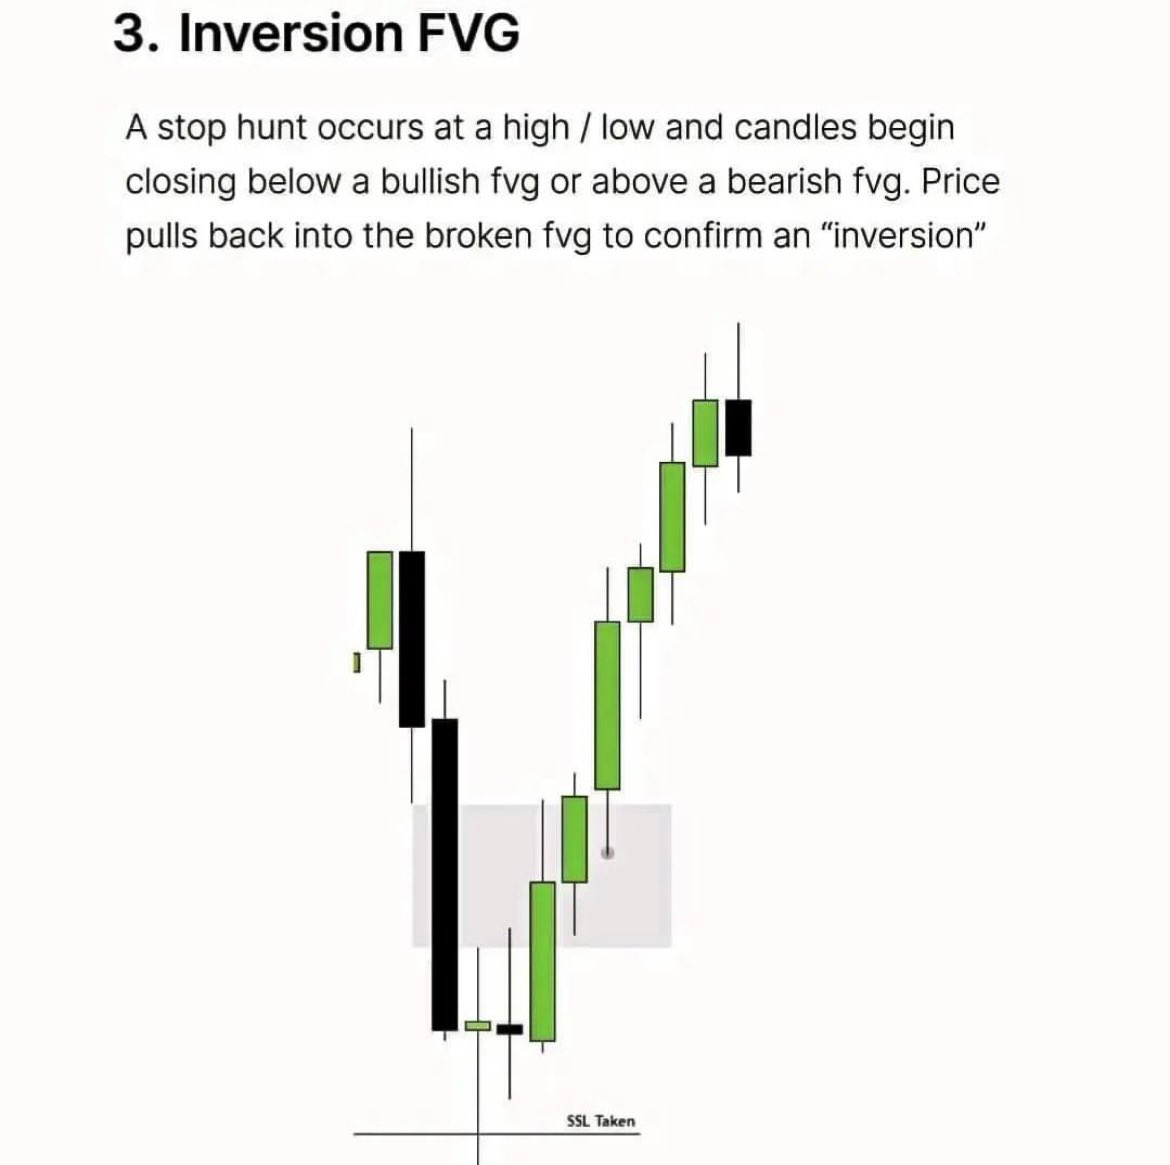
3. Inversion FVG
A stop hunt always occurs at a high/low of the current market structure.
When price after the stop hunt goes straight to the FVG that was a support, and now a resistance, and breaks it = Inversion FVG.
A stop hunt always occurs at a high/low of the current market structure.
When price after the stop hunt goes straight to the FVG that was a support, and now a resistance, and breaks it = Inversion FVG.
3.2 Bullish IFVG
Price takes out Sellside Liquidity for the Stop hunt.
Price comes then back to this area to re-test and confirm the inversion.
We can identify also that is a Bullish IFVG due to his present MS.
Price takes out Sellside Liquidity for the Stop hunt.
Price comes then back to this area to re-test and confirm the inversion.
We can identify also that is a Bullish IFVG due to his present MS.

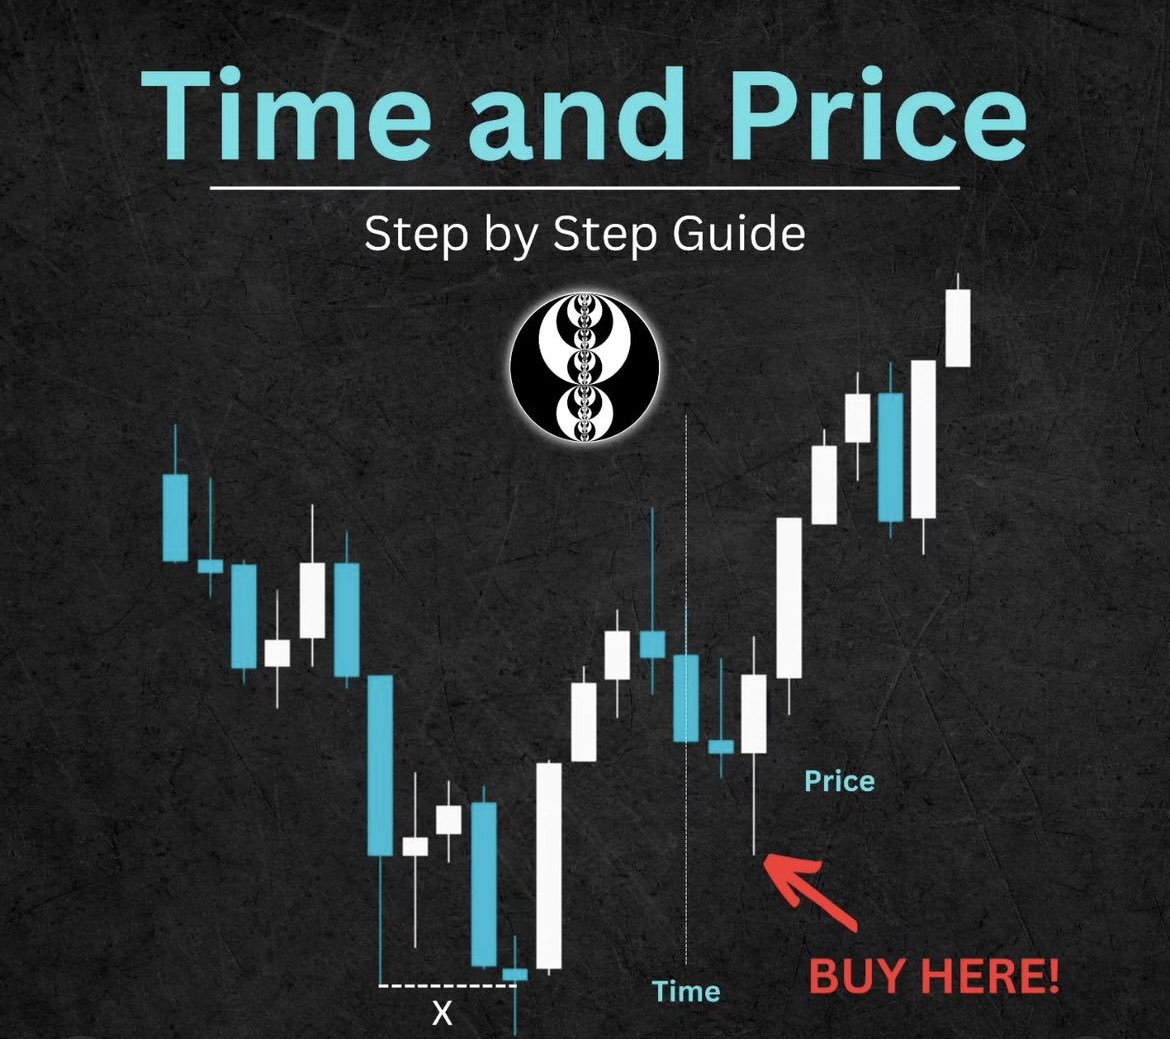
4. How to trade using FVG
A great confluence is looking for a sweep of LIQUIDITY.
For a liquidity sweep look for the lows/highs of previous trading sessions.
Asian lows and Asian highs in this example are sweeps of liquidity.
Other forms of Liquidity: Daily Highs/Lows
A great confluence is looking for a sweep of LIQUIDITY.
For a liquidity sweep look for the lows/highs of previous trading sessions.
Asian lows and Asian highs in this example are sweeps of liquidity.
Other forms of Liquidity: Daily Highs/Lows

• • •
Missing some Tweet in this thread? You can try to
force a refresh