Liquidity Sniper Profile picture
May 3, 2024 8 tweets 3 min read Read on X
ICT Time and Price - How To Use Them

A Thread 🧵 Image
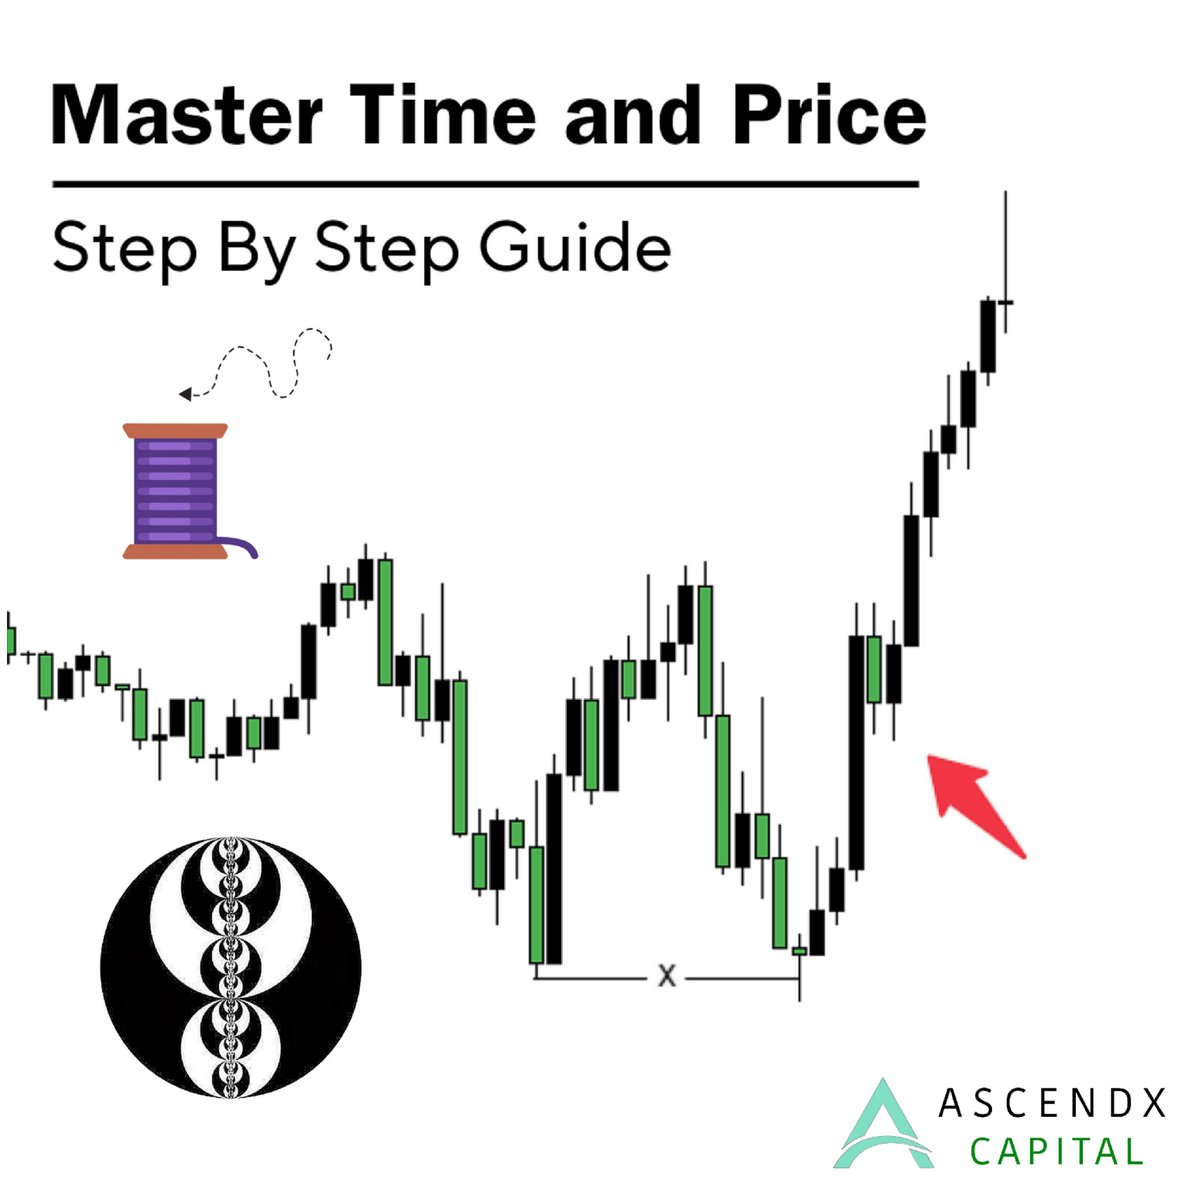
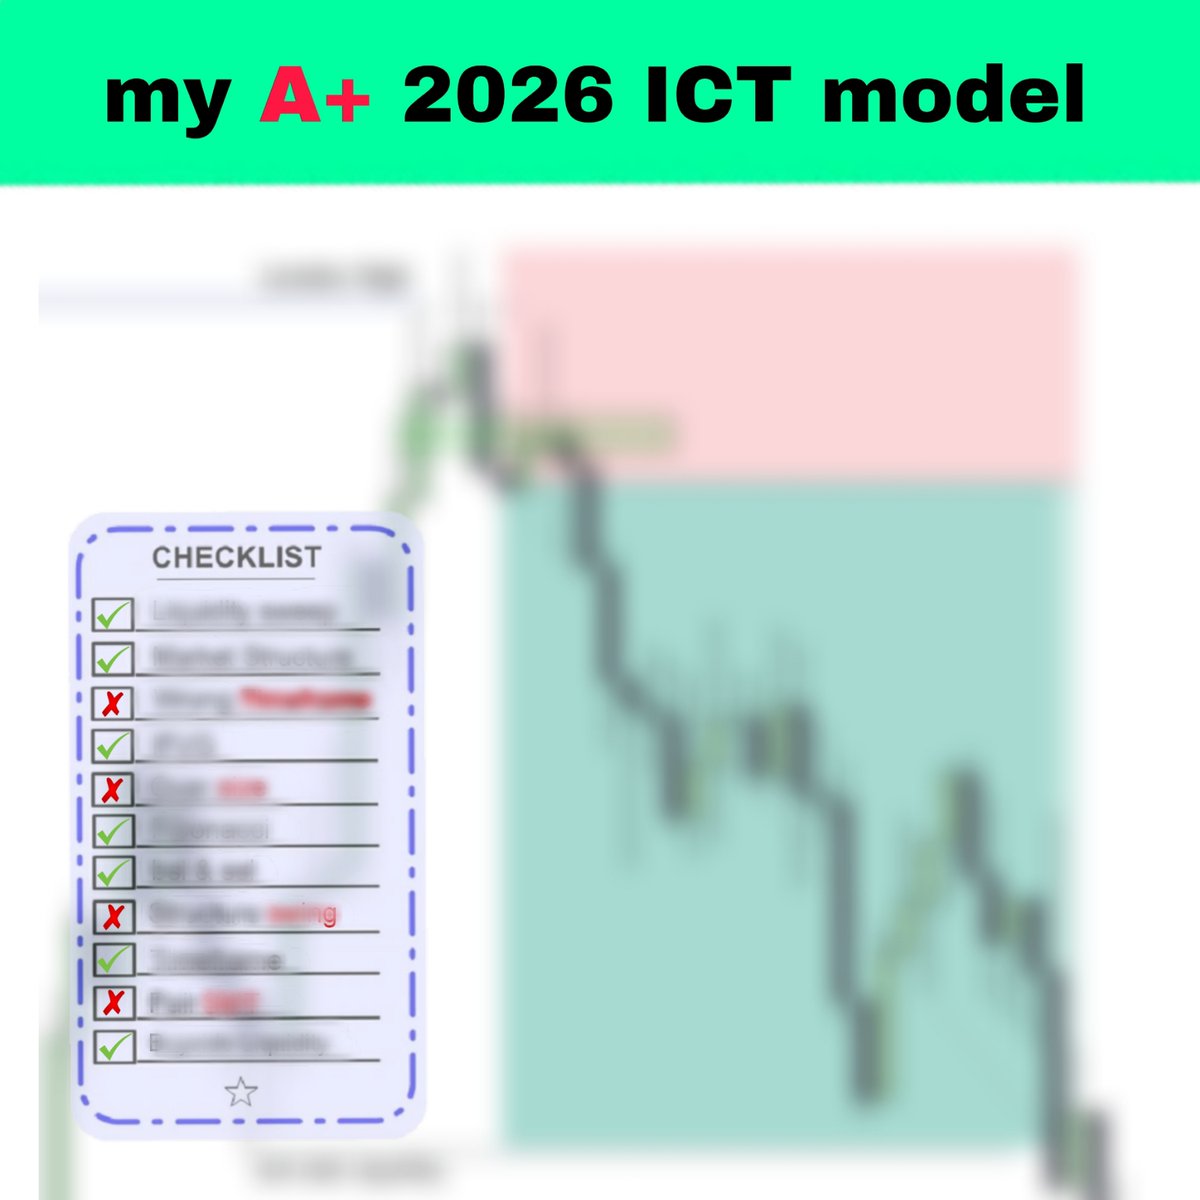
1. High probability setup:

When time and price come together at a certain spot, it sets up a good chance for a successful trade. Image
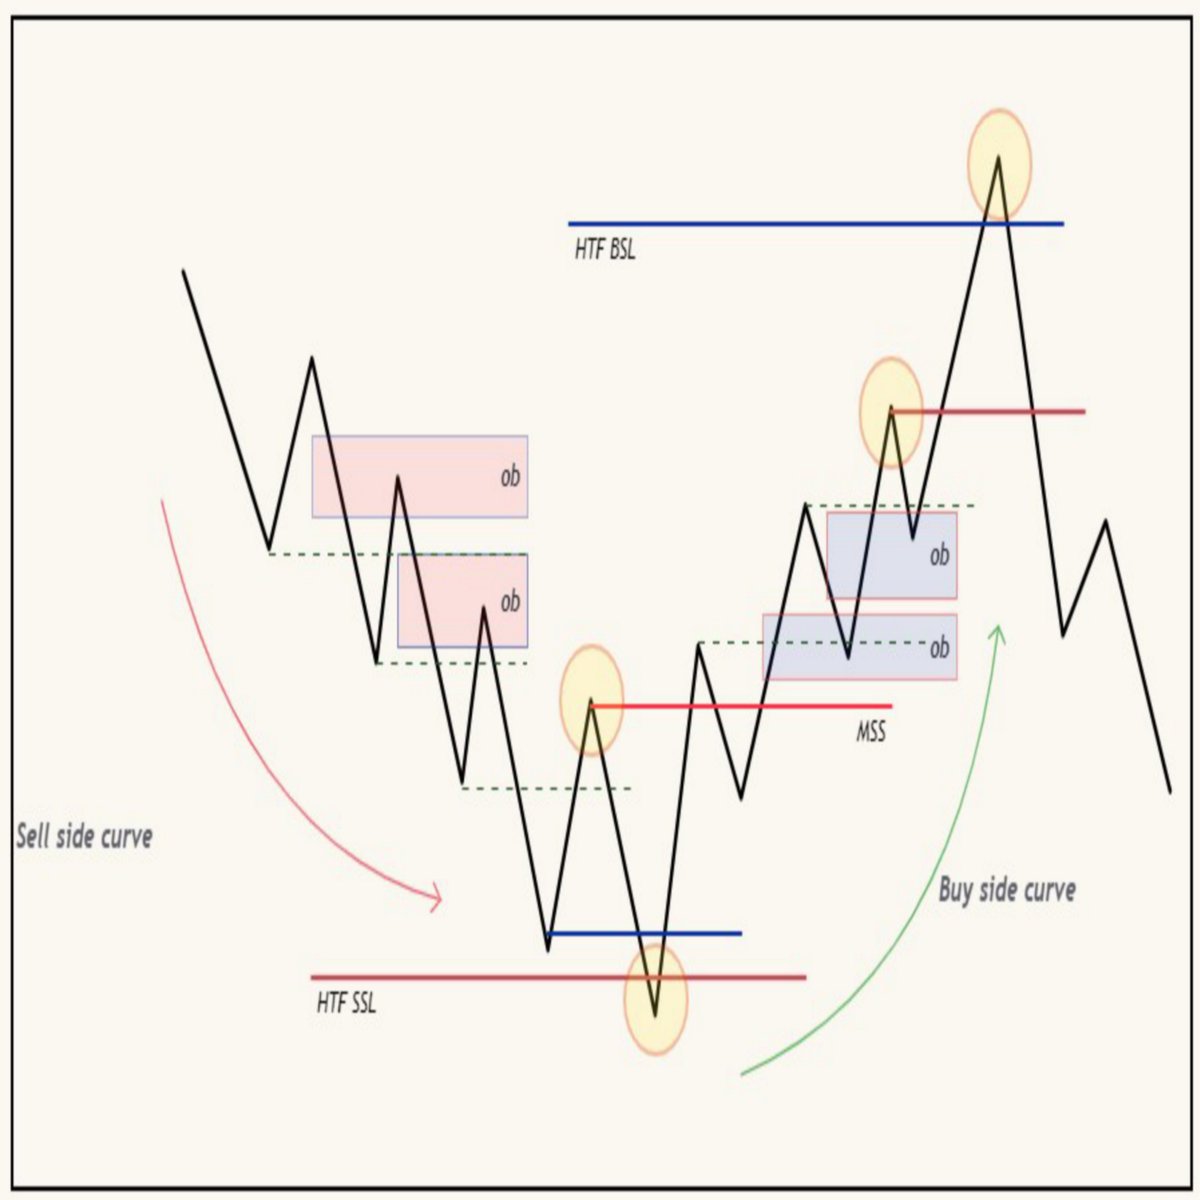
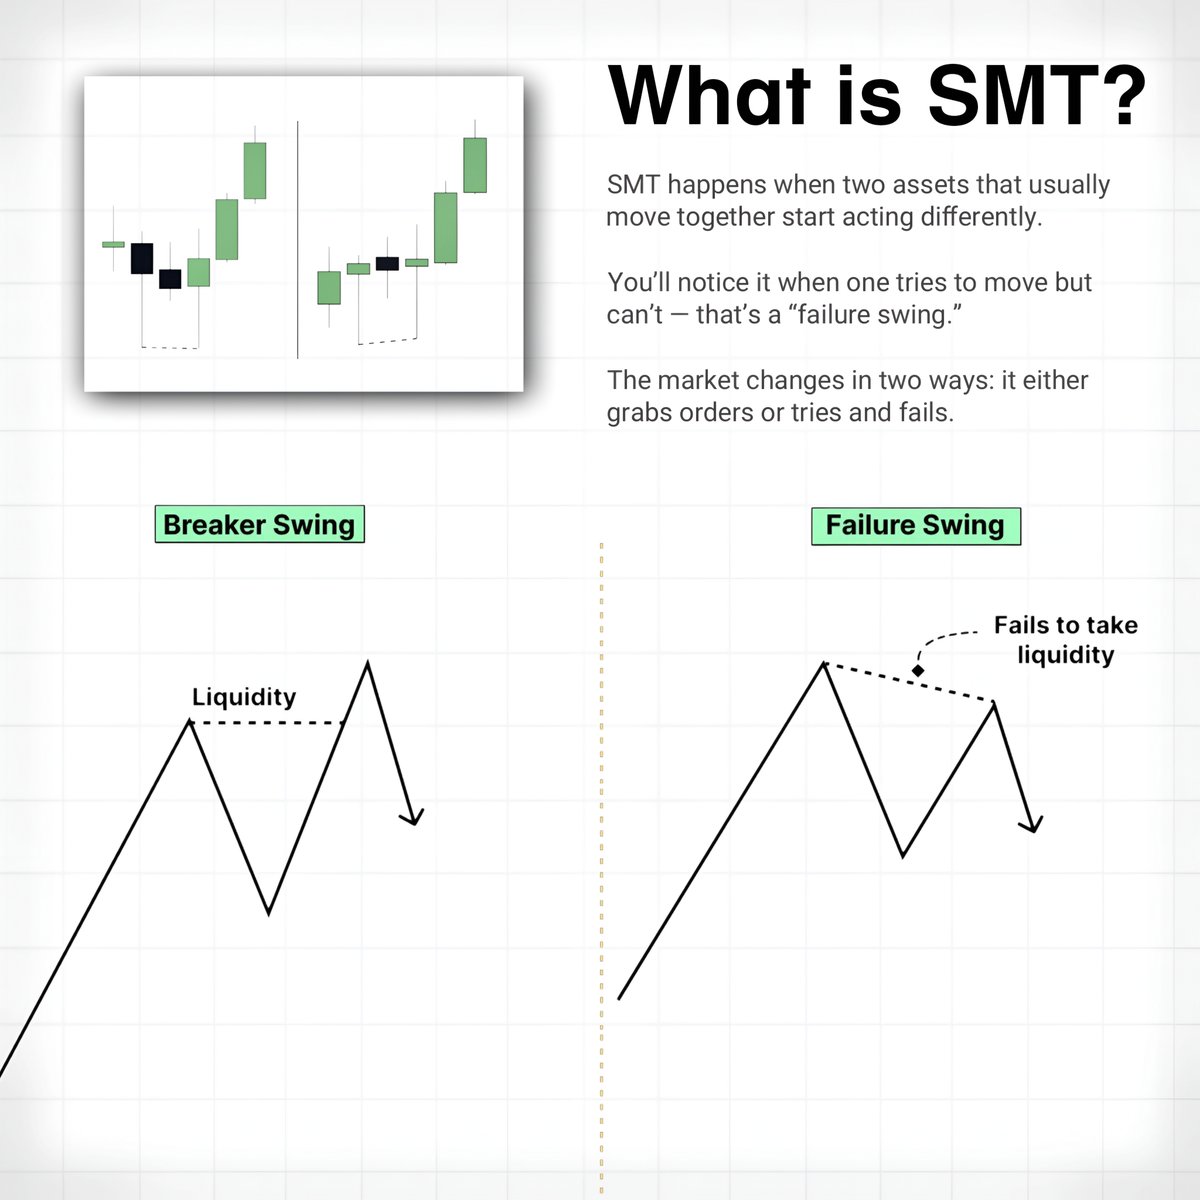
2. What is Time and price?
Price movement doesn’t exist without time.

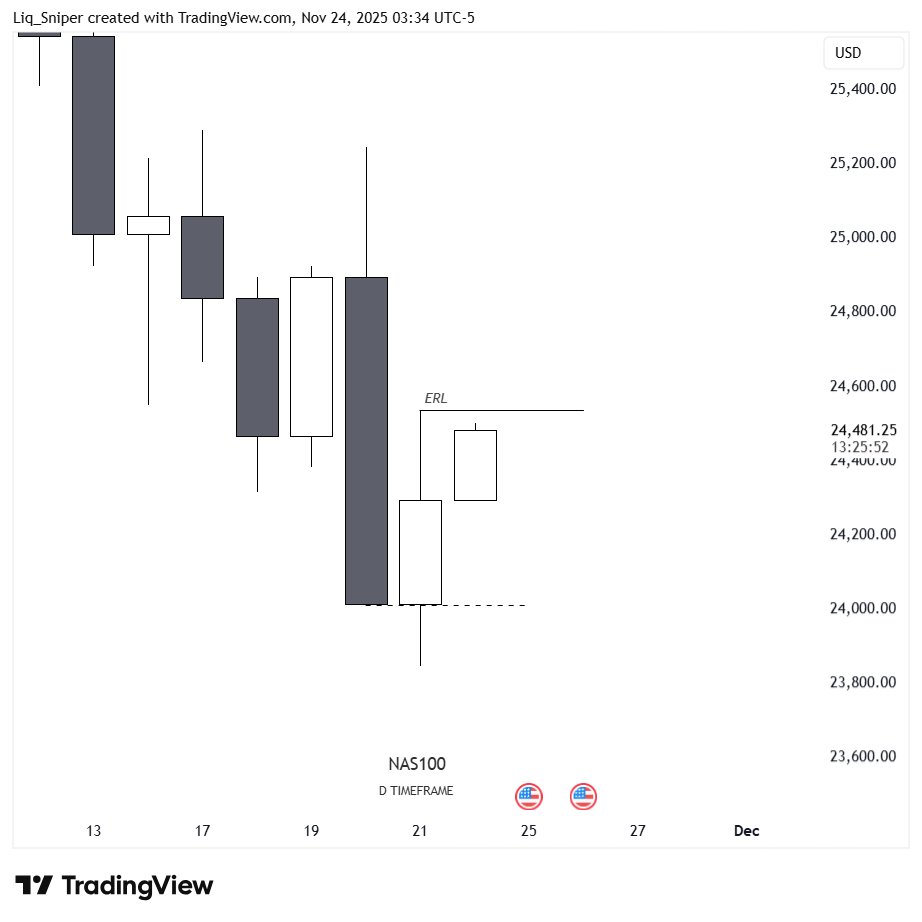
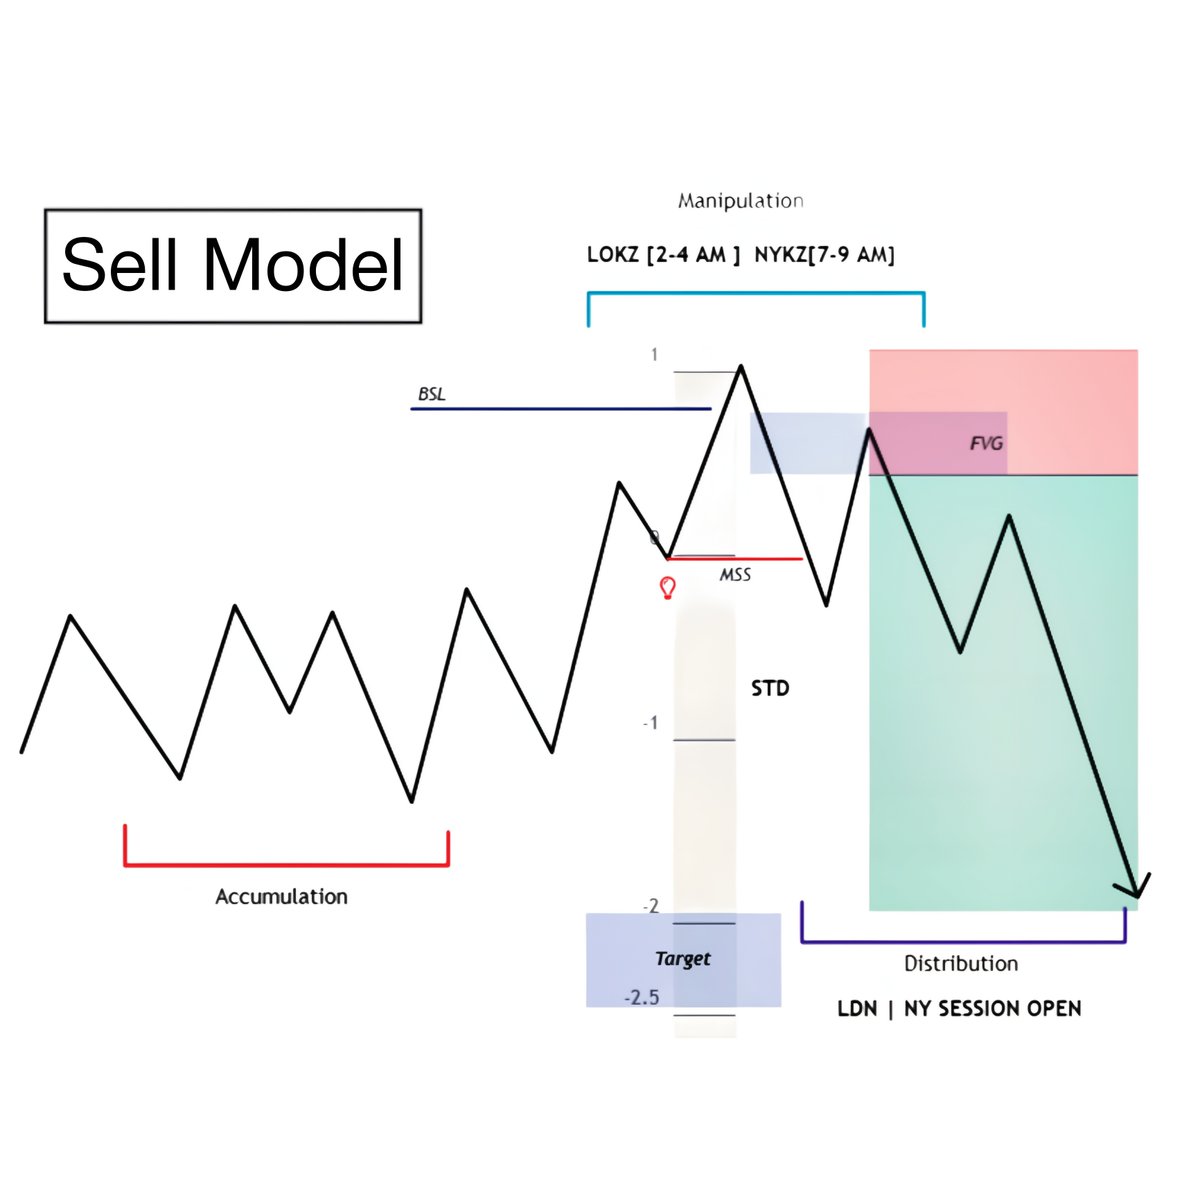
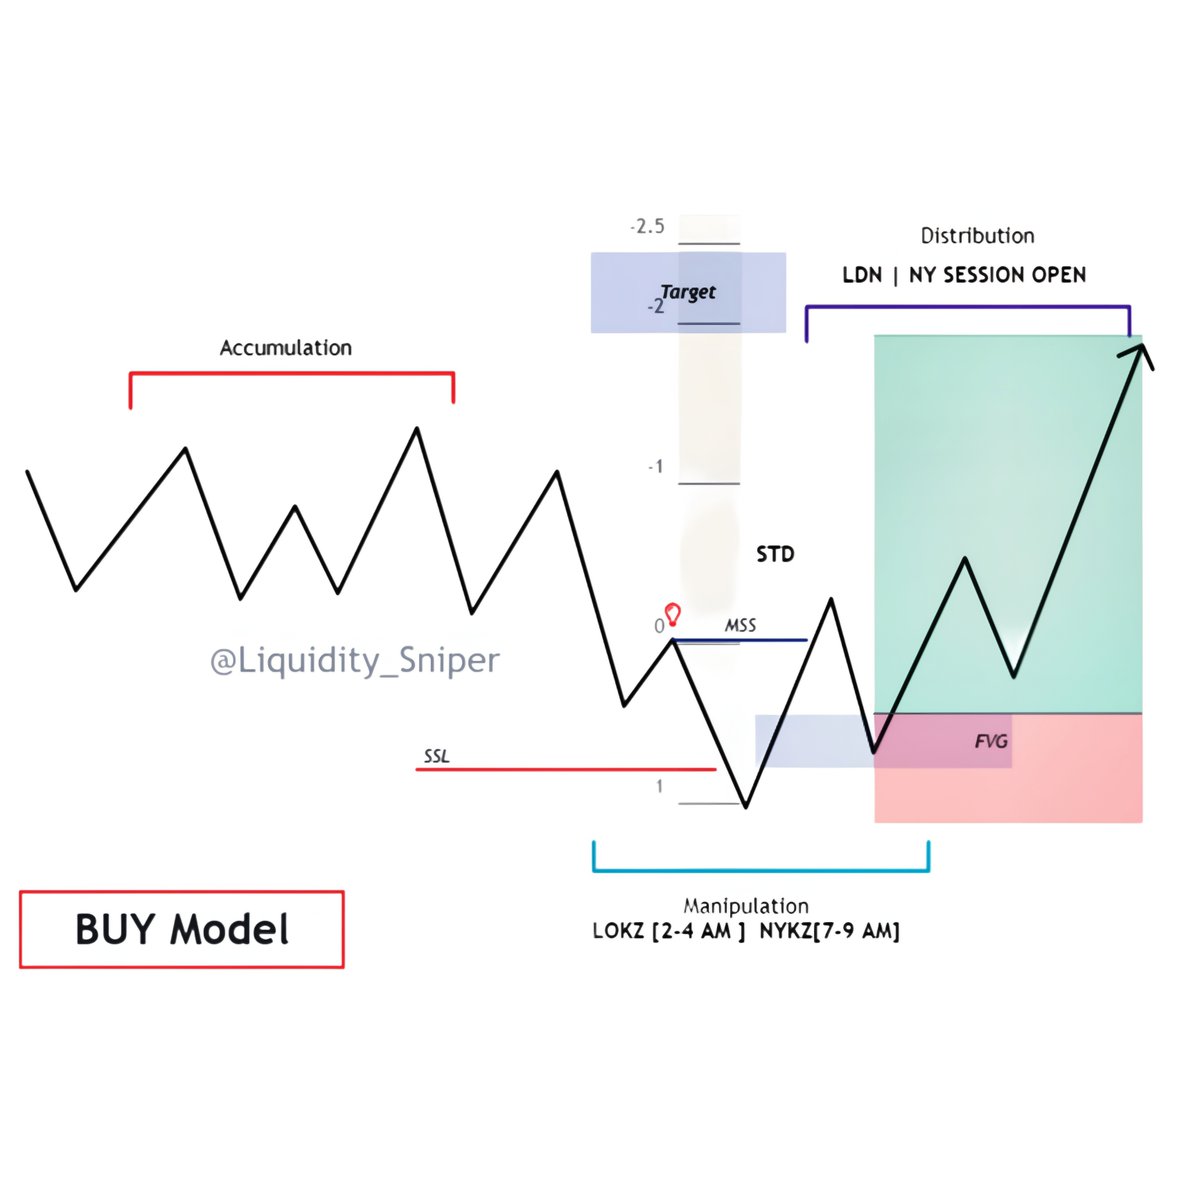
Time and price will form a HTF bias, with it we can exploit fluctuations of price movements in LTF.

If you lack HTF bias, let the market structure and time guide you.
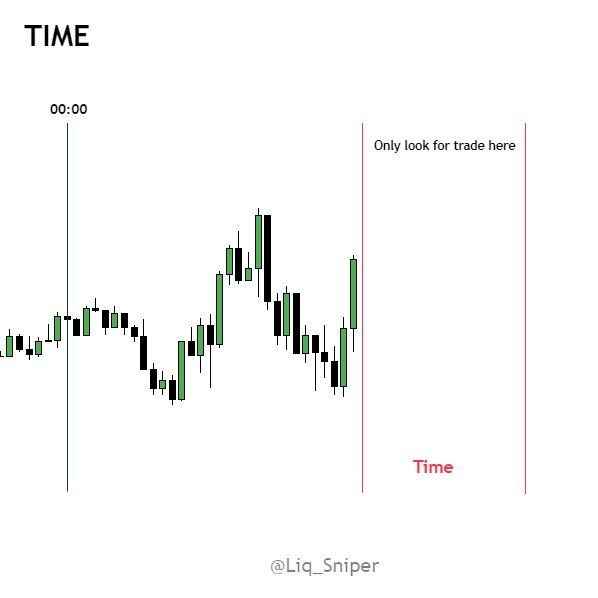
 Image
2.1 Time :
We should be looking at Killzone for high volatility, either London, NY, or Asian KZ.

Time is the zone we will be looking to enter a trade.
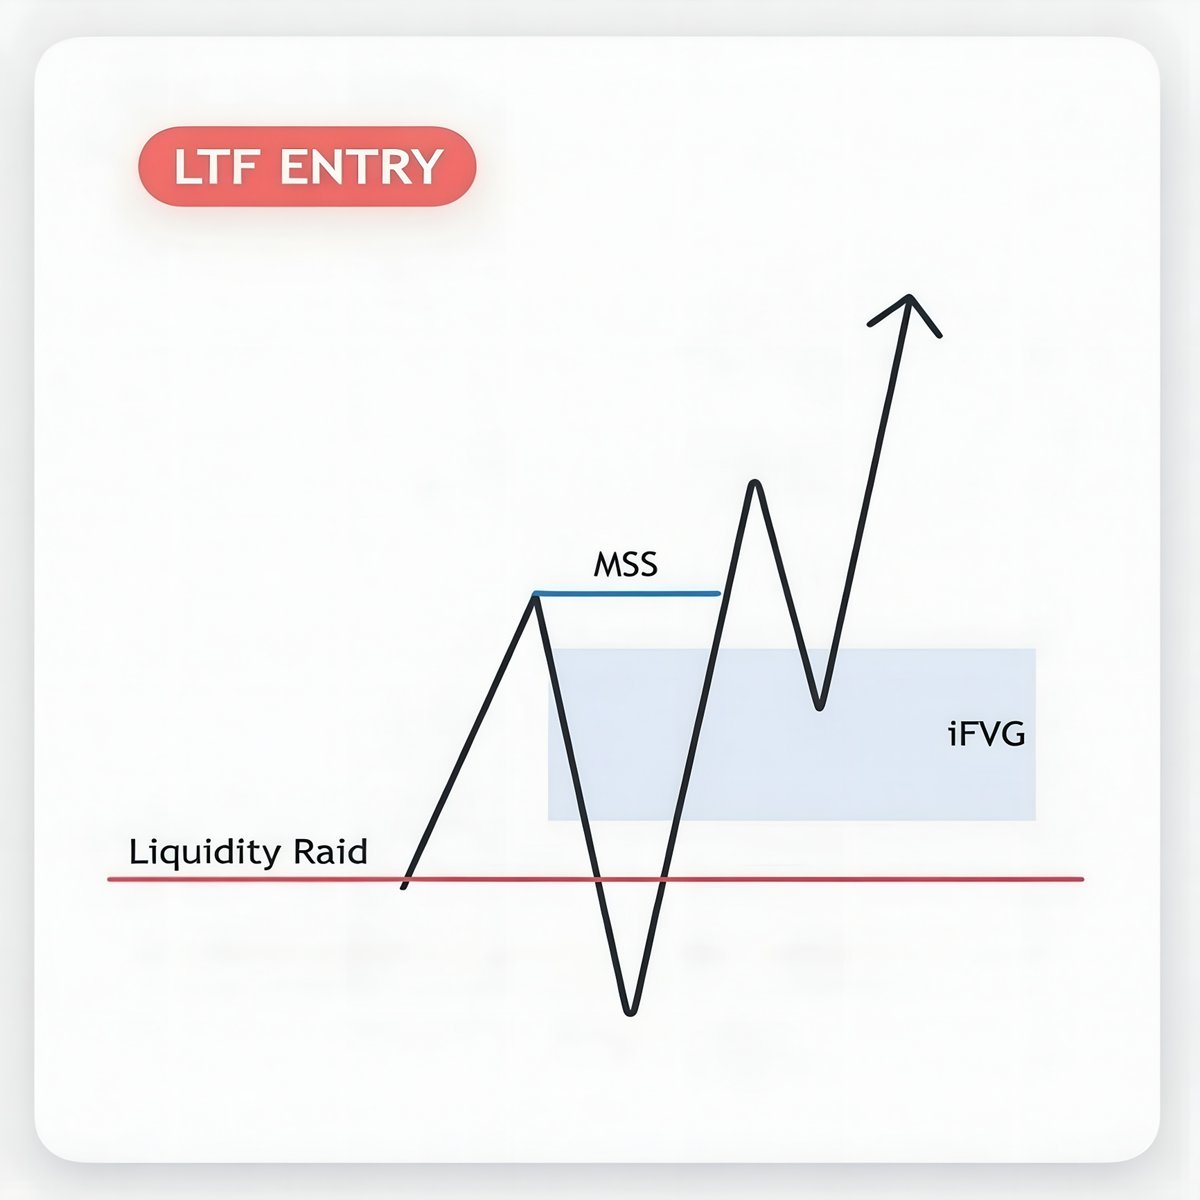
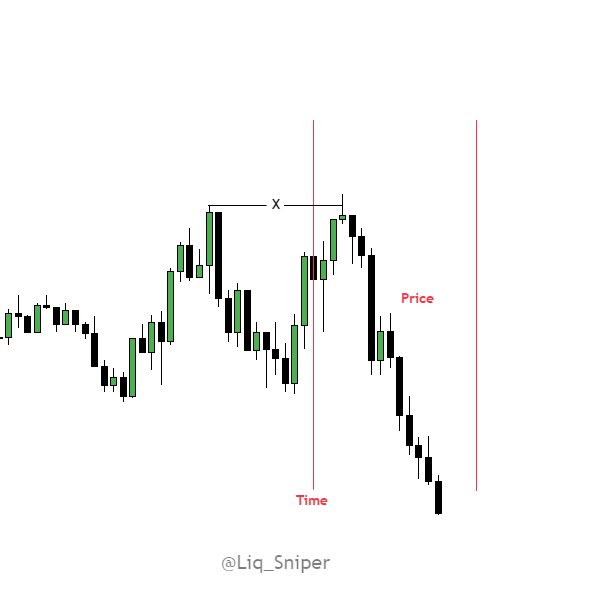
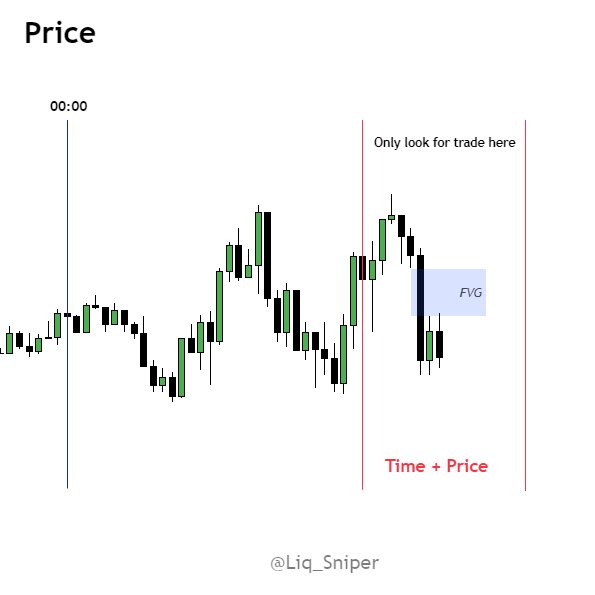
 Image
2.2 Price :
The best time to look for "price" is when it's inside the Killzone (time).

Essentially, that's where we want price to reach in order to take a position.

This alignment with time is crucial for making decisions about taking a position.
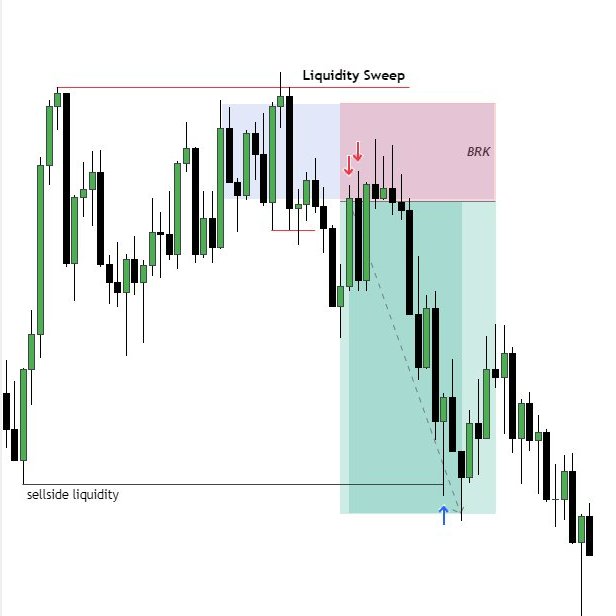
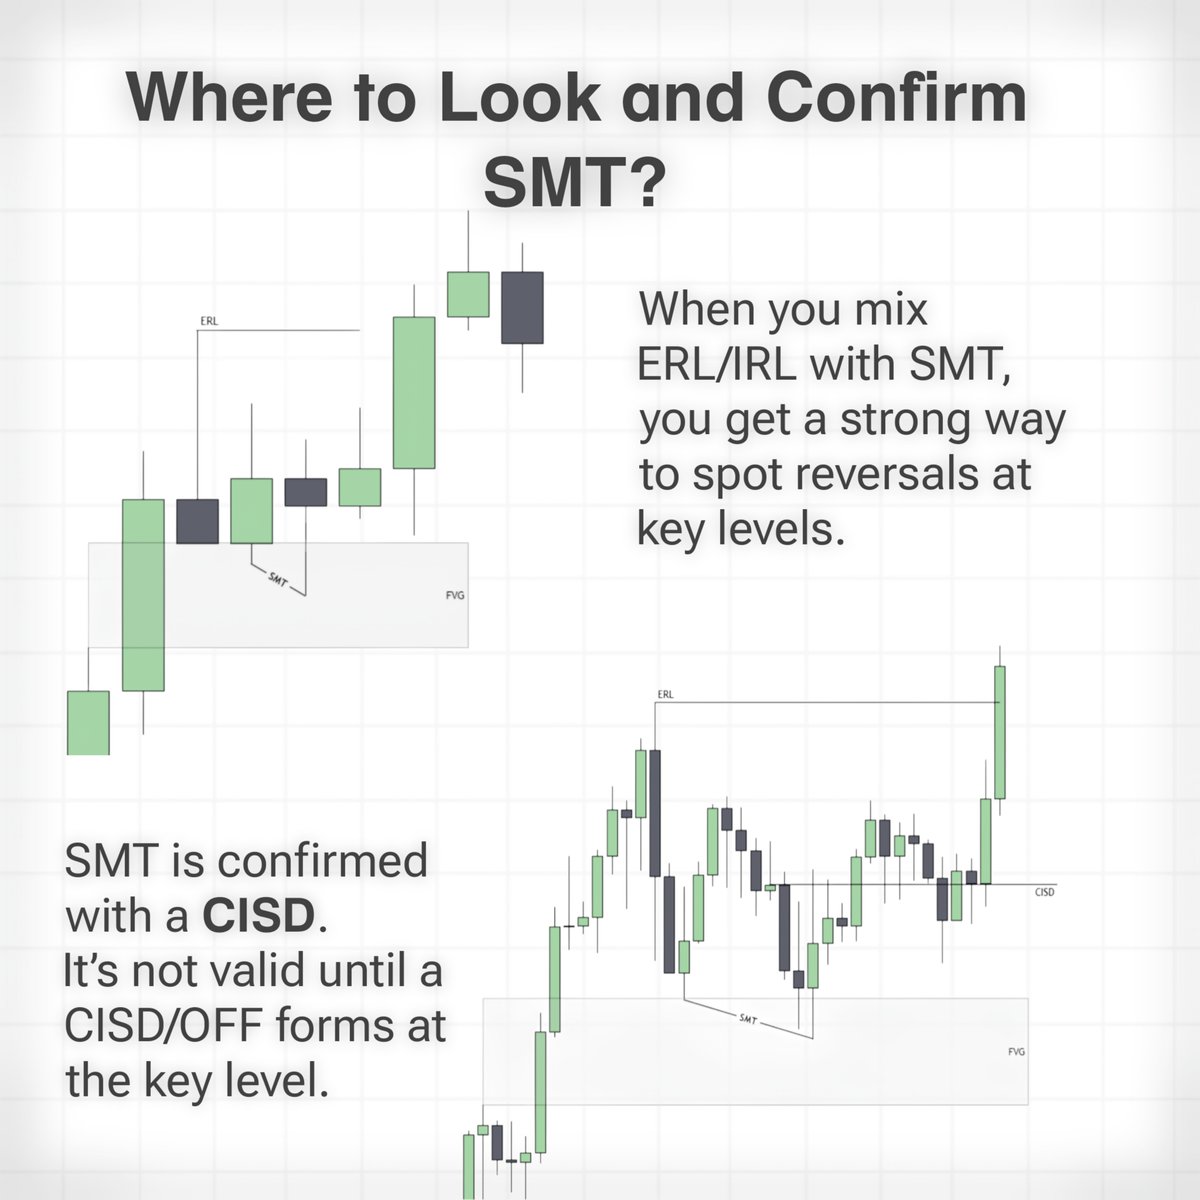
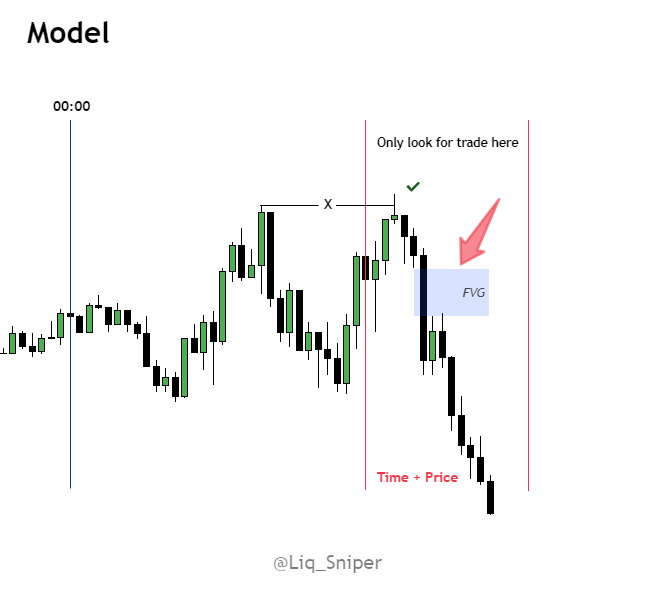
 Image
3. Model :

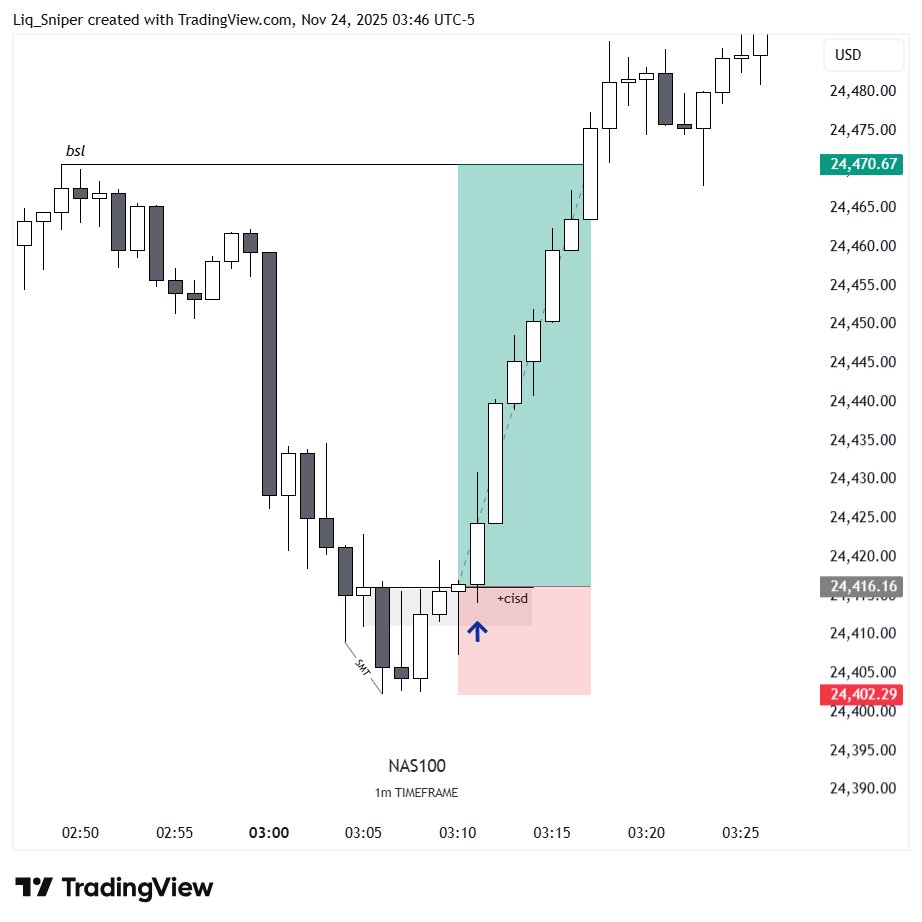
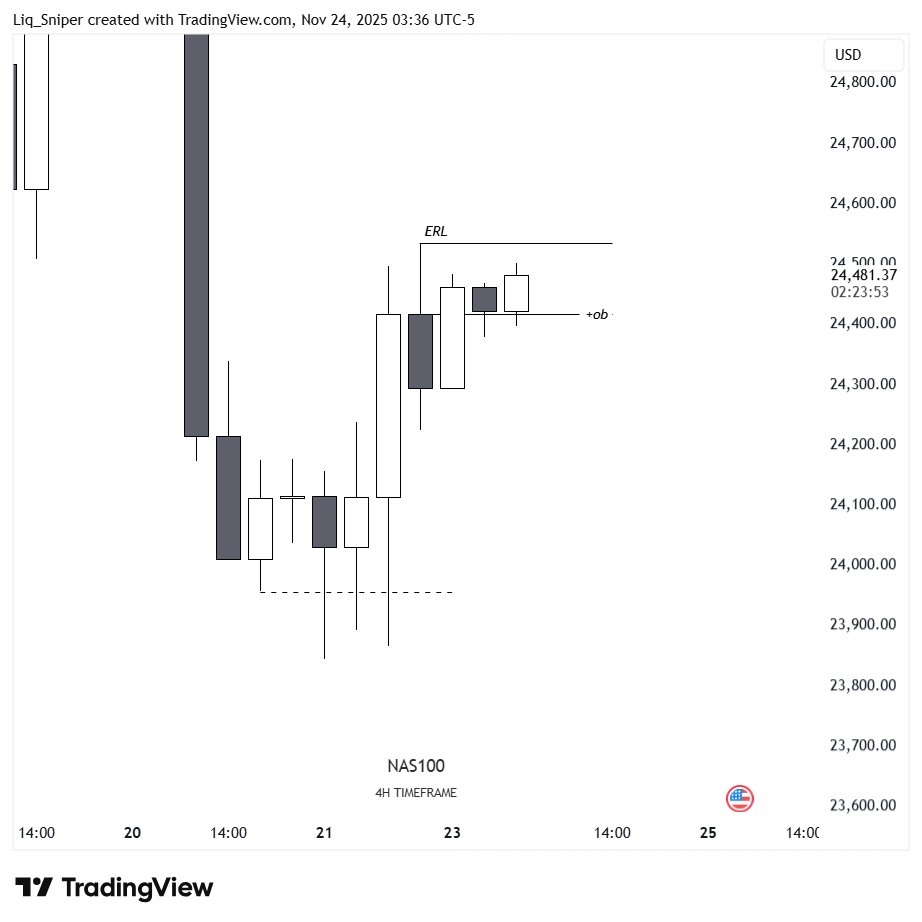
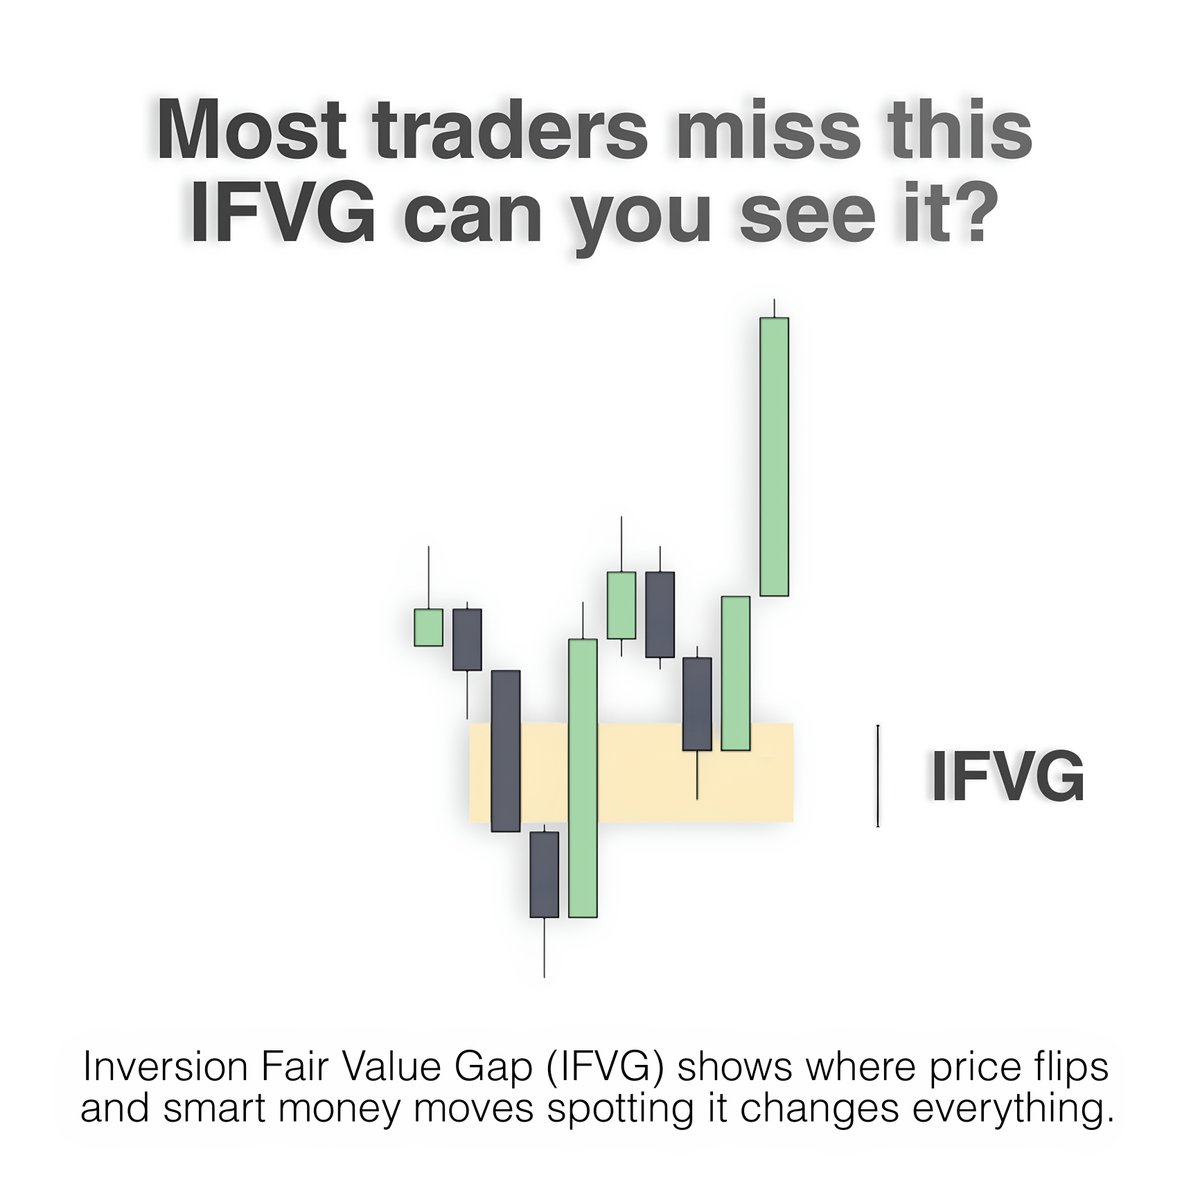
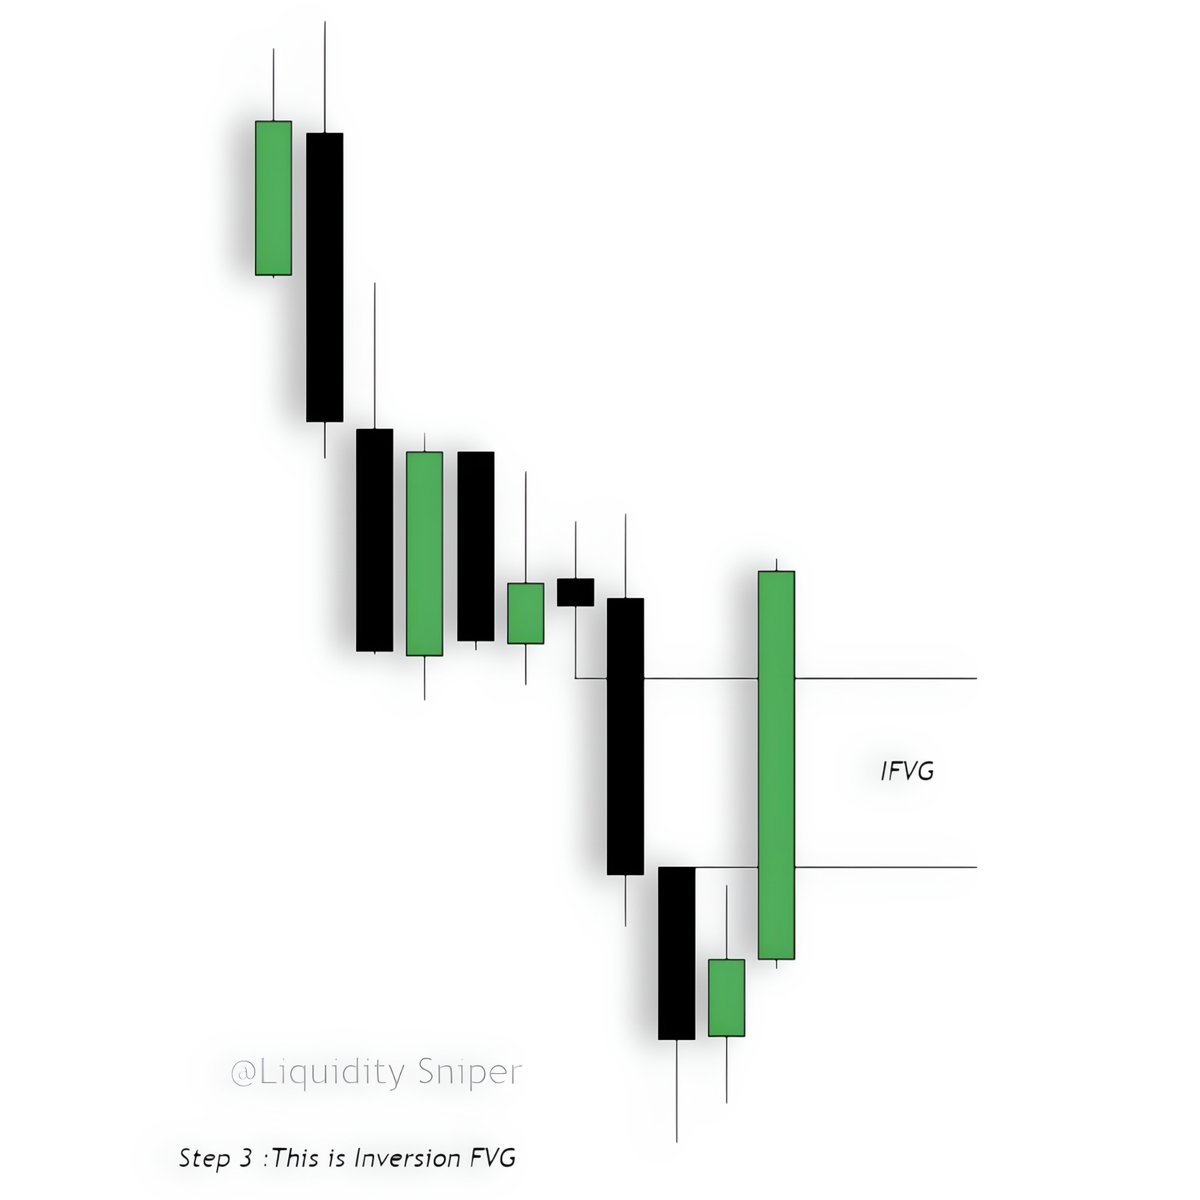
When "Price and Time" aligns, use FVG's or OB's as confluence to take the trade.

This high probability setup is formed by:
- Time (Killzone)
- Price
- FVG, OB, BB Image
Join for Educational content and weekly outlook : t.me/Liquidity_Snip…
I use to trade @AscendxCapital

Great Opportunity to start With Ascendx and experience the Amazing Trading conditions!

🔰USE CODE :- PROP30

For 30% discount on All trading Evaluations! Image

• • •

Missing some Tweet in this thread? You can try to force a refresh
 

Keep Current with Liquidity Sniper

Liquidity Sniper Profile picture

Stay in touch and get notified when new unrolls are available from this author!

Read all threads

This Thread may be Removed Anytime!

PDF

Twitter may remove this content at anytime! Save it as PDF for later use!

Try unrolling a thread yourself!

how to unroll video
  1. Follow @ThreadReaderApp to mention us!

  2. From a Twitter thread mention us with a keyword "unroll"
@threadreaderapp unroll

Practice here first or read more on our help page!

More from @Liq_Sniper

Nov 24
$NQ - Only one model everyday

Study this.⬇️

1️⃣ Liquidity Sweep
2️⃣ CISD & SMT
3️⃣ DOL✅

A Thread 🧵 Image
Daily Timeframe: Image
4 Hour Timeframe: Image
Read 7 tweets
Oct 10
Most traders ignore Inversion Fair Value Gaps (IFVG). Smart money doesn’t.

Once you understand how they flip liquidity and bias, you’ll see the chart differently. 👇

[🧵Thread] Image
What is Inversion FVG (IFVG)?

Inversion FVGs are fair value gaps that fail and show a change in market flow.

They can be used as entries on lower or higher timeframes, points of interest, or signals of market structure change. Image
A bullish inversion happens when price closes above a SIBI FVG.

This shows the flow changed from selling to buying, and the FVG now acts as support.

Step 1 : Mark FVG Image
Read 11 tweets
Oct 2
ICT A+ Liquidity Model - How to Use Them to Quit Your 9-5 Job

A Thread 🧵 Image
The Only Trading Model You Need

1. Define your daily bias (bullish or bearish)
2. Wait for the Killzone session to initiate
3. Enter after a liquidity sweep (internal or external)

Keep it simple. Trade with clarity. Image
Next Steps in the Model

4. Once liquidity is taken, study how price reacts.
5. Then, spot and track the Market Structure Shift (MSS). Image
Read 9 tweets
Sep 17
𝗠𝗮𝘀𝘁𝗲𝗿𝗶𝗻𝗴 𝗦𝗠𝗧

SMT Divergence For beginners. This is a foundational thread which explains all you need to know.

- I'll DM you the PDF, read until the end.

A Thread🧵 Image
What is SMT?
SMT shows up when two assets that usually move together start acting differently.
Look for a “failure swing” — when one tries to move but can’t.

Markets turn in two ways: liquidity grabbing (breaker) or failing to grab them (failure). Image
Where to Look and Confirm SMT?

When you mix ERL/IRL with SMT, you get a strong way to spot reversals at key levels.

SMT is confirmed with a CISD. It's not valid until a valid CISD/OFF forms at the key level. Image
Read 6 tweets
Aug 6
Years of Losses Taught Me ONE Game-Changing Daily Bias Trick

95% of Traders Fail Without THIS Consistent Strategy

Steal My Simple Daily Bias Method That Works for Anyone

[🧵 Thread] Image
What is an Daily Bias?

Daily bias is the expected direction (bullish or bearish) of the market for the day based on key levels and market structure. Image
Bullish Bias:

To find the daily bias, start by marking the high and low of the previous day's candle. These levels help you see where price might go next - whether it's likely to move up, down, or stay. Image
Read 9 tweets
Jun 9
$NQ - Only one model everyday

80+ Points from Breaker model

your free from 9-5 job

A Thread 🧵 Image
4 Hour timeframe : Image
15 Minutes timeframe : Image
Read 8 tweets

Did Thread Reader help you today?

Support us! We are indie developers!


This site is made by just two indie developers on a laptop doing marketing, support and development! Read more about the story.

Become a Premium Member ($3/month or $30/year) and get exclusive features!

Become Premium

Don't want to be a Premium member but still want to support us?

Make a small donation by buying us coffee ($5) or help with server cost ($10)

Donate via Paypal

Or Donate anonymously using crypto!

Ethereum

0xfe58350B80634f60Fa6Dc149a72b4DFbc17D341E copy

Bitcoin

3ATGMxNzCUFzxpMCHL5sWSt4DVtS8UqXpi copy

Thank you for your support!

Follow Us!

:(