Verdict: Further escalating cash burn, resources dropping below $8B, lack of operational profitability/cost improvements, and lackluster 2024 guidance. Rivian loses $39K per vehicle sold (gross).
1. Free Cash Flow significantly worsened to negative $1,523 million representing the 3rd consecutive quarter demonstrating widening cash burn.
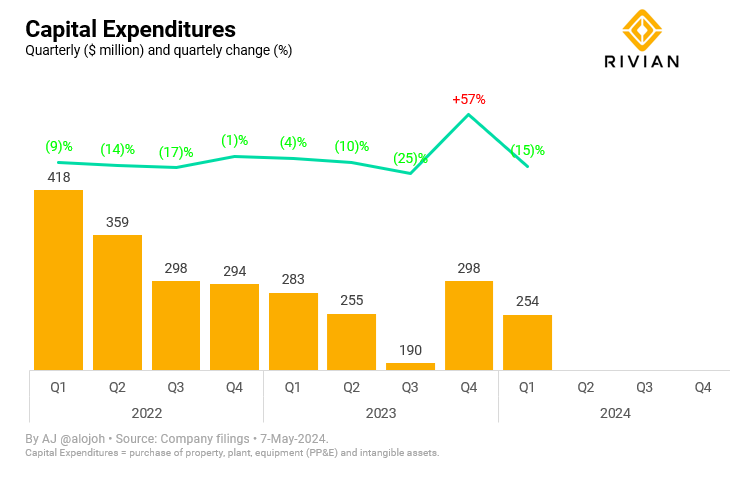
2. Cash burn increased despite a significant (15%) reduction in investments (capital expenditures) to just $254 million.
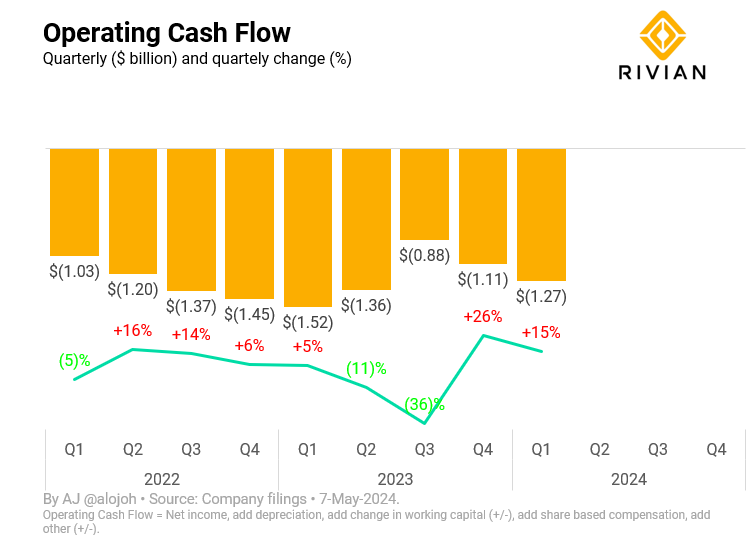
3. Poor free cash flow was partial due to the still very weak operating cash flow which worsened by 15% to negative $1.3 billion.
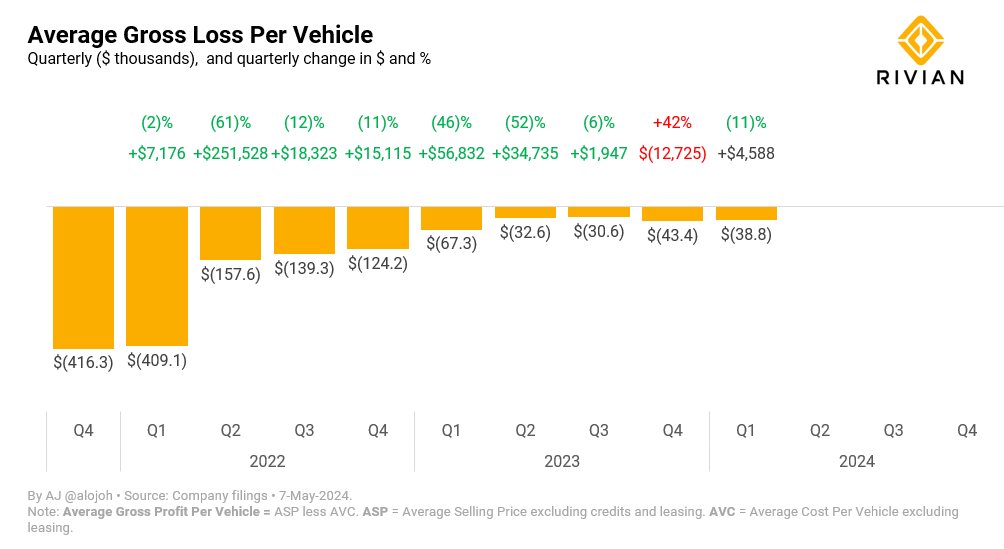
4. A significant driver of the weakening operational cash generation was the weakening operational profitability. Although gross losses reduced (13%) to $527M,...
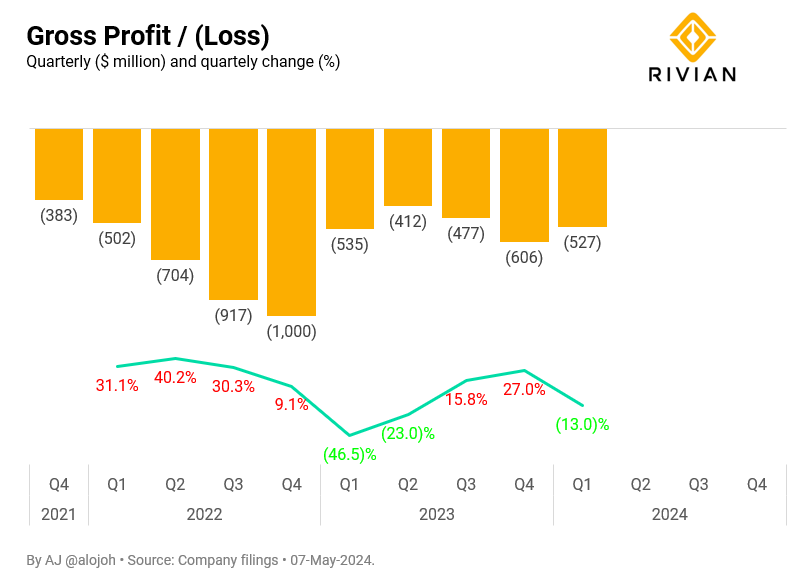
5. ...together with some Gross Margin improvements to negative 44% (from negative 46%).
6. Rivian's reducing revenues resulted in...
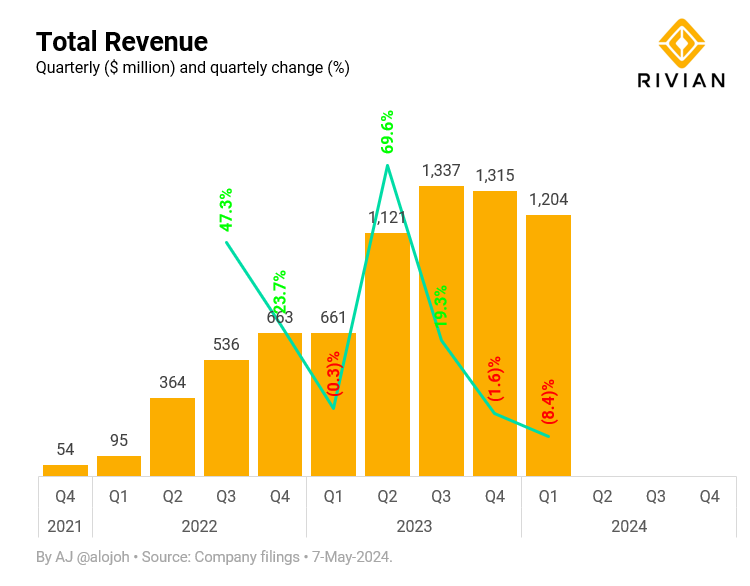
7. ...only moderate improvements in terms of operating profitability: Operating losses reduced from $1,581 million to $1,484 million.
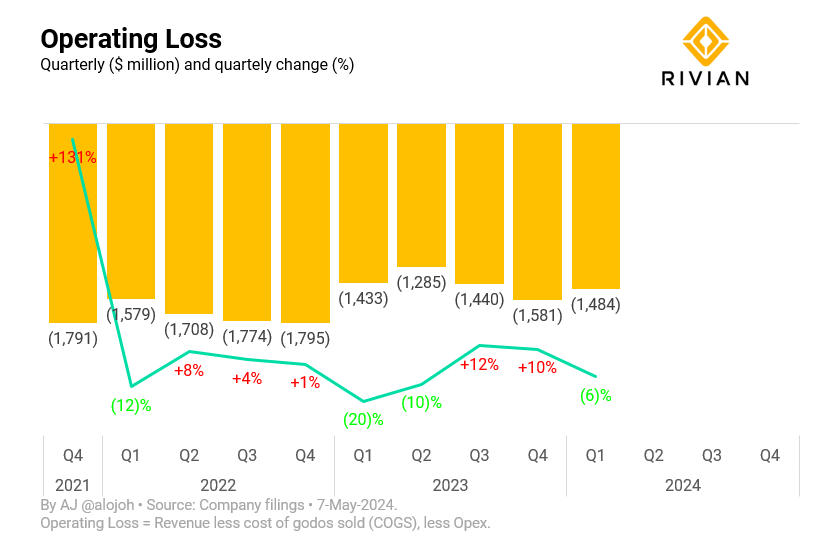
8. As a result, Rivian's operating margin worsened again to negative 123%, the second consecutive month.
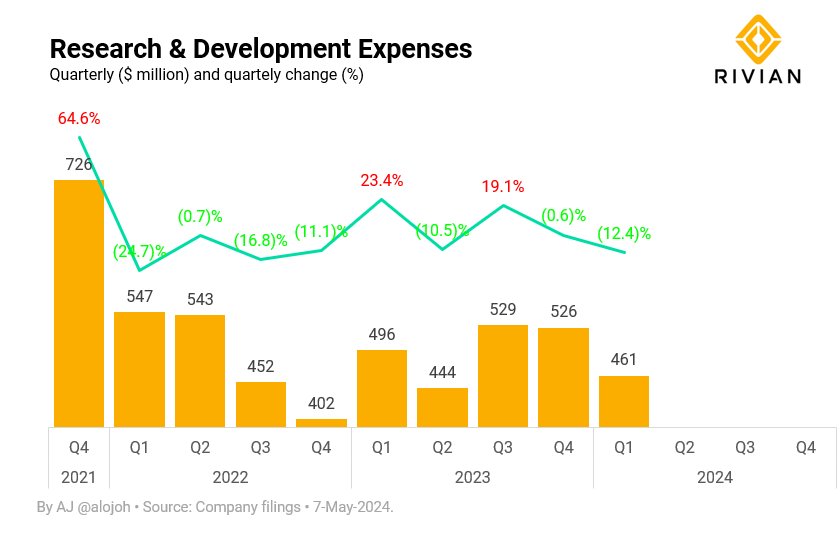
9. Rivian failed to improve operating profitability despite a significant reduction in R&D spending (12.4% less) to $461 million.
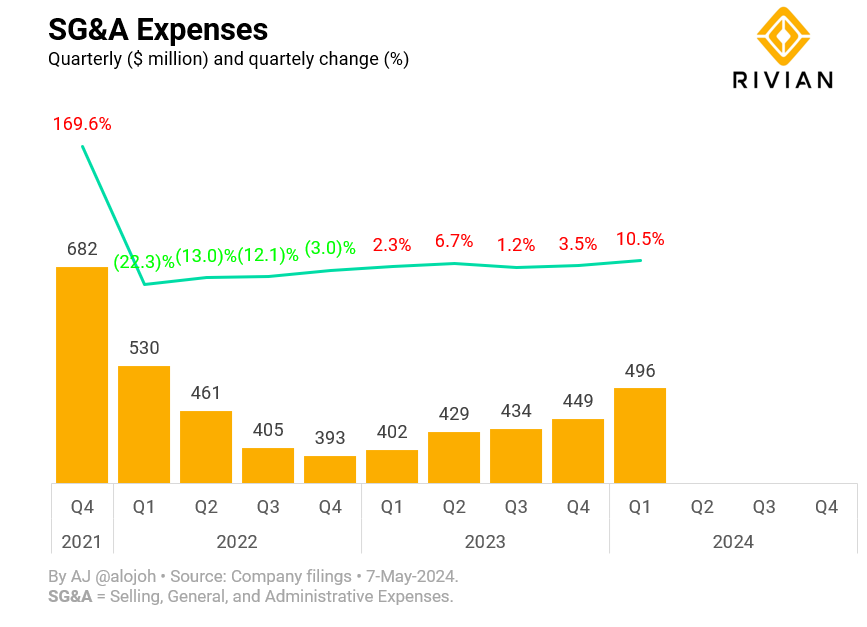
10. Additionally, Rivian's overhead expenses increased significantly - as was expected - from Rivian's announced layoffs. For reference: Tesla sells over 30x more vehicles than Rivian but Tesla's SG&A spending is only about 3x of Rivian's!.
11. As a result, overall operating expenses reduced only marginal (1.8% less) to $957 million.
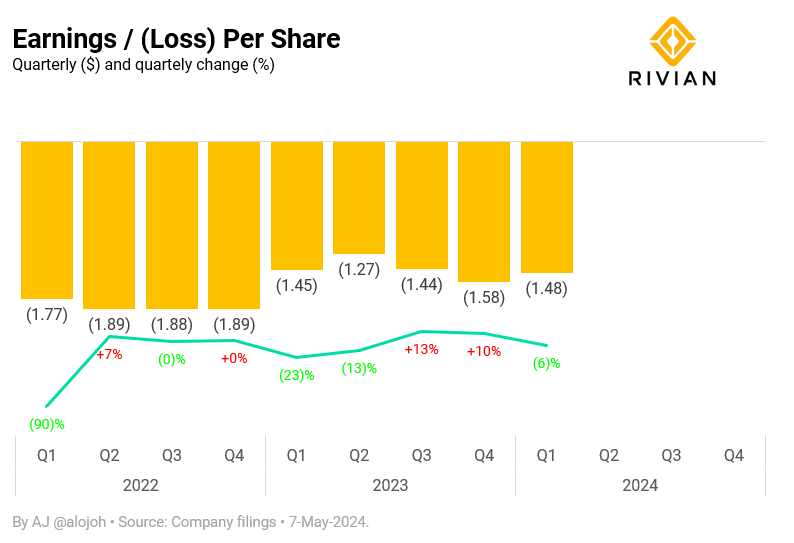
12. Losses attributable to shareholders reduced slightly (5% less) to $1,446 million
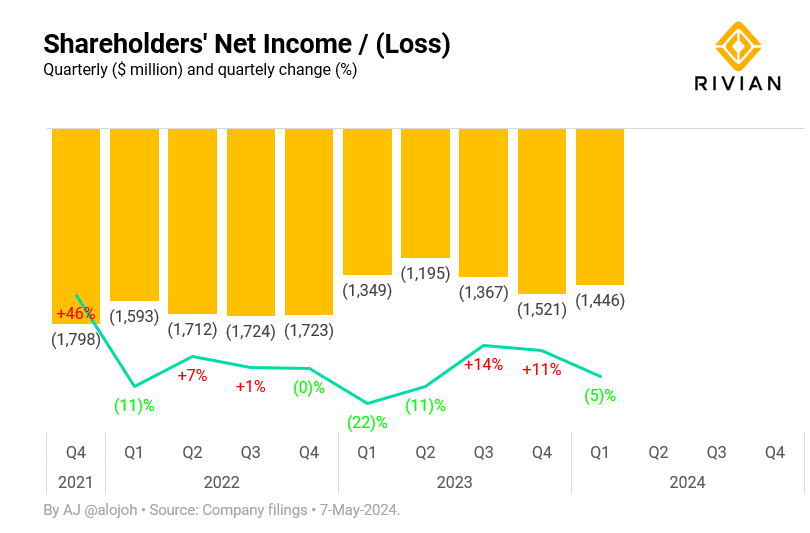
13. Losses per share reduced by a slightly higher amount (6% less) to a loss per share of $1.48.
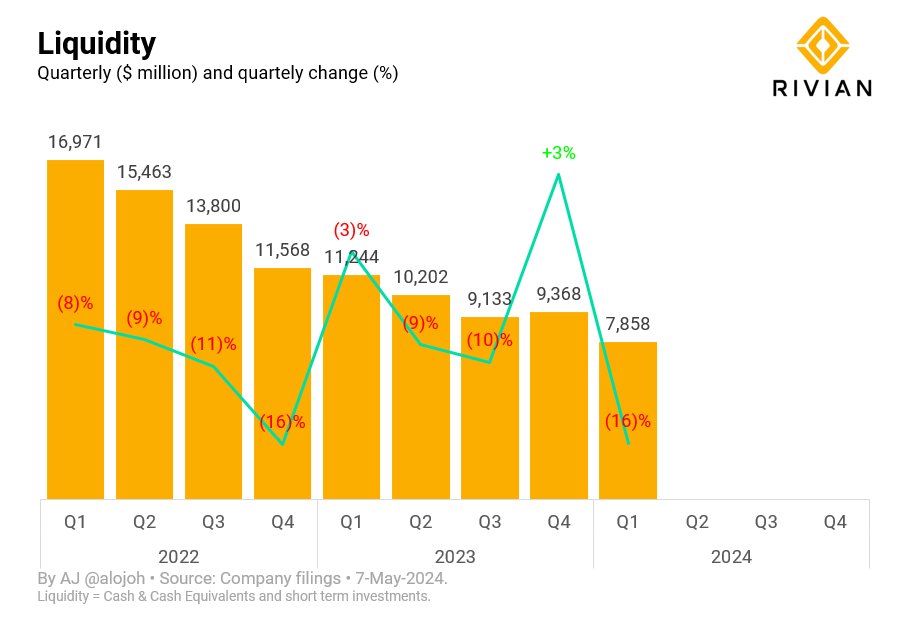
14. As a result of the operational losses and further inventory increases, Rivian's financial resources dropped for the first time below $8.0 billion despite substantial capital raises during 2023.
15. Rivian's long term debt balance remained unchanged in Q1 2024 after a significant increase in Q4 2023 to $4.4 billion.
16. Due to Rivian's rather high vehicle production cost of $127,400, which decreased by only 7% qoq, and...
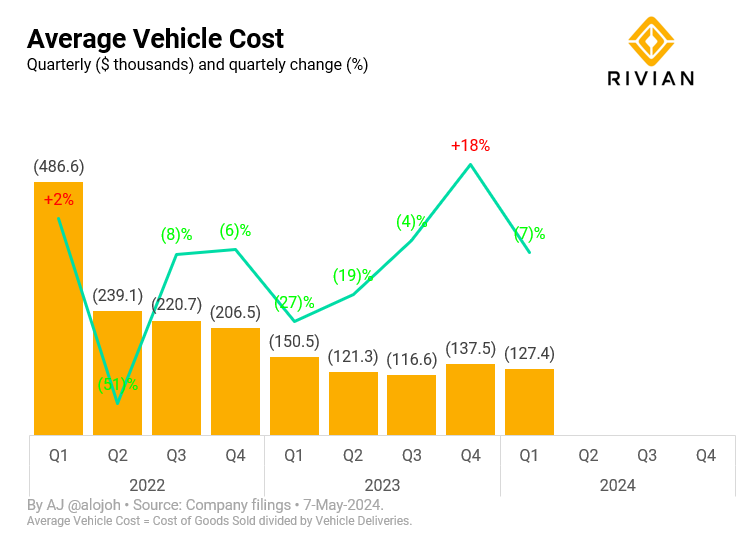
17. ...Rivian's significantly reducing (-6%) average selling price, Rivian...
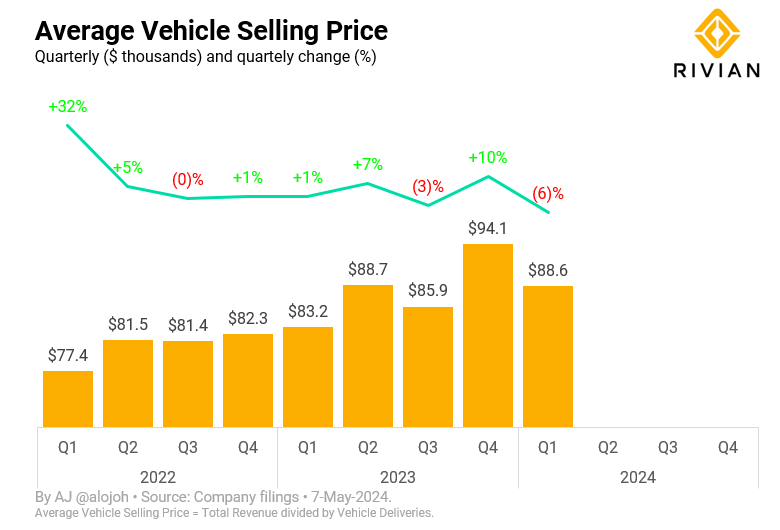
18. ...was unable to materially lower per-vehicle losses: at the current rate, it would take rivian >2 years to achieve $1 in profit per vehicle sold.
19. Rivian maintained a weak vehicle sales guidance for 2024 of 57,000 vehicles, implying an ex-growth scenario for Rivian's current line up.
• • •
Missing some Tweet in this thread? You can try to
force a refresh
In this thread I want to give you an idea just how insane the current government spending is and how far we drifted away from any sustainable fiscal spending.
This is all based on reported numbers and there are no assumptions/forecasts.
In the current fiscal year, the government already spent $4,159 billion. This is for the first 7 months and the fiscal year ends in September.
The latest available data is as of April. The already accrued deficit amounts to over $1 trillion: $1,049 billion.
You can see in the chart how net interest expense has become the #2 largest spending category at $579 billion (for 7 months) after social security ($907 billion) and even exceeded national defense ($536 billion), health ($555 billion), and Medicare ($550 billion).
The deficit is 34% of total receipts! (1049/3110)
In other words: the government spent 34% more than it took in.
Last year, at the same point in the fiscal year (April 2024), the deficit was $855 billion ($194 billion lower) and interest expense was $65 billion lower. Again, this is only for the first 7 months of the fiscal year for an apples-to-apples with the current fiscal year.
The deficit was 29% of total receipts! (855/2964)
The year prior to last year at the same time (April 2023) the government deficit was $925 billion and represented 34% of receipts!
This is a must read for TSLA investors. I shared this thread with subscribers last month.
***
This analysis considers Tesla's existing business (auto, energy, credits, S&O components) but also FSD subscriptions, semi, robotics (Optimus etc), Tesla owner ride hailing , and Tesla ride hailing (Cybercab).
Further, the auto segment includes the LCV (lower cost vehicle) and Cybercab for purchase from 3Q 2026.
1) Scope
The attached is not the full slide pack. I am sharing this shortened version in the interest of time. Outputting all modelled businesses would have delayed this report by a few days.
2) Change in frequency
Since many of you asked, going forward I'll be sharing an updated outlook more frequently in which I'll be adding additional outputs (slides) from the model as they become available.
The primary argument for a more frequent update would be incorporation of latest market data. Market data (ie share price) affect the multiple and hence the implied PT range. Also, more frequent updates help to incoporate lates vehicle sales trends.
3) My PT has changed significantly
My prior PT was based on Elon's October 2024 guidance of "20-30% year-on-year" volume growth in 2025.
The new PT's volume estimate is based on sales trends extrapolation and competitive dynamics by market. I've been using the leading global automotive database to derive a volume estimate based on the world's 11 major sales regions by model based on market share. At time of my prior PT this was not available to me.
Old PT: I will cover all changes separately with a detailed review of key drivers. There are various other drivers, ie not only volume.
4) In this thread
Slide 1-9: summary slides of key financial outputs.
Slide 10-13: step by step derivation of price target.
Slide 14: price target.
Slide 15-16: revenue, gp, and gm overview by business line.
Slide 17-19: auto, energy, S&O key drivers.
Slide 20-21: R&D and SG&A.
This is a 37-page financial deep dive into Tesla's Q1 results. I shared this report with subscribers the day after Tesla released results (April 22).
If you invest in Tesla consider subscribing to my research to be kept up-to-date on the company's financials.
In this thread I explain briefly why Hyundai turned into a zombie company.
Hyundai was the most cash burning automaker globally in 2024 with a negative free cash flow of $11.8 billion. In the fourth quarter of 2024 alone, Hyundai burned $5.4 billion. To fill the capital hole, Hyundai raised net $15B in capital in 2024 (financing cash flow).
Negative free cash flow was driven by a lack of operating cash flow (OCF). Hyundai's 2024 OCF was negative $4.2 billion.
Hyundai's negative free cash flow was further increased by $7.6B in capital expenditures.
The key takeway is that VW is done in China. This business won't provide upside to the group.
VW is simply not competitive in the BEV and quickly growing EREV segment while ICE market is shrinking rapidly.
This makes VW increasingly vulnerable to weakness in other geographies.
How is this relevant to investors?
[🔐subs only]
[the following thread as shared with subscribers on March 11, 2025]
***
VW Group's China business went from a cash cow to a non-needle mover.
This chart shows trailing 12 months China income: you can see how the decrease has been accelerating. VW Group's China JV income dropped to just $0.4B over the last 4 quarters.
This chart shows the quarterly income from the China business. You can see how both 2Q and 4Q were loss-making. 4Q is by far the strongest sales month in China. 1Q 2025 will be likely loss-making as well.