A thread about one of the many public sector scandals going under the radar....
The DfE "safety valves" for special educational needs.
These were started in 2021 due to councils getting into deficit on school spending because demand for special needs support has risen so much.
The DfE "safety valves" for special educational needs.
These were started in 2021 due to councils getting into deficit on school spending because demand for special needs support has risen so much.
There are now 38 councils with "safety valve" deals with the DfE (the euphamistic nature of the term is quite sinister).
It means they have to agree programmes of cuts to SEND support to get their deficit under control in return for additional financial support.
It means they have to agree programmes of cuts to SEND support to get their deficit under control in return for additional financial support.
These cuts are driven by what it takes to get the deficit under control not need.
So in practice once councils sign up, and they have little choice, they have to suppress demand and provide less support.
So in practice once councils sign up, and they have little choice, they have to suppress demand and provide less support.
We can see extensive demand suppression is going on (and not just in "safety valve" councils) because when parents take councils to tribunal they always win.
Success rate is now 98%. This is a sign of a system not working. Of course only parents with resources can do this.
Success rate is now 98%. This is a sign of a system not working. Of course only parents with resources can do this.
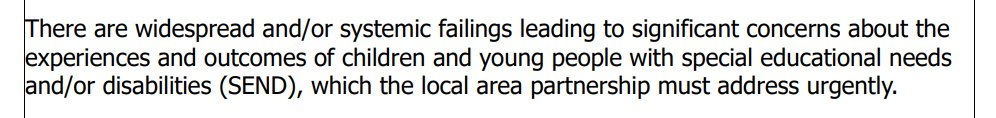
But we can also see that for those children still requiring support for special needs the quality is deteroriating badly. Particularly in some councils with "safety valves".
This is from Bury's Ofsted yesterday. They were one of the first to join the programme.

This is from Bury's Ofsted yesterday. They were one of the first to join the programme.

Some councils have found it impossible to maintain a service and stick to their deficit reduction plan. So the DfE have suspended support. We learnt a few weeks ago they're withholding £18 million from five councils on "safety valves".
schoolsweek.co.uk/ministers-with…
schoolsweek.co.uk/ministers-with…
This is not remotely sustainably. Support for children who need special needs support has already deteriorated badly and will keep getting worse.
The system needs more money and substantial reform. It's yet another problem that will be left for the next government to sort.
The system needs more money and substantial reform. It's yet another problem that will be left for the next government to sort.
If you want to find out more about this then @samanthajbooth is basically the one journalist covering it full time.
@cjayanetti has also written a fair bit about it.
@cjayanetti has also written a fair bit about it.
This is a list of all the councils with safety valves and what they've agreed to gov.uk/government/pub…
Not one cause. More children living longer with serious disabilities. Higher rates (and diagnosis) of autism. Increases in poverty leading to neglect. Lots of colliding factors.
https://x.com/Perrid13/status/1788105372269490512
As Adam notes here, the govt are currently excluding special needs debts from overall council debt but only until 2026. If included a dozen plus councils would go bankrupt so it also goes to the wider problem of local government funding.
https://twitter.com/AdamHighcliffe/status/1788113916989452482?s=19
• • •
Missing some Tweet in this thread? You can try to
force a refresh